. 2016 Nov 18;291(47):24551-24565.
doi: 10.1074/jbc.M116.756437. Epub 2016 Sep 27.

A Cytosolic Amphiphilic α-Helix Controls the Activity of the Bile Acid-sensitive Ion Channel (BASIC)

Affiliations

A Cytosolic Amphiphilic α-Helix Controls the Activity of the Bile Acid-sensitive Ion Channel (BASIC)

Axel Schmidt et al. J Biol Chem. .

Abstract

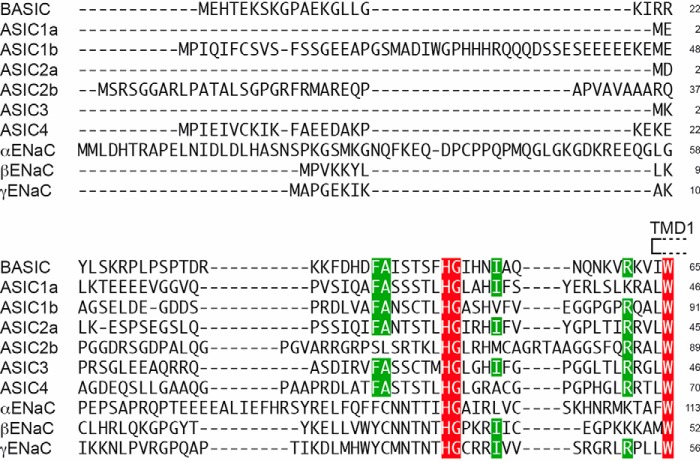
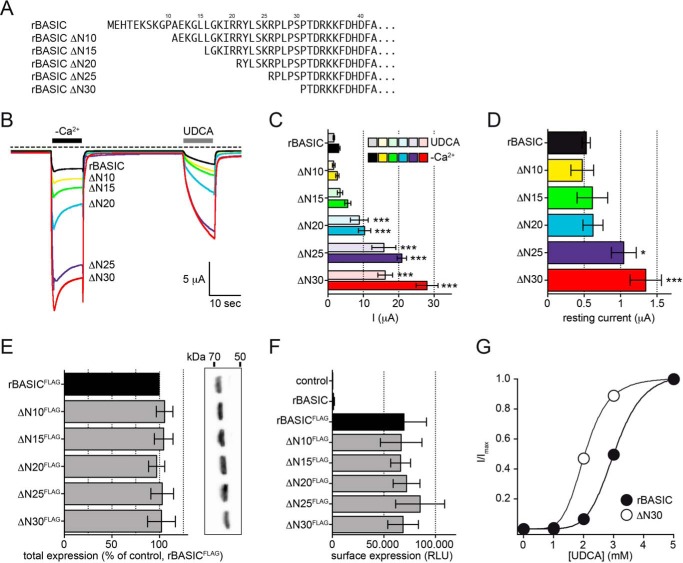
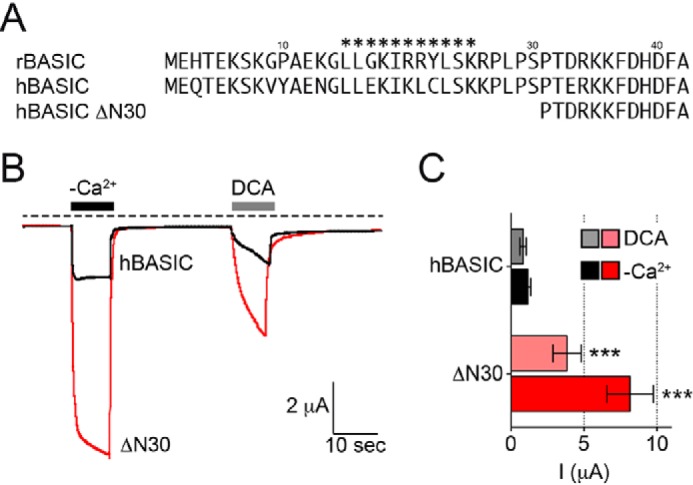
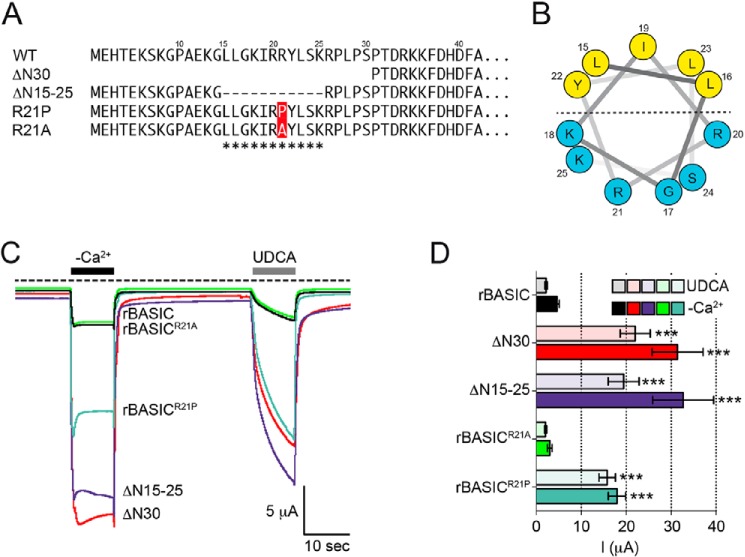
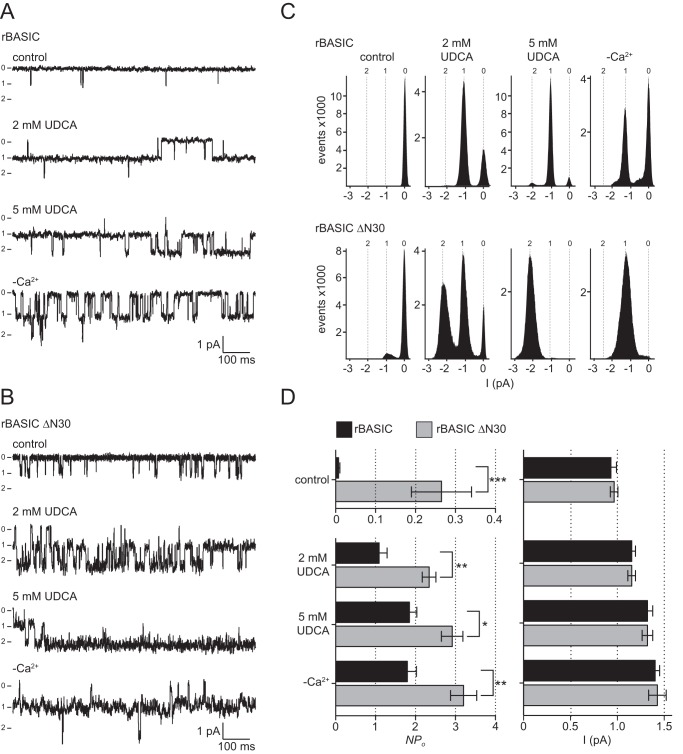
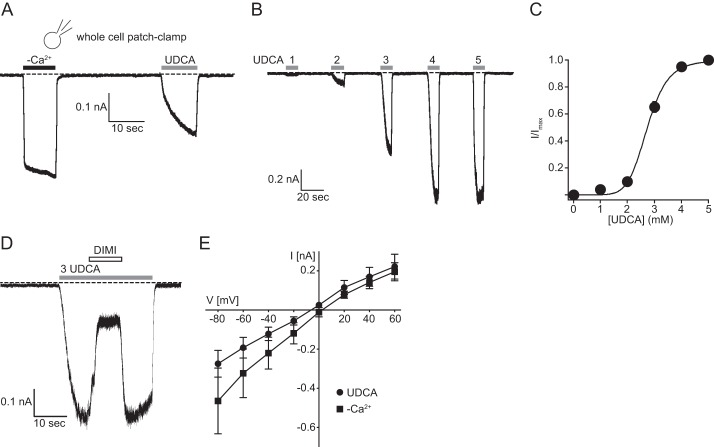
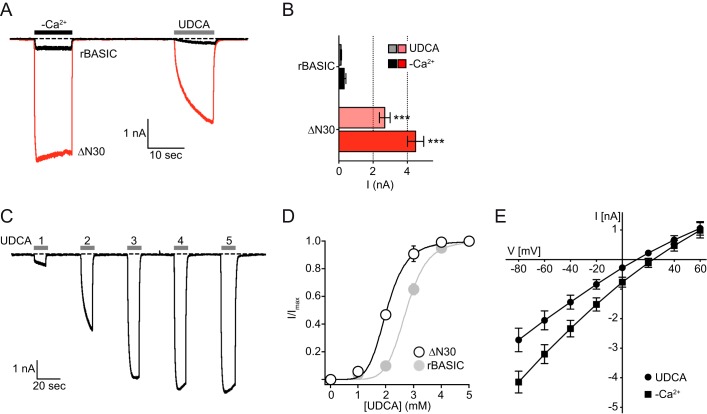
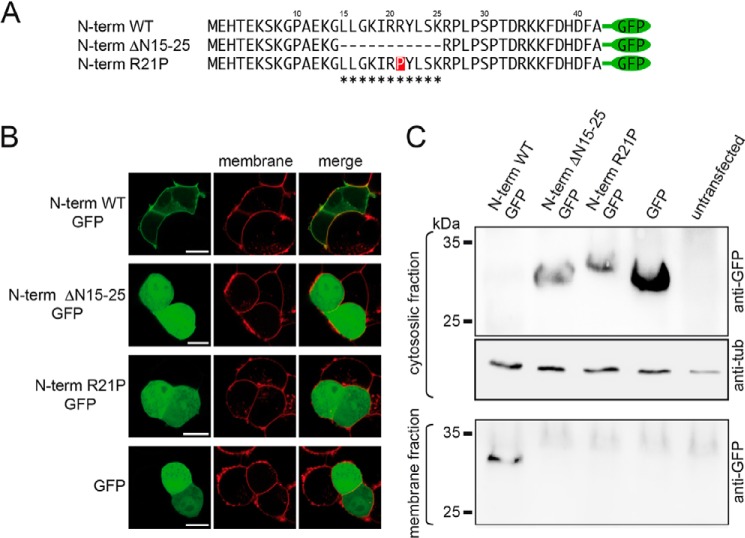
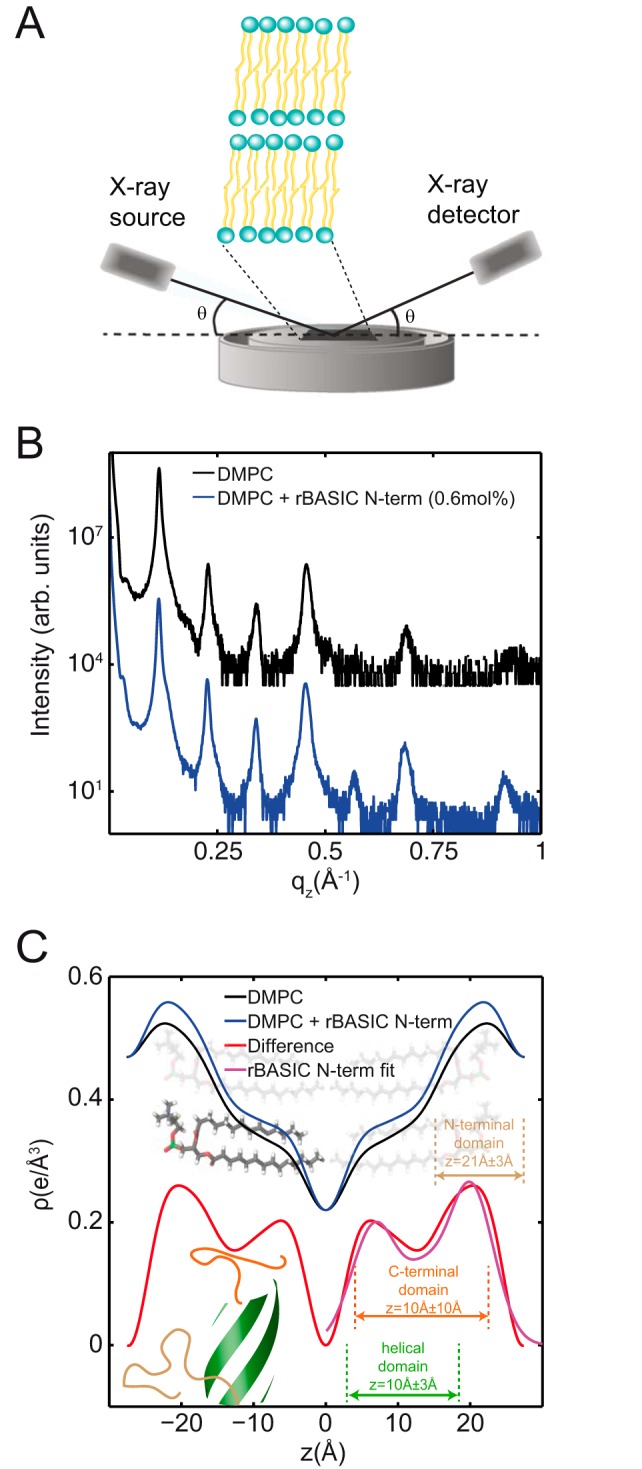
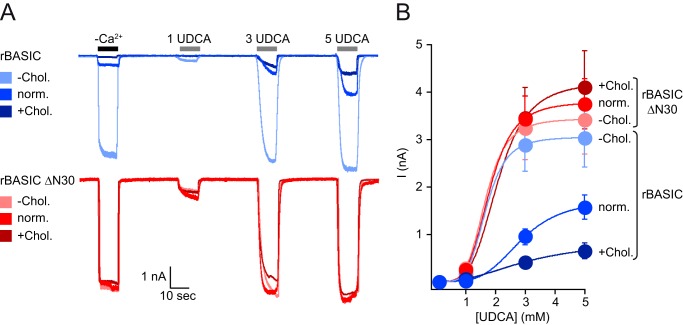
The bile acid-sensitive ion channel (BASIC) is a member of the degenerin/epithelial Na+ channel (Deg/ENaC) family of ion channels. It is mainly found in bile duct epithelial cells, the intestinal tract, and the cerebellum and is activated by alterations of its membrane environment. Bile acids, one class of putative physiological activators, exert their effect by changing membrane properties, leading to an opening of the channel. The physiological function of BASIC, however, is unknown. Deg/ENaC channels are characterized by a trimeric subunit composition. Each subunit is composed of two transmembrane segments, which are linked by a large extracellular domain. The termini of the channels protrude into the cytosol. Many Deg/ENaC channels contain regulatory domains and sequence motifs within their cytosolic domains. In this study, we show that BASIC contains an amphiphilic α-helical structure within its N-terminal domain. This α-helix binds to the cytosolic face of the plasma membrane and stabilizes a closed state. Truncation of this domain renders the channel hyperactive. Collectively, we identify a cytoplasmic domain, unique to BASIC, that controls channel activity via membrane interaction.

Keywords: BASIC; BLINaC; Deg/ENaC; X-ray scattering; Xenopus; amphiphilic helix; bile acid; cholesterol; ion channel; patch clamp.


Figures

FIGURE 1.
FIGURE 1.
Alignment of the N-terminal cytosolic sequences of the members of the Deg/ENaC family from Rattus norvegicus. Residues conserved between all members are highlighted in red, and residues conserved between BASIC and at least five members are highlighted in green. The first transmembrane domain is indicated by a box (TMD1); only few amino acids close to TMD1 show high conservation. Accession numbers are as follows: NP_071563, BASIC; NP_077068, ASIC1a; XP_008764015, ASIC1b; NP_001029186, ASIC2a; NP_037024, ASIC2b; NP_775158, ASIC3; NP_071570, ASIC4; NP_113736, αENaC; NP_036780, βENaC; NP_058742, γENaC. Alignment was performed using Clustal W version 2.1.
FIGURE 2.
FIGURE 2.
Successive truncation of the N-terminal domain increases the activity of rBASIC. A, representation of the N-terminal sequences of WT rBASIC and the respective truncations. B, representative current traces illustrating the activation of WT rBASIC, rBASIC ΔN10, ΔN15, ΔN20, ΔN25, and ΔN30 by the removal of extracellular divalent cations (−Ca2+) and application of 2 mm UDCA. C, quantitative comparison of current amplitudes induced by the removal of divalent cations (−Ca2+, solid bars) or application of 2 mm UDCA (transparent bars) as shown in B). Error bars, S.E., n = 12, ***, p < 0.001 (ANOVA). D, quantitative comparison of the resting current amplitudes before divalent free activation as shown in B. Error bars, S.E., n = 12, *, p < 0.05; ***, p < 0.001 (ANOVA). E, expression levels of WT rBASICFLAG and the respective truncations as determined by Western blotting. Left, quantitative analysis of Western blotting results (n = 5); band intensities were determined using the software BioChem (Vilber Lourmat, Eberhardzell, Germany) and normalized against rBASICFLAG. Right, representative Western blot. No significant differences between WT rBASIC and the respective truncations were identified (ANOVA). F, surface expression levels of WT rBASICFLAG and the respective truncations as determined by oocyte luminescence assay. Uninjected oocytes and control oocytes expressing rBASIC without FLAG epitope served as controls. No significant differences between WT rBASIC and the truncations were observed (ANOVA). G, concentration-response curve for UDCA for WT rBASIC (closed circles) and rBASIC ΔN30 (open circles). Currents were normalized to the maximum current in the presence of 5 mm UDCA, which were 30.4 ± 5.9 μA for WT rBASIC and 57.8 ± 7.2 μA for rBASIC ΔN30. Error bars, S.E., curves were fitted to the Hill equation (n = 8).
FIGURE 3.
FIGURE 3.
Removal of the N-terminal domain of hBASIC increases its activity. A, representation of the N-terminal sequences of rat and human BASIC and hBASIC with the ΔN30 truncation. B, representative current traces illustrating the activation of WT hBASIC and hBASIC ΔN30 by the removal of extracellular divalent cations (−Ca2+) or by the application of 1.5 mm DCA. C, quantitative comparison of current amplitudes induced by the removal of divalent cations (−Ca2+, solid bars) and 1.5 mm DCA (transparent bars) as shown in B. Error bars, S.E., n = 8, ***, p < 0.001 (ANOVA).
FIGURE 4.
FIGURE 4.
Amphiphilic α-helix in the N-terminal region forms an inhibitory domain. A, representation of the N-terminal sequences of rBASIC, rBASIC ΔN30, rBASIC ΔN15–25, rBASICR21P, and rBASICR21A; the putative α-helix is labeled with asterisks. B, helical wheel representation of the putative amphiphilic α-helix. The numbers represent the amino acid positions of WT rBASIC. Color code of amino acid residues: yellow, hydrophobic; blue, hydrophilic. C, representative current traces showing the activation of WT rBASIC, rBASIC ΔN30, rBASIC ΔN15–25, rBASICR21P, and rBASICR21A by the removal of extracellular divalent cations (−Ca2+) or the application of 2 mm UDCA. D, quantitative comparison of current amplitudes induced by the removal of divalent cations (−Ca2+, solid bars) or by the application of 2 mm UDCA (transparent bars) as shown in C. Error bars, S.E., n = 9, ***, p < 0.001 (ANOVA).
FIGURE 5.
FIGURE 5.
Truncation of the N-terminal domain of rBASIC increases the open probability of the channel. A and B, representative segments of single channel current traces from outside-out patches from oocytes expressing rBASIC WT (A) or rBASIC ΔN30 (B). The traces were recorded at a holding potential of −60 mV in the absence of an activating stimulus (control), the presence of 2 mm UDCA or 5 mm UDCA, or in the absence of extracellular divalent cations (−Ca2+) (0 = closed state and 1, 2 = open states). Currents were recorded for 30 s after each solution exchange. C, single channel binned amplitude histograms; data points were obtained from 10-s segments, including the current traces shown in A and B. Histograms were used to determine the channel activity (NPo). D, left panel, summary of calculated NPo values for rBASIC WT and rBASIC ΔN30 under control condition and after activation with 2 or 5 mm UDCA or by removal of extracellular divalent cations (−Ca2+) obtained from eight recordings similar to the recordings shown in A. Right panel, summary of single channel current amplitudes of rBASIC WT and rBASIC ΔN30 under control conditions and after activation with 2 or 5 mm UDCA or by removal of extracellular divalent cations (−Ca2+) from similar recordings as shown in A or B. n = 8; *, p < 0.05; **, p < 0.01; *, p < 0.001* (ANOVA).
FIGURE 6.
FIGURE 6.
Whole cell patch clamp recordings from HEK293 cells expressing rBASIC. A, representative current trace illustrating the activation of rBASIC expressed in HEK293 cells by the removal of extracellular divalent cations (−Ca2+) or by the application of 2 mm UDCA. B, representative current trace illustrating the concentration-dependent activation of rBASIC by UDCA. C, concentration-response curve for UDCA. Currents were normalized to the maximum current in the presence of 5 mm UDCA, which was 1.27 ± 0.25 nA. Error bars, S.E., curves were fitted to the Hill equation (n = 8). D, representative current trace illustrating the diminazene-dependent inhibition (10 μm diminazene) of rBASIC activated by 3 mm UDCA. E, mean current-voltage relationships of rBASIC in the absence of extracellular divalent cations (squares) or in the presence of UDCA (circles). The holding potential was increased stepwise from −80 to +60 mV in 20-mV steps. Error bars, S.E.; n = 8.
FIGURE 7.
FIGURE 7.
Removal of the N-terminal domain of rBASIC increases its activity in HEK293 cells. A, representative current traces illustrating the activation of WT rBASIC and rBASIC ΔN30 expressed in HEK293 cells by the removal of extracellular divalent cations (−Ca2+) or by the application of 2 mm UDCA. B, quantitative comparison of current amplitudes induced by the removal of divalent cations (−Ca2+, solid bars) or by the application of 2 mm UDCA (transparent bars) as shown in A. Error bars, S.E., n = 8, ***, p < 0.001 (ANOVA). C, representative current trace illustrating the concentration-dependent activation of rBASIC ΔN30 by UDCA. D, concentration-response curve of rBASIC ΔN30 for UDCA. Currents were normalized to the maximum current in the presence of 5 mm UDCA, which was 5.72 ± 0.63 nA. Error bars, S.E., curves were fitted to the Hill equation (n = 8). For comparison, the concentration-response curve of WT rBASIC for UDCA is shown in light gray. E, mean current-voltage relationships of rBASIC ΔN30 in the absence of extracellular divalent cations (squares) and the presence of UDCA (circles). The holding potential was increased stepwise from −80 to +60 mV in 20-mV steps. Error bars, S.E.; n = 8.
FIGURE 8.
FIGURE 8.
Amphiphilic α-helix mediates membrane association of the N-terminal region of BASIC. A, representation of the N-terminal sequences of rBASIC, rBASIC ΔN15–25, and rBASICR21P; the putative α-helix is labeled with asterisks. B, representative images of GFP fused to the N-terminal sequences of rBASIC or GFP alone in HEK293 cells (green, left panel). The plasma membrane was stained using CellMaskTM deep red plasma stain (red, middle panel). Right panel, merged images. Scale bars, 5 μm. C, representative Western blot showing the exclusive presence of the full N-terminal domain in the insoluble membrane fraction (lower panel), whereas the N-terminal domain lacking amino acids 15–25 and the N-terminal domain containing the R21P mutation are exclusively present in the cytosolic soluble fraction (upper panel). Loading control, tubulin (middle panel).
FIGURE 9.
FIGURE 9.
X-ray diffraction of synthetic membranes containing the N-terminal domain locate the peptide fragment within the membrane in a helical configuration. A, schematic of the experimental setup. The atomistic structure of oriented lipid bilayers was studied using X-ray diffraction in supported, highly aligned lipid membranes. B, out-of-plane diffraction measured from membrane complexes with and without the peptide fragment, rBASIC N-term. C, electron density profiles for each membrane complex, calculated by Fourier transformation of the Bragg peaks. The schematic lipids highlight the meaning of the features in the density profile: the peak at z ∼21 Å represents the electron-rich headgroup, although the bilayer center is between the tails of two lipid leaflets. The density of the peptide was calculated from ρrBASIC N-term(z) = ρrBASIC N-term + membrane(z), − ρmembrane(z) and is shown in the red curve. The electron density for a model of the peptide configuration and position is shown by the magenta curve.
FIGURE 10.
FIGURE 10.
rBASIC activity is dependent on the cholesterol content of the plasma membrane. A, representative current traces showing the activation of WT rBASIC (upper panel, blue traces) and rBASIC ΔN30 (lower panel, red traces) expressed in HEK293 cells by the removal of extracellular divalent cations (−Ca2+) and the application of increasing concentrations UDCA. Before current recordings, HEK293 cells were either incubated for 1 h in 10 mm MβCD to remove cholesterol from the plasma membrane (−Chol.) or incubated for 1 h in 10 mm water-soluble cholesterol to increase the cholesterol content of the plasma membrane (+Chol.). Untreated HEK293 cells served as control (norm.). B, concentration-response curves for UDCA for WT rBASIC and rBASIC ΔN30 recorded from cells treated with 10 mm MβCD or 10 mm water-soluble cholesterol or untreated as shown in A. Color coding matches traces shown in A. Error bars, S.E., curves were fitted to the Hill equation (n = 8).

Similar articles

Cited by

References

    1. Kellenberger S., and Schild L. (2002) Epithelial sodium channel/degenerin family of ion channels: a variety of functions for a shared structure. Physiol. Rev. 82, 735–767 - PubMed
    1. Kellenberger S., and Schild L. (2015) International Union of Basic and Clinical Pharmacology. XCI. structure, function, and pharmacology of acid-sensing ion channels and the epithelial Na+ channel. Pharmacol. Rev. 67, 1–35 - PubMed
    1. Wiemuth D., Assmann M., and Gründer S. (2014) The bile acid-sensitive ion channel (BASIC), the ignored cousin of ASICs and ENaC. Channels 8, 29–34 - PMC - PubMed
    1. Waldmann R., Champigny G., Bassilana F., Heurteaux C., and Lazdunski M. (1997) A proton-gated cation channel involved in acid-sensing. Nature 386, 173–177 - PubMed
    1. Bohlen C. J., Chesler A. T., Sharif-Naeini R., Medzihradszky K. F., Zhou S., King D., Sánchez E. E., Burlingame A. L., Basbaum A. I., and Julius D. (2011) A heteromeric Texas coral snake toxin targets acid-sensing ion channels to produce pain. Nature 479, 410–414 - PMC - PubMed

Substances

LinkOut - more resources