. 2016 Dec;65(12):3585-3597.
doi: 10.2337/db16-0709. Epub 2016 Sep 27.

Enhanced GLUT4-Dependent Glucose Transport Relieves Nutrient Stress in Obese Mice Through Changes in Lipid and Amino Acid Metabolism

Affiliations

Enhanced GLUT4-Dependent Glucose Transport Relieves Nutrient Stress in Obese Mice Through Changes in Lipid and Amino Acid Metabolism

Jami M Gurley et al. Diabetes. 2016 Dec.

Abstract

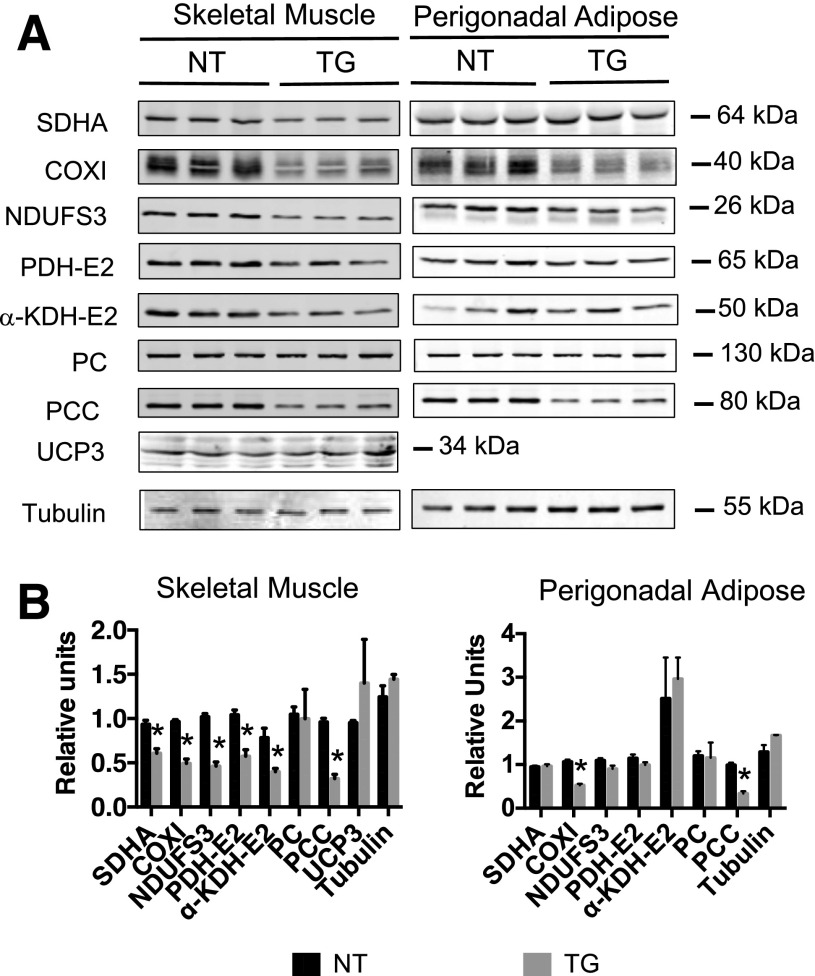
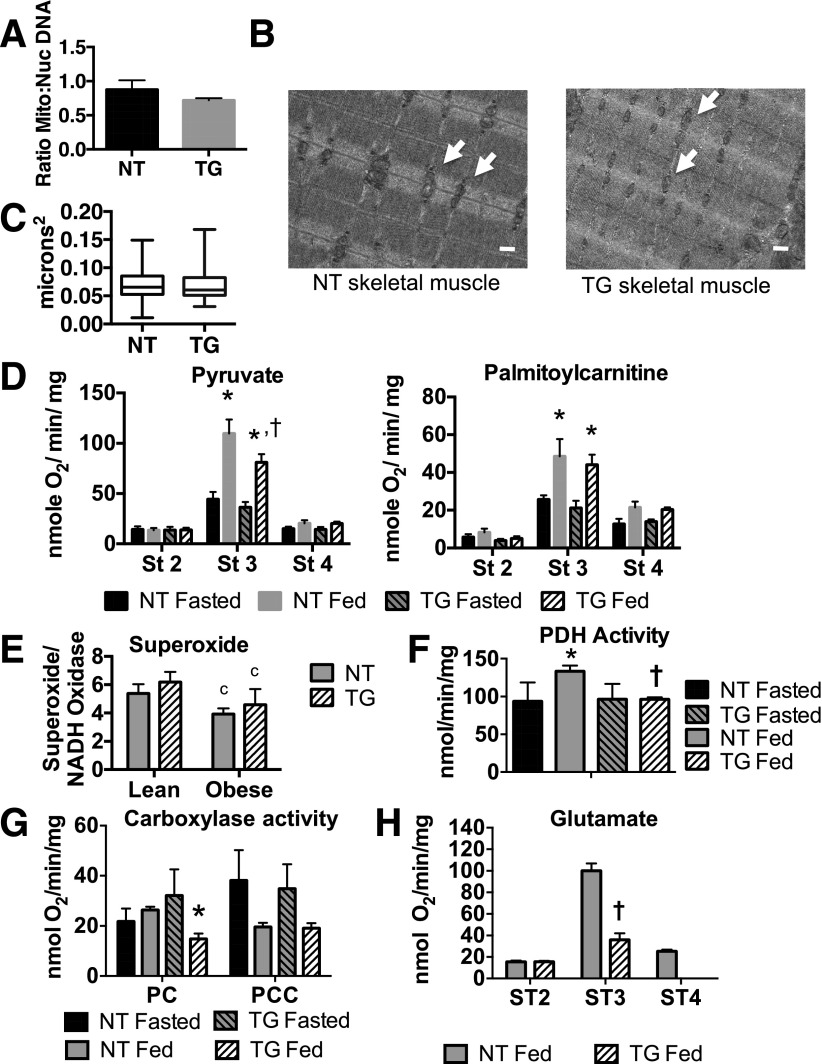
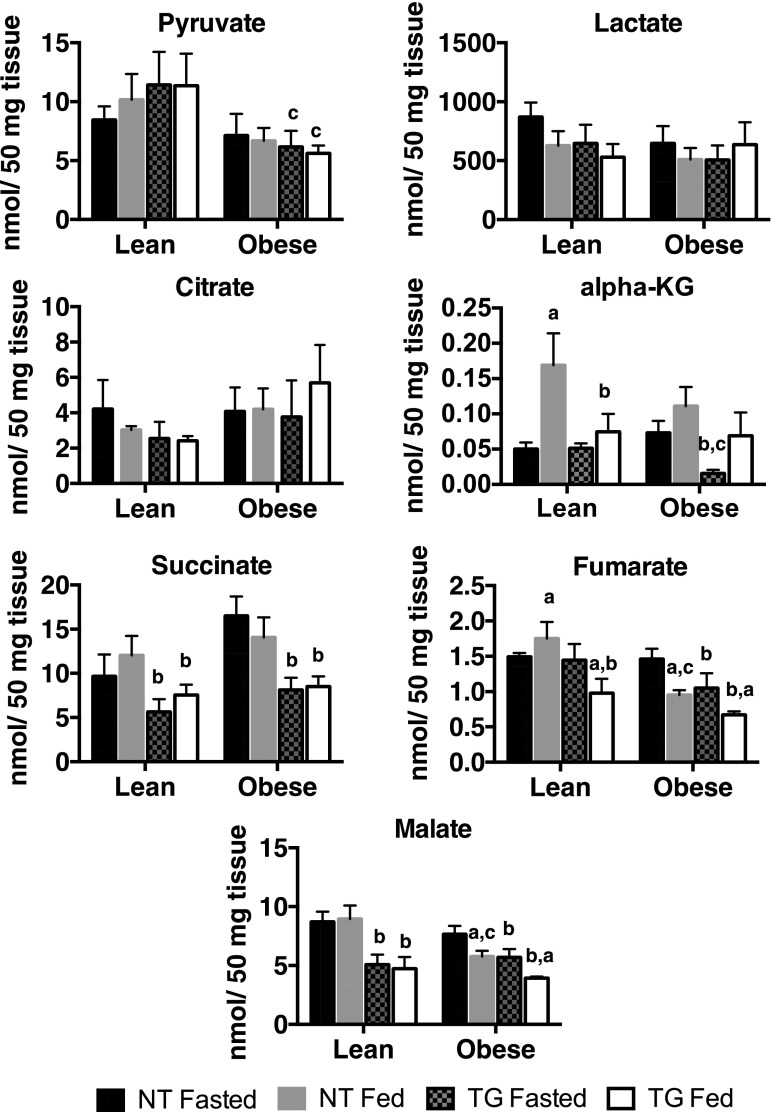
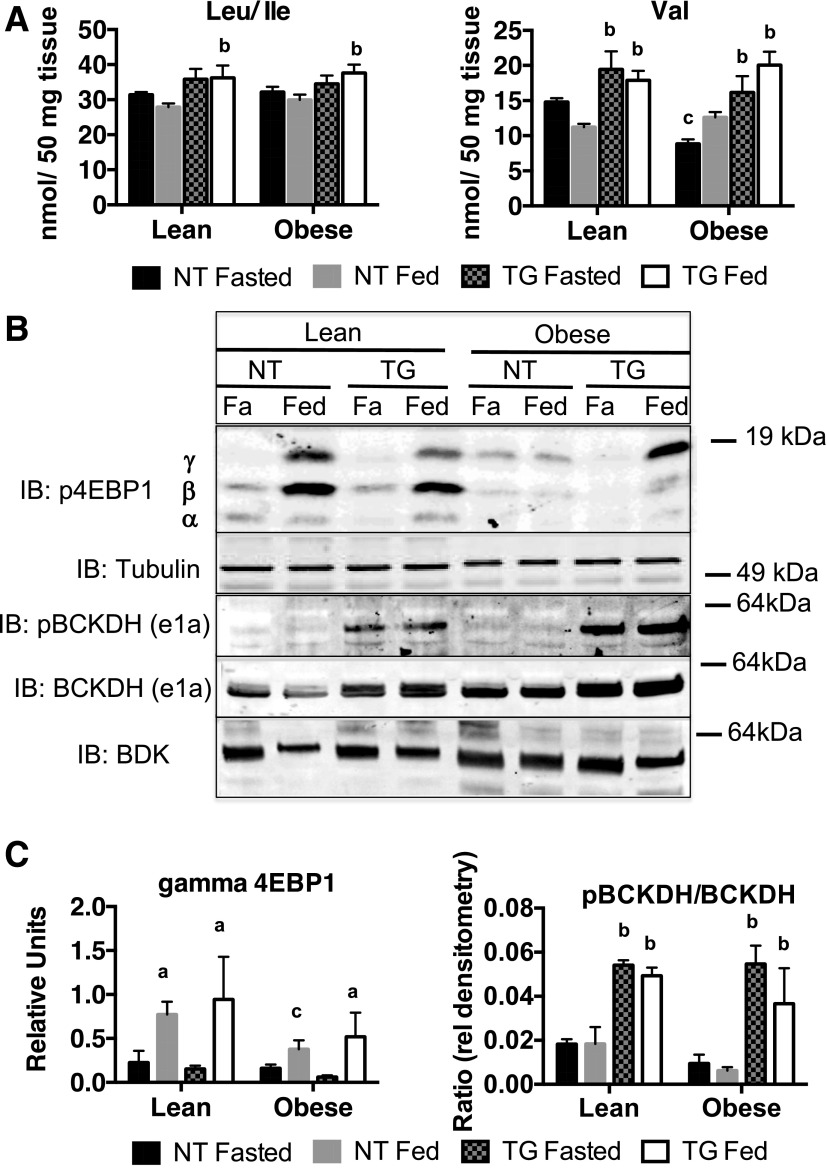
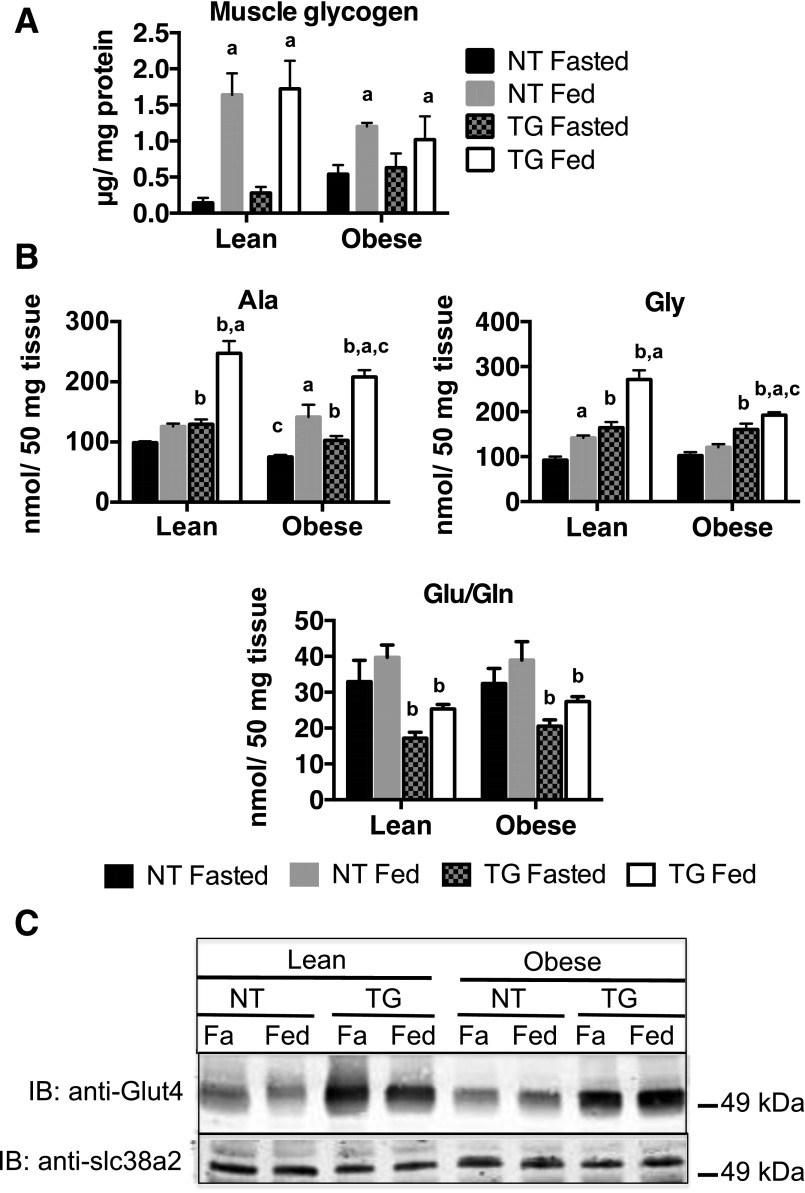
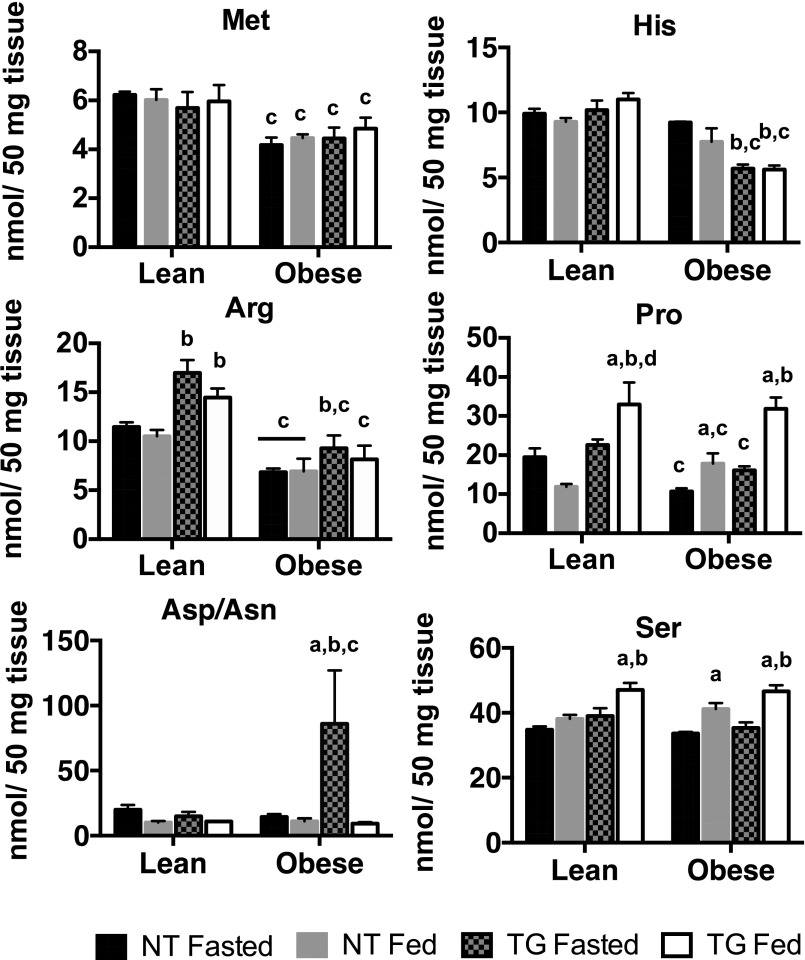
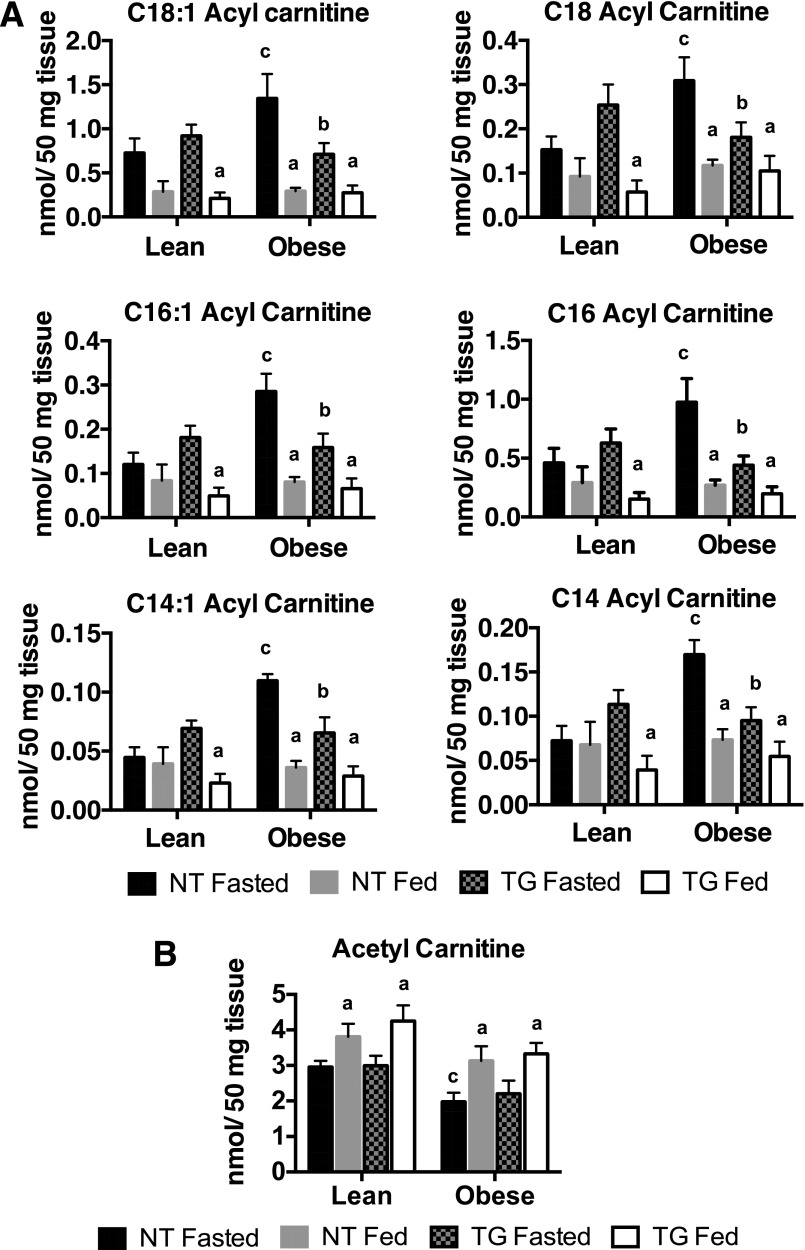
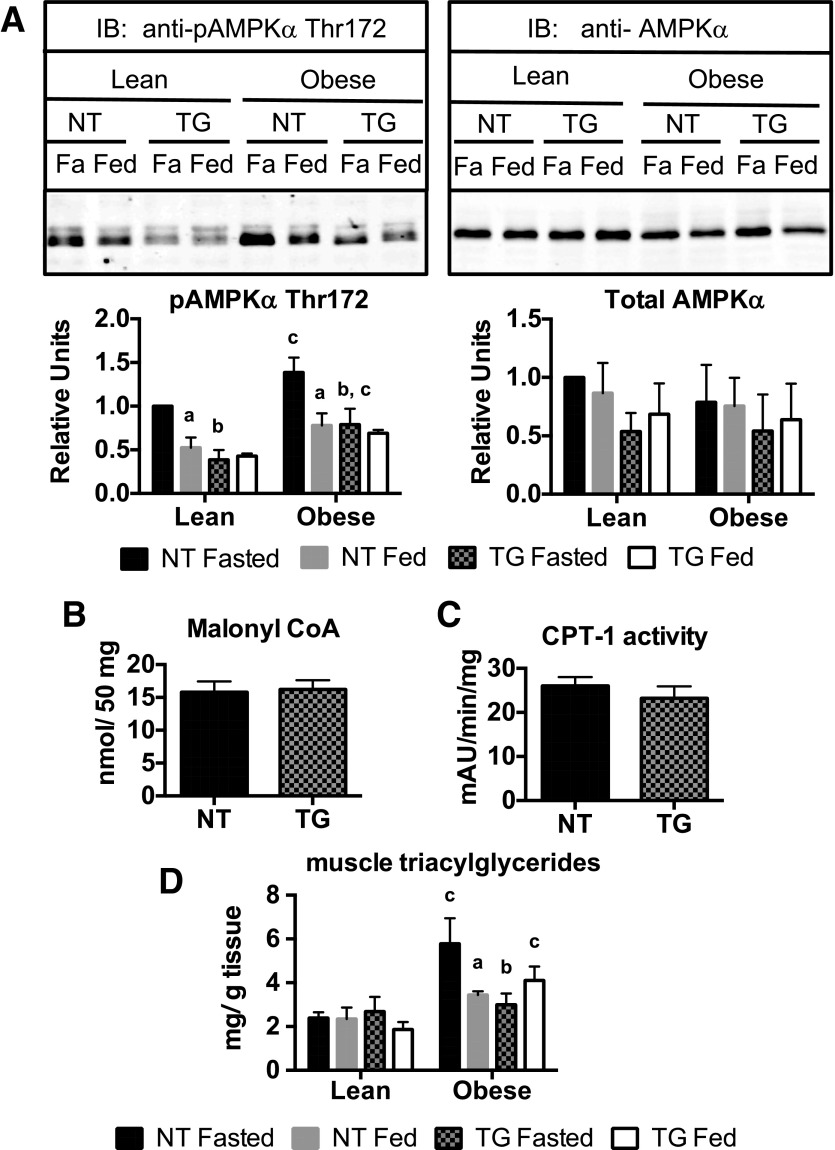
Impaired GLUT4-dependent glucose uptake is a contributing factor in the development of whole-body insulin resistance in obese patients and obese animal models. Previously, we demonstrated that transgenic mice engineered to express the human GLUT4 gene under the control of the human GLUT4 promoter (i.e., transgenic [TG] mice) are resistant to obesity-induced insulin resistance. A likely mechanism underlying increased insulin sensitivity is increased glucose uptake in skeletal muscle. The purpose of this study was to investigate the broader metabolic consequences of enhanced glucose uptake into muscle. We observed that the expression of several nuclear and mitochondrially encoded mitochondrial enzymes was decreased in TG mice but that mitochondrial number, size, and fatty acid respiration rates were unchanged. Interestingly, both pyruvate and glutamate respiration rates were decreased in TG mice. Metabolomics analyses of skeletal muscle samples revealed that increased GLUT4 transgene expression was associated with decreased levels of some tricarboxylic acid intermediates and amino acids, whereas the levels of several glucogenic amino acids were elevated. Furthermore, fasting acyl carnitines in obese TG mice were decreased, indicating that increased GLUT4-dependent glucose flux decreases nutrient stress by altering lipid and amino acid metabolism in skeletal muscle.


Figures

Figure 1
Figure 1
Expression of key mitochondrial enzymes in skeletal muscle and adipose tissue of hGLUT4 TG mice. A: Western blot analysis of three independent muscle samples measuring SDHA, COXI of complex IV, NDUFS3 subunit of complex I, E2 subunit of PDH (PDH-E2), E2 subunit of α-KGDH (α-KDH-E2), PC, PCC, UCP3, and tubulin. The samples were taken from NT mice fed a CD and hGLUT4 TG mice fed a CD. B: Western blot analysis histograms represented as the mean and SEM of the three independent samples. The asterisk (*) indicates the statistically significant difference (P < 0.05), as determined by two-tailed t test.
Figure 2
Figure 2
Skeletal muscle mitochondrial structure and function in NT mice fed a CD and hGLUT4 TG mice fed a CD. A: Ratio of mitochondrial (Mito) genomic DNA to nuclear (Nuc) DNA for CD-fed NT and TG mice. The data are the mean and SEM of three independent measurements. B: Electron micrographs of gastrocnemius skeletal muscle from CD-fed NT and TG mice. White arrowheads indicate examples of mitochondria. The white bar represents 500 nm. C: Box and whisker plot of mitochondrial area of 30 individual mitochondria from two NT and two TG mice. D: States 2, 3, and 4 respiration rates of pyruvate or palmitoylcarnitine from isolated mitochondria preparations from fasted and fed mice. E: Superoxide production unit of NADH oxidase activity in permeabilized mitochondria isolated from gastrocnemius muscle from CD-fed (lean) or 5-week HFD-fed (obese) mice. F: PDH from isolated mitochondria from fed and fasted mice. G: Pseudo-state 3 oxygen consumption rates for PC- and PCC-dependent respiration using pyruvate or acetyl carnitine and priopionyl carnitine, in the presence of ATP and stimulated with bicarbonate addition, from isolated mitochondria of fasted and fed NT and TG mice. H: States 2, 3, and 4 respiration rates for glutamate from isolated skeletal muscle mitochondria from fed NT and TG mice. The data are the mean and SEM of four independent experiments. The asterisk (*) indicates a significant difference comparing fasted and fed mice within a genotype (P < 0.01). The cross (†) indicates significant difference when comparing genotypes within a specific nutritional state (P < 0.05). The letter “c” indicates a significant difference when comparing lean and obese animals (P < 0.01). St/ST, state.
Figure 3
Figure 3
Metabolic organic acids in skeletal muscle of fasted and fed NT and TG lean (CD) and obese (HFD) mice. Data are the mean and SEM for five animals per group. Data were analyzed by two-way ANOVA. Pairwise comparisons of 95% CIs established significant differences (P < 0.05) between groups. The letter “a” designates a significant difference due to nutritional state (fasted or fed) for a given strain (NT or TG) or body mass (lean or obese). The letter “b” designates a significant difference due to strain for a given nutritional state or body mass. The letter “c” indicates a significant difference due to body mass for a given nutritional state or strain.
Figure 4
Figure 4
Skeletal muscle BCAAs and 4E-BP1 hyperphosphorylation in fasted (Fa) and fed NT and hGLUT4 TG mice fed a CD (Lean) or an HFD (Obese) for 5 weeks. A: BCAA data are the mean and SEM for five animals per group. B: Representative Western blot immunoblotted (IB) for 4E-BP1 hyperphosphorylation, phospho-BCKDH (pBCKDH) and total BCKDH e1a, and BDK from whole-cell skeletal muscle extracts. C: Quantification of hyperphosphorylated (γ) 4EBP1 and the ratio of phospho-BCKDH to total BCKDH. Data are the mean and SEM of the relative densitometry units for the analysis of three independent muscle extracts for each group. Data were analyzed by two-way ANOVA. Pairwise comparisons of 95% CIs established significant differences (P < 0.05) between groups. The letter “a” designates a significant difference due to nutritional state (fasted or fed) for a given strain (NT or TG) or body mass (Lean or Obese). The letter “b” designates a significant difference due to strain for a given nutritional state or body mass. The letter “c” indicates a significant difference due to body mass for a given nutritional state or strain.
Figure 5
Figure 5
Skeletal muscle (A) glycogen and amino acids (B) Ala, Gly, and Glu/Gln in fasted (Fa) and fed NT and hGLUT4 TG mice fed a CD (Lean) or an HFD (Obese) for 5 weeks. Data are the mean and SEM for five animals per group. Data were analyzed by two-way ANOVA. Pairwise comparisons of 95% CIs established significant differences (P < 0.05) between groups. The letter “a” designates a significant difference due to nutritional state (fasted or fed) for a given strain (NT or TG) or body mass (Lean or Obese). The letter “b” designates a significant different due to strain for a given nutritional state or body mass. The letter “c” indicates a significant difference due to body mass for a given nutritional state or strain. C: Representative Western blots (n-3 independent sets) imunoblotted (IB) for GLUT4 and slc38a2 levels from whole-cell skeletal muscle extracts.
Figure 6
Figure 6
Amino acids in fasted and fed skeletal muscle of NT and hGLUT4 TG mice fed a CD (Lean) or an HFD (Obese) for 5 weeks. Data are the mean and SEM for five animals per group. Data were analyzed by two-way ANOVA. Pairwise comparisons of 95% CIs established significant differences (P < 0.05) between groups. The letter “a” designates a significant difference due to nutritional state (fasted or fed) for a given strain (NT or TG) or body mass (Lean or Obese). The letter “b” designates a significant different due to strain for a given nutritional state or body mass. The letter “c” indicates a significant difference due to body mass for a given nutritional state or strain.
Figure 7
Figure 7
Long-chain acyl carnitines (A) and acetyl carnitine (B) in fasted and fed NT and hGLUT4 TG mice in skeletal muscle of mice fed a CD (Lean) or an HFD (Obese) for 5 weeks. Data are the mean and SEM for five animals per group. Data were analyzed by two-way ANOVA. Pairwise comparisons of 95% CIs established significant differences (P < 0.05) between groups. The letter “a” designates a significant difference due to nutritional state (fasted or fed) for a given strain (NT or TG) or body mass (Lean or Obese). The letter “b” designates a significant difference due to strain for a given nutritional state or body mass. The letter “c” indicates a significant difference due to body mass for a given nutritional state or strain.
Figure 8
Figure 8
Skeletal muscle AMPK activation, malonyl CoA levels, CPT-1 activity, and TAGs in fasted (Fa) and fed NT and hGLUT4 TG mice fed a CD (Lean) or an HFD (Obese) for 5 weeks. A: Representative Western blot analysis and quantification of immunoblots (IB) for phospho-AMPK and total AMPK levels from whole-cell skeletal muscle extracts. Data are the mean and SEM of the relative densitometry units for analysis of three independent muscle extracts for each group. Malonyl CoA levels (B), CPT-1 activity (C), and muscle triacylglyceride levels (D) are all the mean and SEM for four independent measurements. Data for phospho-AMPK and total AMPK and triacylglycerides were analyzed by two-way ANOVA. Pairwise comparisons of 95% CIs established significant differences (P < 0.05) between groups. The letter “a” designates a significant difference due to nutritional state (fasted or fed) for a given strain (NT or TG) or body mass (Lean or Obese). The letter “b” designates a significant difference due to strain for a given nutritional state or body mass. The letter “c” indicates a significant difference due to body mass for a given nutritional state or strain. Data for malonyl CoA and CPT-1 activity were analyzed by two-tailed t test.

Similar articles

Cited by

References

    1. Kahn SEJB, Buse JB. Medications for type 2 diabetes: how will we be treating patients in 50 years? Diabetologia 2015;58:1735–1739 - PMC - PubMed
    1. Nolan CJ, Ruderman NB, Kahn SE, Pedersen O, Prentki M. Insulin resistance as a physiological defense against metabolic stress: implications for the management of subsets of type 2 diabetes. Diabetes 2015;64:673–686 - PMC - PubMed
    1. Brüning JC, Michael MD, Winnay JN, et al. . A muscle-specific insulin receptor knockout exhibits features of the metabolic syndrome of NIDDM without altering glucose tolerance. Mol Cell 1998;2:559–569 - PubMed
    1. Wojtaszewski JFP, Higaki Y, Hirshman MF, et al. . Exercise modulates postreceptor insulin signaling and glucose transport in muscle-specific insulin receptor knockout mice. J Clin Invest 1999;104:1257–1264 - PMC - PubMed
    1. Atkinson BJ, Griesel BA, King CD, Josey MA, Olson AL. Moderate GLUT4 overexpression improves insulin sensitivity and fasting triglyceridemia in high-fat diet-fed transgenic mice. Diabetes 2013;62:2249–2258 - PMC - PubMed

MeSH terms