

The Arabidopsis CERK1-associated kinase PBL27 connects chitin perception to MAPK activation
- PMID: 27679653
- PMCID: PMC5109243
- DOI: 10.15252/embj.201694248
The Arabidopsis CERK1-associated kinase PBL27 connects chitin perception to MAPK activation
Abstract
Perception of microbe-associated molecular patterns by host cell surface pattern recognition receptors (PRRs) triggers the intracellular activation of mitogen-activated protein kinase (MAPK) cascades. However, it is not known how PRRs transmit immune signals to MAPK cascades in plants. Here, we identify a complete phospho-signaling transduction pathway from PRR-mediated pathogen recognition to MAPK activation in plants. We found that the receptor-like cytoplasmic kinase PBL27 connects the chitin receptor complex CERK1-LYK5 and a MAPK cascade. PBL27 interacts with both CERK1 and the MAPK kinase kinase MAPKKK5 at the plasma membrane. Knockout mutants of MAPKKK5 compromise chitin-induced MAPK activation and disease resistance to Alternaria brassicicola PBL27 phosphorylates MAPKKK5 in vitro, which is enhanced by phosphorylation of PBL27 by CERK1. The chitin perception induces disassociation between PBL27 and MAPKKK5 in vivo Furthermore, genetic evidence suggests that phosphorylation of MAPKKK5 by PBL27 is essential for chitin-induced MAPK activation in plants. These data indicate that PBL27 is the MAPKKK kinase that provides the missing link between the cell surface chitin receptor and the intracellular MAPK cascade in plants.
Keywords: PAMP; RLCK; MAPKKK5; plant immunity; signal transduction.
© 2016 The Authors. Published under the terms of the CC BY NC ND 4.0 license.
Figures

The neighbor‐joining phylogenetic tree was created using ClustalW on the DNA Data Bank of Japan (
http://www.ddbj.nig.ac.jp/ ). The full‐length protein sequence for each MAPKKK was used for the alignment. The phylogenetic tree was generated from the modified alignment with Treeview X software.The growth of yeast colonies on plates (‐ULWH) lacking uracil (U), leucine (L), tryptophan (W), and histidine (H) with 5 mM 3‐aminotriazole (3‐AT) indicates a positive interaction. The 3‐AT is a competitive inhibitor of the HIS3 gene product (histidine synthase), which is the reporter gene for the interaction in the yeast two‐hybrid assay. FL: full length, N: N‐terminal domain, KD: kinase domain, C: C‐terminal domain.
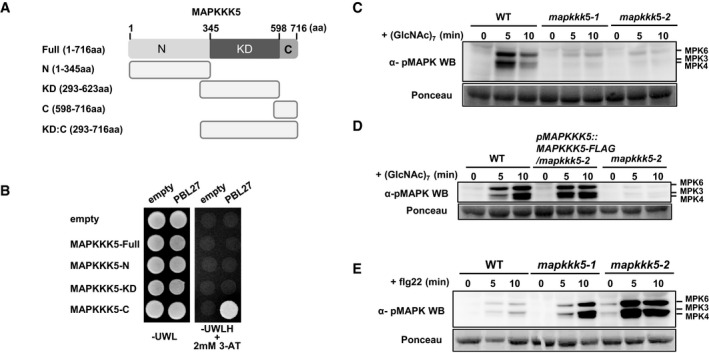
Schematic diagram of MAPKKK5 constructs. N: N‐terminal domain, KD: kinase domain, C: C‐terminal domain.
MAPKKK5‐C interacts with PBL27 in yeast two‐hybrid experiments. The growth of yeast colonies on plates (‐ULWH) lacking uracil (U), leucine (L), tryptophan (W), and histidine (H) with 2 mM 3‐aminotriazole (3‐AT) indicates a positive interaction.
Chitin‐induced MAPK activation was analyzed by immunoblots with α‐pMAPK.
Complementation of chitin‐induced MAPK activation in mapkkk5 mutants by expression of MAPKKK5‐FLAG. MAPK activation was analyzed by immunoblots with α‐pMAPK.
Flg22‐induced MAPK activation was analyzed by immunoblots with α‐pMAPK.
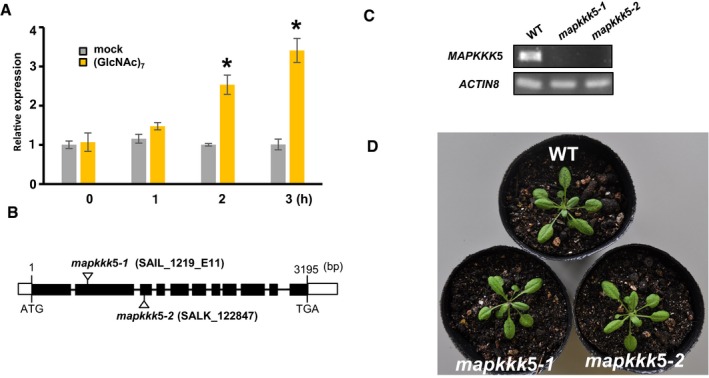
Chitin‐induced expression of MAPKKK5. Expression of MAPKKK5 was analyzed by real‐time RT–PCR using specific primers for MAPKKK5. Bars represent means ± SD calculated from three independent experiments. The asterisks indicate statistically significant differences from the mock treatment by Student's t‐test (P < 0.05).
Gene structure of MAPKKK5 and the T‐DNA insertion sites. Exons are indicated by black boxes. Arrows indicate each T‐DNA insertion site.
Expression of MAPKKK5 in two T‐DNA insertion mutants was analyzed by semiquantitative RT–PCR.
The phenotype of mapkkk5 homozygous mutant plants was similar to that of wild‐type (Col‐0) plants. Arabidopsis plants were grown in soil in a growth chamber at 23°C under 16‐h light–8‐h dark cycle. Plants were photographed 3 weeks after germination.

Chitin‐induced callose deposition in the mapkkk5 mutants. Seedlings were analyzed at 18 h after treatment with 10 μM chitin. Representative pictures from the biological replicates are presented. Data are means ± SD from three independent biological replicates, where each biological replicate consists of two technical replicates. The asterisks indicate statistically significant differences from the WT controls by Student's t‐test (P < 0.05).
Leaf disks were treated with 10 μM (GlcNAc)7 in a solution containing 500 μM L‐012 and 10 μg/ml horseradish peroxidase. ROS production was quantified using a luminescence microplate reader. Data are means ± SD calculated using three biological replicates, where each biological replicate consisted of two technical replicates.
mapkkk5 mutations reduce resistance to Alternaria brassiciicola. Lesion sizes were measured 6 days after inoculation. Values are mean ± SEM, n ≥ 92. Asterisks indicate significant difference from wild‐type controls by Student's t‐test (P < 0.01).
Analysis of chitin‐induced transcriptional reprogramming in mapkkk5‐1. Total RNA was extracted from seedlings treated with mock or 40 μM chitin for 3 h and analyzed by RNA‐seq. Genes that are significantly induced or suppressed by chitin in the wild type were selected (q‐value < 0.05; 12,992 genes). The log2 fold changes in the selected genes compared with mock in the wild type and mapkkk5‐1 were plotted. Yellow and blue dots indicate genes that show reduced induction or suppression (506 genes) or enhanced induction or suppression (151 genes) in mapkkk5‐1 compared with the wild type, respectively. The slope of the linear regression line (red) indicates that the overall transcriptional response is weakened in mapkkk5‐1 compared with the wild type. As a comparison, the line y = x (black) is shown. For more details, see the Materials and Methods.
A heatmap showing MAPKKK5‐dependent genes. Genes showing reduced induction or suppression in mapkkk5‐1 compared with the wild type were selected as described in the Materials and Methods (339 genes). The log2 fold changes in the selected genes compared with mock were subjected to hierarchical clustering analysis. Yellow indicates positive values, blue indicates negative values, and black indicates zero: see the color scale.
Expression patterns of representative MAPKKK5‐dependent genes. qRT–PCR analysis of defense‐related genes in 8‐day‐old seedlings exposed to 40 μM (GlcNAc)7 for 3 h. Data are shown as the average of three independent biological replicates ± SD. The asterisks indicate statistically significant differences from the WT controls by Student's t‐test (P < 0.05).

Agroinfiltration assays using native or 35S promoters in Nb leaves show that MAPKKK5 induces cell death. The results were photographed at 48 or 72 h postinoculation (hpi).
Detection of the MAPKKK5‐GFP proteins in Nb leaves by immunoblots with α‐GFP.
The kinase‐dead MAPKKK5 K375M with or without PBL27 does not induce cell death in Nb leaves. The results were photographed at 72 hpi.
MAPKKK5 induces cell death in the BiFC assay. The results were photographed at 72 hpi.
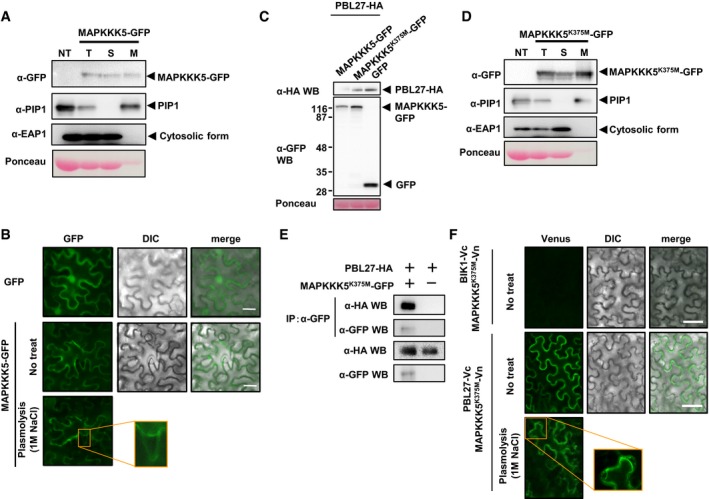
The MAPKKK5‐GFP protein was detected in the membrane fraction. The total (T), soluble (S), and microsomal membrane (M) fractions purified from Nb leaves expressing MAPKKK5‐GFP were used for immunoblots with antibodies against GFP, PM‐localized aquaporin PIP1, and cytosolic ascorbate peroxidase EAP1.
Subcellular localization of MAPKKK5‐GFP and GFP in Nb leaves. The results were photographed at 38 hpi. Scale bars = 50 μm.
Detection of MAPKKK5‐GFP and PBL27‐HA transiently expressed in Nb leaves. Total proteins were purified from Nb leaves at 38 hpi.
Localization of MAPKKK5K375M‐GFP was analyzed by using total (T), soluble (S), and microsomal membrane (M) fractions purified from Nb leaves expressing MAPKKK5K375M‐GFP.
Co‐immunoprecipitation assays show that MAPKKK5K375M‐GFP forms the complex with PBL27‐HA in Nb leaves. The microsomal fractions purified from Nb leaves co‐expressing MAPKKK5K375M‐GFP and PBL27‐HA at 48 hpi were used for co‐immunoprecipitation with α‐GFP.
Visualization of the interaction between PBL27 and MAPKKK5K375M by bimolecular fluorescence complementation (BiFC) analysis in Nb leaves. The results were photographed at 38 hpi. Venus fluorescence indicates the interaction between PBL27 and MAPKKK5K375M. Scale bars = 50 μm.

Detection of MAPKKK5‐GFP and MAPKKK5K375M‐GFP transiently expressed in Arabidopsis protoplasts.
Expression of MAPKKK5‐GFP reduces the level of PBL27. CBB, Coomassie brilliant blue.
Arabidopsis protoplasts expressing PBL27‐HA and MAPKKK5‐GFP were treated with 30 μM MG132 for 3 h and subjected to immunoblots with α‐HA and α‐GFP.
The co‐immunoprecipitation assay shows that PBL27 forms the complex with MAPKKK5 in Arabidopsis protoplasts. Total proteins purified from protoplasts co‐expressing PBL27 and MAPKKK5 were subjected to immunoprecipitation with α‐HA.
Visualization of the interaction between PBL27 and MAPKKK5K375M by BiFC analysis in Arabidopsis protoplasts. FLS‐associated RLCK BIK1 was also used for this assay. Venus fluorescence indicates interaction between PBL27 and MAPKKK5K375M. Scale bars = 10 μm.
The disassociation of PBL27‐MAPKKK5 interaction after chitin treatment in Arabidopsis protoplasts. Protoplasts were co‐transfected with MAPKKK5K375M‐GFP and PBL27‐HA, stimulated with or without 10 μM chitin or 1 μM flg22 for 10 min and subjected to the co‐immunoprecipitation assay.

PBL27 phosphorylates MAPKKK5‐C in vitro. The in vitro phosphorylation reaction was carried out using [32P]γ‐ATP, and the phosphorylated proteins were detected by autoradiography. CBB, Coomassie brilliant blue.
BIK1 does not phosphorylate MAPKKK5‐C in vitro. RBOHD was used as a positive control. Asterisk indicates artificial bands.
Identification of amino acid residues of MAPKKK5 phosphorylated by PBL27. The C‐terminal domain of MAPKKK5 was phosphorylated by PBL27 in vitro and subjected to LS‐MS/MS analysis. All MS/MS spectra of phosphorylated peptides were validated manually. The amino acid residues phosphorylated by PBL27 are shown in red.
The S622A mutation strongly reduces phosphorylation by PBL27. Each phosphorylation site was substituted by alanine and subjected to the in vitro phosphorylation assays.
PBL27 does not phosphorylate MAPKKK5‐C6xA in vitro. The in vitro phosphorylation reaction was carried out using [32P]γ‐ATP, and the phosphorylated proteins were detected by autoradiography.
PBL27 interacts with MAPKKK5‐C6xA in yeast two‐hybrid experiments. The growth of yeast colonies on plates (‐ULWH) lacking uracil (U), leucine (L), tryptophan (W), and histidine (H) with 10 mM 3‐AT indicated a positive interaction.

Chitin‐induced MAPK activation in a mapkkk5 mutant (Line 1) expressing MAPKKK5 6xA. MAPK activity was detected using immunoblots with α‐pMAPK.
Chitin‐induced callose deposition in the MAPKKK5 6xA plant (Line 1). Seedlings were analyzed at 18 h after treatment with 10 μM chitin. Data are means ± SD from three independent biological replicates, where each biological replicate consists of two technical replicates. The asterisks indicate statistically significant differences from the WT controls by Student's t‐test (P < 0.05).
Detection of MAPKKK5K375M‐GFP and MAPKKK5K375M, 6xA‐GFP transiently expressed in Arabidopsis protoplasts.
Visualization of interaction between PBL27 and MAPKKK5K375M, 6xA by BiFC analysis in Arabidopsis protoplasts. Venus fluorescence indicates interaction between PBL27 and MAPKKK5K375M, 6xA. Scale bars = 10 μm.

MAPKKK5 K375M and MAPKKK5 K375M, 6xA were transiently expressed in Nb leaves. Total proteins were prepared from the leaves at 48 hpi. The protein levels were analyzed by immunoblots with α‐GFP.
Subcellular localization of MAPKKK5K375M and MAPKKK5K375M, 6xA in Nb leaves. Microscopic observation was done at 48 hpi. Scale bars = 50 μm.
Visualization of the interaction between PBL27 and MAPKKK5K375M,6xA using bimolecular fluorescence complementation in Nb leaves. Venus fluorescence indicates the interaction between PBL27 and MAPKKK5K375M,6xA. Scale bars = 50 μm.
The MAPKKK5K375M, 6xA‐GFP protein was detected in the membrane fraction. MAPKKK5K375M, 6xA‐GFP was expressed in Nb leaves. Total proteins were prepared from Nb leaves at 40 hpi. Immunoblots with α‐GFP and α‐EAP1 were carried out using total (T), soluble (S), and microsomal membrane (M) fractions. α‐EAP1, the antibody against Euglena ascorbate peroxidase, cross‐reacts with cytosolic and thylakoid membrane‐bound AsAPs of N. bensamiana. Asterisks indicate artificial bands.

PBL27 does not interact with MAPKKK5‐KD:C in a yeast two‐hybrid assay.
Addition of CERK1 to an in vitro kinase assay enhances phosphorylation of MAPKKK5‐KDK375M:C by PBL27. Asterisks indicate artificial bands derived from CERK1:IC.
CERK1 does not phosphorylate the C‐terminal domain of MAPKKK5 in vitro. The in vitro kinase assay was performed with recombinant proteins of GST‐PBL27, MAPKKK5‐C and the intracellular kinase domain of CERK1 (GST‐CERK1:IC). The protein loading control was shown by staining with Coomassie brilliant blue. The in vitro phosphorylation reaction was carried out using [32P]γ‐ATP, and the phosphorylated proteins were detected by autoradiography. Asterisks indicate artificial bands.
The alanine substitution mutations at the residues conserved in the activation loop of reduces the phosphorylation of PBL27 by CERK1:IC. The in vitro kinase assay was carried out with recombinant proteins of GST‐PBL27K112E, GST‐PBL27K112E, 3xA, and CERK1‐IC.
The kinase activity of GST‐PBL273xA was analyzed by the in vitro kinase assay using [32P]γ‐ATP.

Visualization of interaction between MAPKKK5K375M and MKK1/MKK2/MKK4/MKK5 by BiFC analysis in Arabidopsis protoplasts. Venus fluorescence indicates interaction. Scale bars = 10 μm.
MAPKKK5‐KD phosphorylates MKK4 and MKK5 in vitro. The in vitro phosphorylation reaction was carried out using [32P]γ‐ATP, and the phosphorylated proteins were detected by autoradiography.
MAPKKK5‐KD does not phosphorylate a T224A/S230A mutant of MKK4 or a T215A/S221A mutant of MKK5.
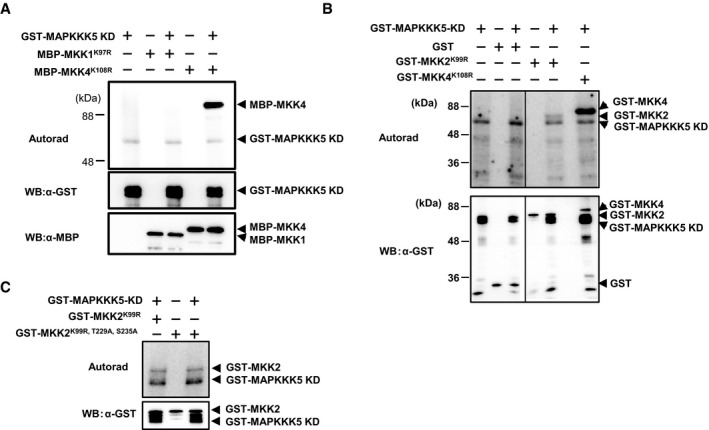
MAPKKK5‐KD does not phosphorylate MKK1K97R in vitro. The in vitro phosphorylation reaction was carried out using MBP‐fused MKK1 and MKK4, and the phosphorylated proteins were detected by autoradiography. MKK4K108R was used as a positive control.
MAPKKK5‐KD weakly phosphorylates GST‐MKK2K99R in in vitro phosphorylation assay
The T229A and S235A mutations of MKK2 did not reduce phosphorylation of MKK2K99R.
Similar articles
-
Selective regulation of the chitin-induced defense response by the Arabidopsis receptor-like cytoplasmic kinase PBL27.Plant J. 2014 Jul;79(1):56-66. doi: 10.1111/tpj.12535. Epub 2014 May 23. Plant J. 2014. PMID: 24750441
-
The OXIDATIVE SIGNAL-INDUCIBLE1 kinase regulates plant immunity by linking microbial pattern-induced reactive oxygen species burst to MAP kinase activation.Plant Cell. 2024 Dec 23;37(1):koae311. doi: 10.1093/plcell/koae311. Plant Cell. 2024. PMID: 39566103
-
Arabidopsis ubiquitin ligase PUB12 interacts with and negatively regulates Chitin Elicitor Receptor Kinase 1 (CERK1).PLoS One. 2017 Nov 28;12(11):e0188886. doi: 10.1371/journal.pone.0188886. eCollection 2017. PLoS One. 2017. PMID: 29182677 Free PMC article.
-
Chitin receptor-mediated activation of MAP kinases and ROS production in rice and Arabidopsis.Plant Signal Behav. 2017 Sep 2;12(9):e1361076. doi: 10.1080/15592324.2017.1361076. Epub 2017 Aug 14. Plant Signal Behav. 2017. PMID: 28805500 Free PMC article. Review.
-
Defense Against Pathogens: Structural Insights into the Mechanism of Chitin Induced Activation of Innate Immunity.Curr Med Chem. 2017 Nov 24;24(36):3980-3986. doi: 10.2174/0929867323666161221124345. Curr Med Chem. 2017. PMID: 28003004 Review.
Cited by
-
Plasma Membrane-Associated Proteins Identified in Arabidopsis Wild Type, lbr2-2 and bak1-4 Mutants Treated with LPSs from Pseudomonas syringae and Xanthomonas campestris.Membranes (Basel). 2022 Jun 10;12(6):606. doi: 10.3390/membranes12060606. Membranes (Basel). 2022. PMID: 35736313 Free PMC article.
-
Pattern recognition receptors and their interactions with bacterial type III effectors in plants.Genes Genomics. 2019 May;41(5):499-506. doi: 10.1007/s13258-019-00801-1. Epub 2019 Mar 4. Genes Genomics. 2019. PMID: 30830683 Review.
-
Paradigms of receptor kinase signaling in plants.Biochem J. 2023 Jun 28;480(12):835-854. doi: 10.1042/BCJ20220372. Biochem J. 2023. PMID: 37326386 Free PMC article. Review.
-
Verticillium dahliae effector VDAL protects MYB6 from degradation by interacting with PUB25 and PUB26 E3 ligases to enhance Verticillium wilt resistance.Plant Cell. 2021 Dec 3;33(12):3675-3699. doi: 10.1093/plcell/koab221. Plant Cell. 2021. PMID: 34469582 Free PMC article.
-
Tandem Protein Kinases Emerge as New Regulators of Plant Immunity.Mol Plant Microbe Interact. 2021 Oct;34(10):1094-1102. doi: 10.1094/MPMI-03-21-0073-CR. Epub 2021 Oct 26. Mol Plant Microbe Interact. 2021. PMID: 34096764 Free PMC article. Review.
References
-
- Ao Y, Li Z, Feng D, Xiong F, Liu J, Li JF, Wang M, Wang J, Liu B, Wang HB (2014) OsCERK1 and OsRLCK176 play important roles in peptidoglycan and chitin signaling in rice innate immunity. Plant J 80: 1072–1084 - PubMed
-
- Asai T, Tena G, Plotnikova J, Willmann MR, Chiu WL, Gomez‐Gomez L, Boller T, Ausubel FM, Sheen J (2002) MAP kinase signalling cascade in Arabidopsis innate immunity. Nature 415: 977–983 - PubMed
-
- Bayer M, Nawy T, Giglione C, Galli M, Meinnel T, Lukowitz W (2009) Paternal control of embryonic patterning in Arabidopsis thaliana . Science 323: 1485–1488 - PubMed
MeSH terms
Substances
LinkOut - more resources
Full Text Sources
Other Literature Sources
Molecular Biology Databases
Miscellaneous
