

Geodetic measurements reveal similarities between post-Last Glacial Maximum and present-day mass loss from the Greenland ice sheet
- PMID: 27679819
- PMCID: PMC5031466
- DOI: 10.1126/sciadv.1600931
Geodetic measurements reveal similarities between post-Last Glacial Maximum and present-day mass loss from the Greenland ice sheet
Abstract
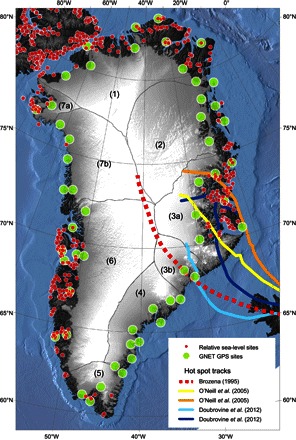
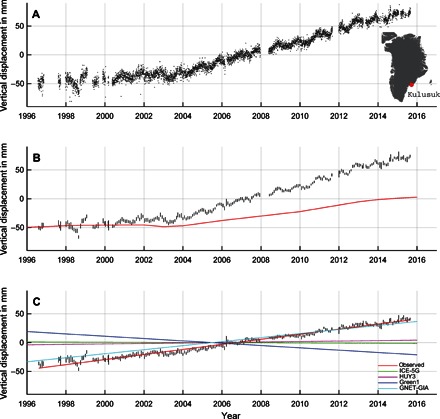
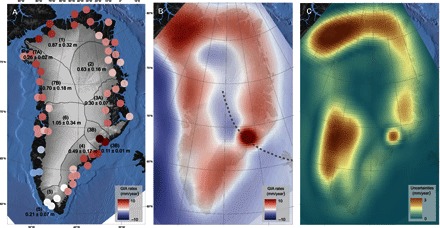
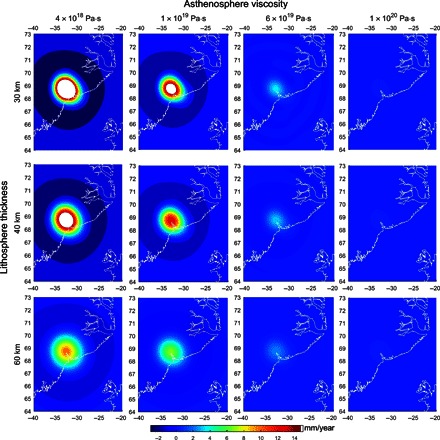
Accurate quantification of the millennial-scale mass balance of the Greenland ice sheet (GrIS) and its contribution to global sea-level rise remain challenging because of sparse in situ observations in key regions. Glacial isostatic adjustment (GIA) is the ongoing response of the solid Earth to ice and ocean load changes occurring since the Last Glacial Maximum (LGM; ~21 thousand years ago) and may be used to constrain the GrIS deglaciation history. We use data from the Greenland Global Positioning System network to directly measure GIA and estimate basin-wide mass changes since the LGM. Unpredicted, large GIA uplift rates of +12 mm/year are found in southeast Greenland. These rates are due to low upper mantle viscosity in the region, from when Greenland passed over the Iceland hot spot about 40 million years ago. This region of concentrated soft rheology has a profound influence on reconstructing the deglaciation history of Greenland. We reevaluate the evolution of the GrIS since LGM and obtain a loss of 1.5-m sea-level equivalent from the northwest and southeast. These same sectors are dominating modern mass loss. We suggest that the present destabilization of these marine-based sectors may increase sea level for centuries to come. Our new deglaciation history and GIA uplift estimates suggest that studies that use the Gravity Recovery and Climate Experiment satellite mission to infer present-day changes in the GrIS may have erroneously corrected for GIA and underestimated the mass loss by about 20 gigatons/year.
Keywords: GPS; Greenland Ice Sheet; Last Glacial Maximum; Sea level rise; climate change; glacial isostatic adjustment.
Figures
References
-
- Simpson M. J. R., Wake L., Milne G. A., Huybrechts P., The influence of decadal- to millennial-scale ice mass changes on present-day vertical land motion in Greenland: Implications for the interpretation of GPS observations. J. Geophys. Res. 116, B02406 (2011).
-
- Fleming K., Lambeck K., Constraints on the Greenland ice sheet since the Last Glacial Maximum from sea-level observations and glacial-rebound models. Quat. Sci. Rev. 23, 1053–1077 (2004).
-
- Tarasov L. Peltier W. R., Greenland glacial history, borehole constraints, and Eemian extent. J. Geophys. Res. 108, 2143 (2003).
-
- Peltier W. R., Postglacial variations in the level of the sea: Implications for climate dynamics and solid-Earth geophysics. Rev. Geophys. 36, 603–689 (1998).
-
- Ivins E. R., James T. S., Wahr J., Schrama E. J. O., Landerer F. W., Simon K. M., Antarctic contribution to sea level rise observed by GRACE with improved GIA correction. J. Geophys. Res. Solid Earth 118, 3126–3141 (2013).
LinkOut - more resources
Full Text Sources
Other Literature Sources
