. 2016 Nov 3;539(7627):43-47.
doi: 10.1038/nature19825. Epub 2016 Sep 28.

De novo phasing with X-ray laser reveals mosquito larvicide BinAB structure

Affiliations

De novo phasing with X-ray laser reveals mosquito larvicide BinAB structure

Jacques-Philippe Colletier et al. Nature. .

Abstract

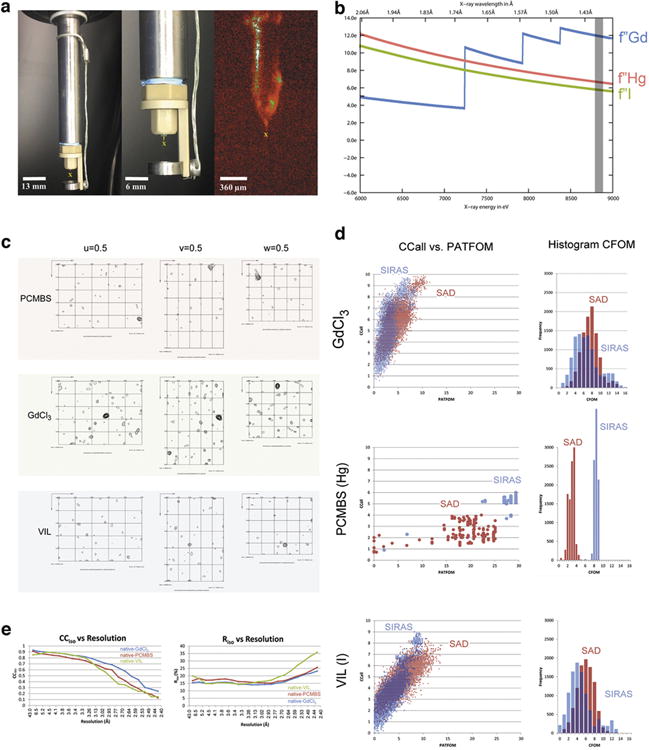
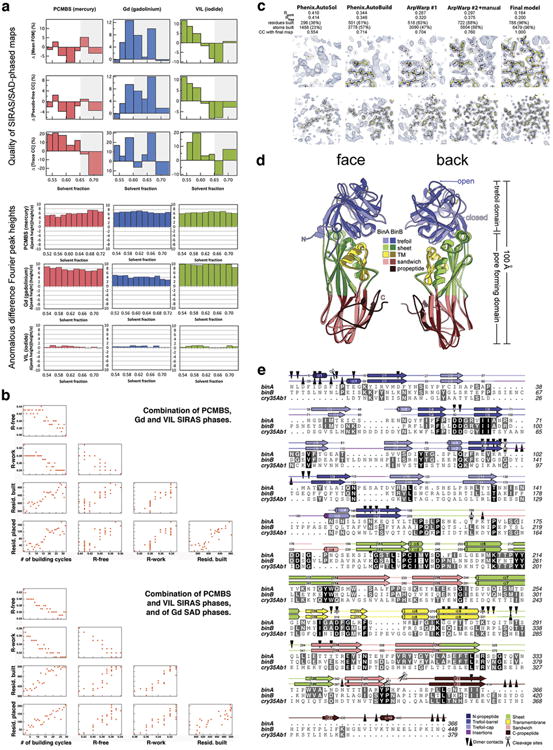
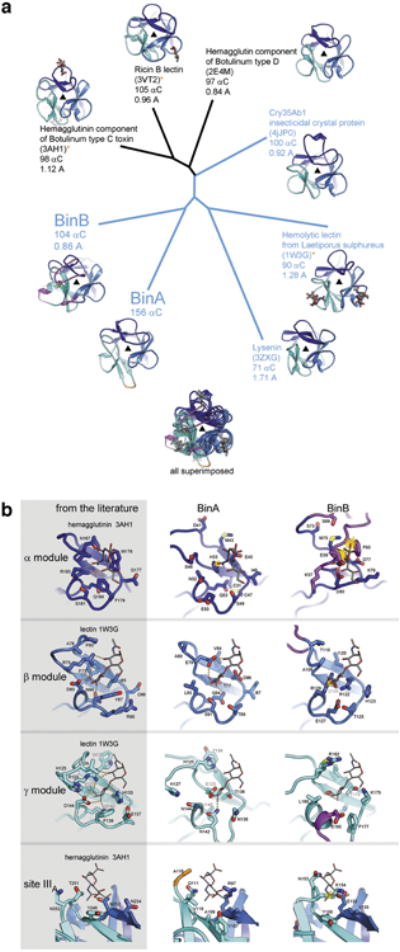
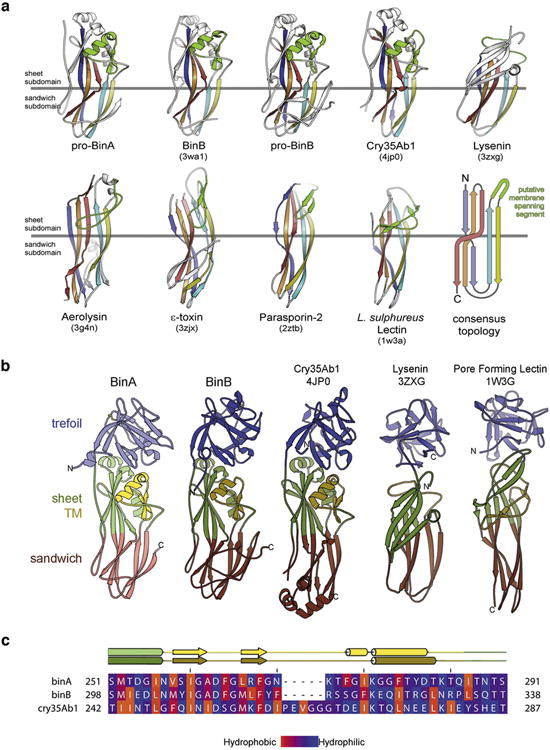
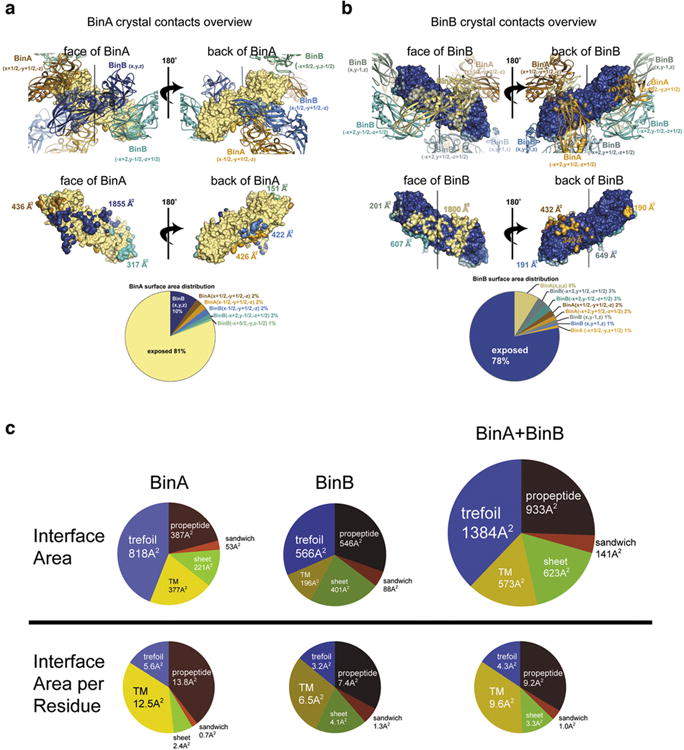
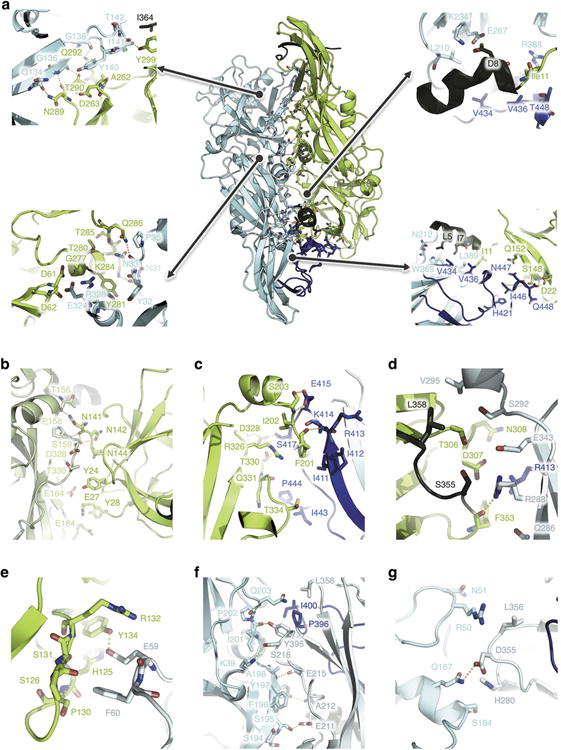
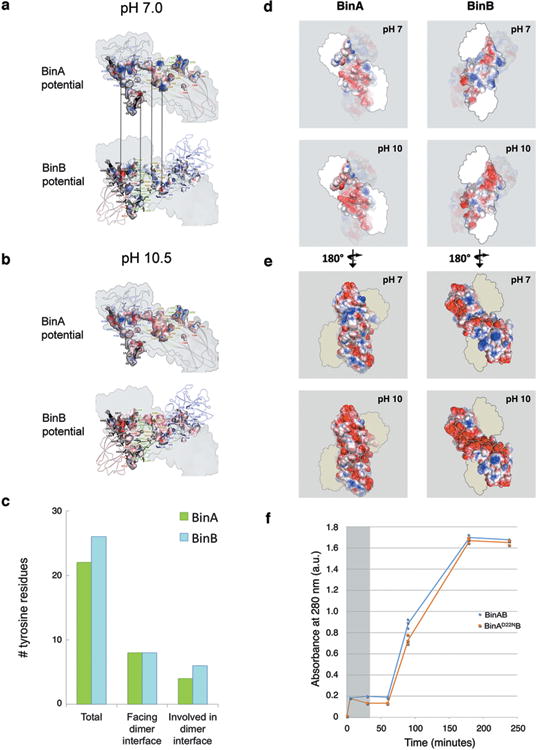
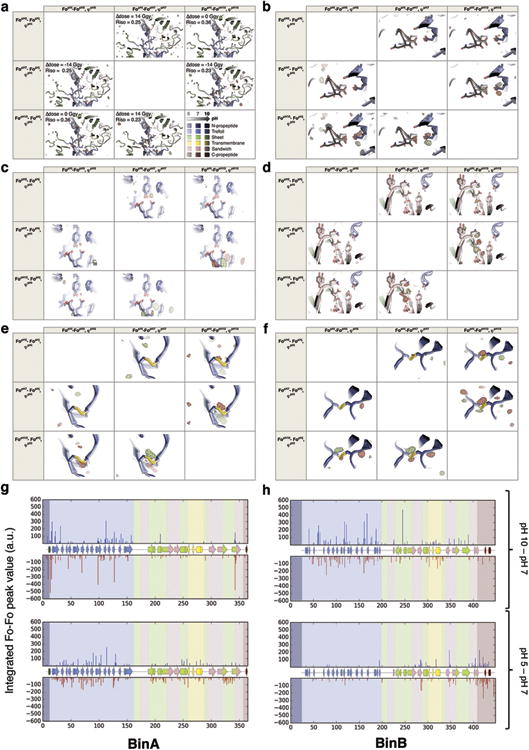
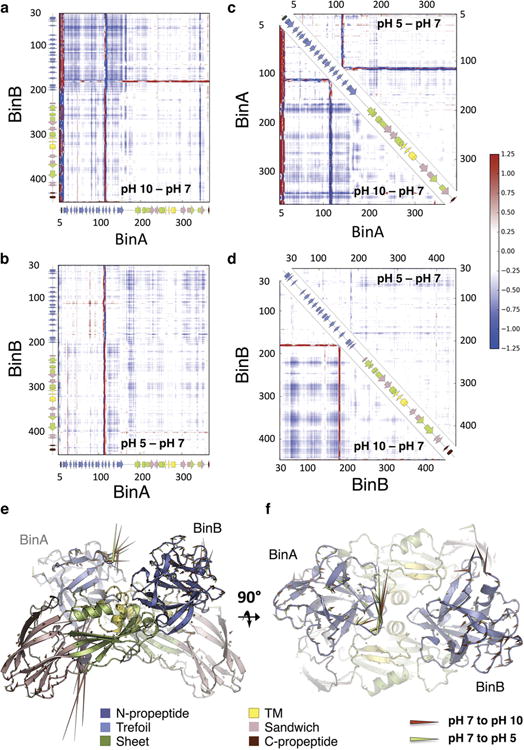
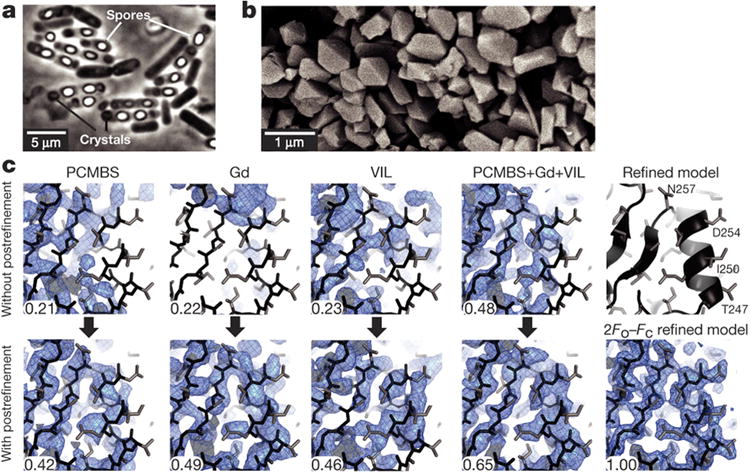
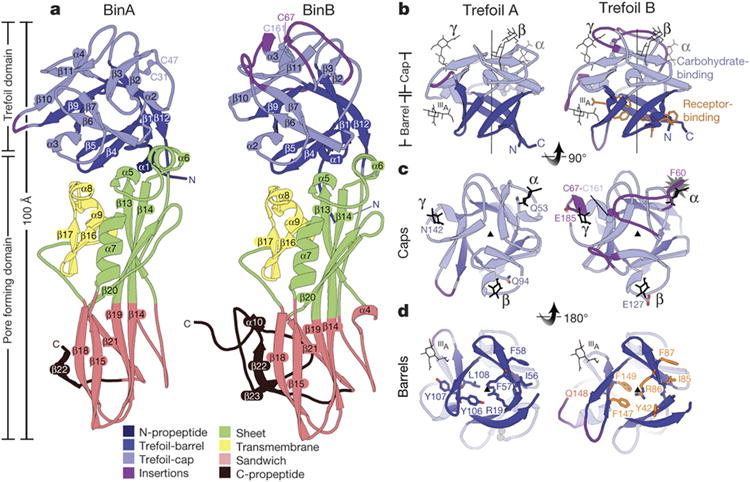
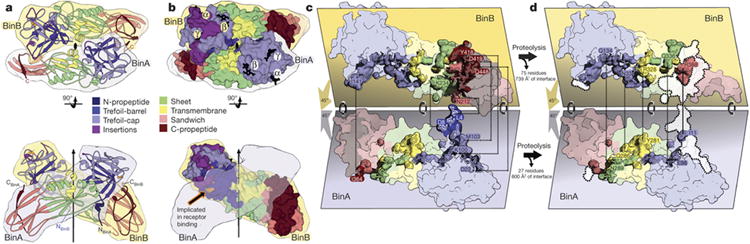
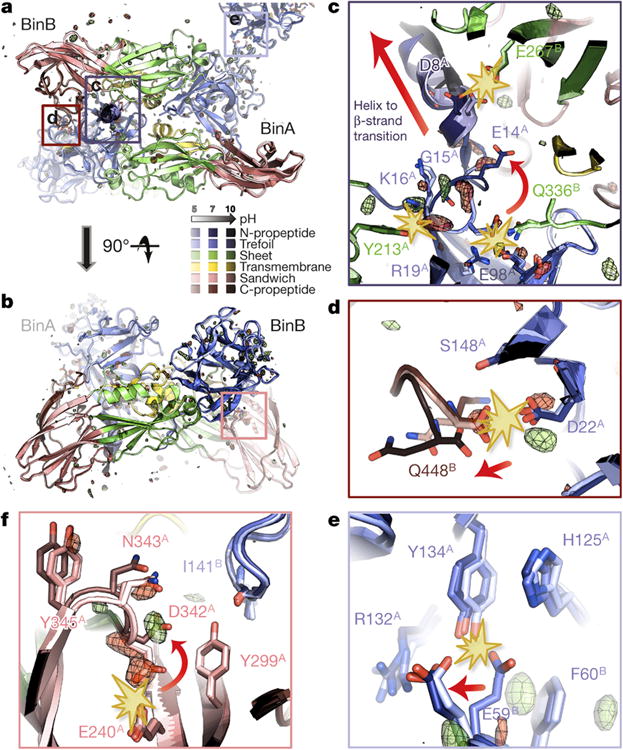
BinAB is a naturally occurring paracrystalline larvicide distributed worldwide to combat the devastating diseases borne by mosquitoes. These crystals are composed of homologous molecules, BinA and BinB, which play distinct roles in the multi-step intoxication process, transforming from harmless, robust crystals, to soluble protoxin heterodimers, to internalized mature toxin, and finally to toxic oligomeric pores. The small size of the crystals-50 unit cells per edge, on average-has impeded structural characterization by conventional means. Here we report the structure of Lysinibacillus sphaericus BinAB solved de novo by serial-femtosecond crystallography at an X-ray free-electron laser. The structure reveals tyrosine- and carboxylate-mediated contacts acting as pH switches to release soluble protoxin in the alkaline larval midgut. An enormous heterodimeric interface appears to be responsible for anchoring BinA to receptor-bound BinB for co-internalization. Remarkably, this interface is largely composed of propeptides, suggesting that proteolytic maturation would trigger dissociation of the heterodimer and progression to pore formation.


Figures

Extended Data Figure 1
Extended Data Figure 1. Data collection and heavy atom substructure determination
a, The “MESH-on-a-stick” sample injector configuration (see Methods). In the three panels, the yellow “X” below the capillary indicates the X-ray path into the page. The middle panel shows a closer view of the injector tip; the right panel shows an on-axis view of the sample injecting during the experiment. b, Our choice of X-ray wavelength for diffraction and MIRAS phasing was a compromise between maximizing the heavy atom anomalous signals, f″, as indicated by the curves for each element, and maximizing the number of data sets collected in the time allotted for the experiment. The grey bar corresponds to the wavelength we used, 1.41 Å. c, Difference Patterson maps calculated at 2.8 Å resolution. Sharpening (-5.0Å2) was applied to Hg and VIL maps. Coefficients for the PCMBS and VIL maps were obtained from both isomorphous and anomalous differences. The Gd difference Patterson map was calculated from anomalous differences only. Contours start at the 1.5 σ level and continue at 0.5 σ intervals. Peaks corresponding to vectors between heavy atoms stand out as high peaks, up to 7.5 σ. d, Heavy atom sites were located successfully for each of the three derivatives using the program, ShelxD. We compared the quality of potential heavy atom substructure solutions obtained from two sources of heavy atom signal: single wavelength anomalous dispersion (SAD) and a combination of anomalous dispersion and isomorphous differences (SIRAS). Ten thousand independent trials were performed for each derivative and signal source. Each dot in the scatter plots indicates the quality of an individual substructure solution. The vertical axis, labeled CCall, indicates the consistency between the potential solution and the diffraction data as the correlation coefficient between normalized structure factors, Ecalc and Eobs. The horizontal axis, labeled PATFOM (Patterson figure of merit), indicates the consistency between observed difference Patterson map and that predicted by the potential solution. Successful substructure determination is suggested by the appearance of a sharp separation between two populations of potential solutions: a cluster with lower values of CCall and PATFOM (incorrect solutions) and a cluster with higher values (correct solutions). Such is the case for all the trials performed, except for VIL using the SAD signal, where only a single population of solutions is observed. Evidently, the SAD signal was insufficient for accurate location of iodine sites. For VIL, we relied on the accuracy of sites obtained from the SIRAS signal. In most cases, the SIRAS (blue) signal is stronger than the SAD signal (red), indicating good isomorphism between native and derivative data sets. Only in the case of GdCl3, does the SAD signal appear better than the SIRAS signal. The histograms in the right column indicate the number of potential substructure solutions with given values of CFOM (combined figure of merit). The histograms recapitulate the trends observed in the scatter plots. e, The correlation coefficient (CCiso) measures the agreement and Riso measures discrepancy between the native structure factors and those of each of the derivatives. Each of our three derivative data sets shows isomorphism with the native data set up to 2.8 Å resolution.
Extended Data Figure 2
Extended Data Figure 2. Structure solution and model building
a, Evidence for choosing the correct hand of heavy atom substructures. We illustrate here two types of comparisons we used for choosing the correct hand of the heavy atom substructures: (1) comparisons of the quality of the SIRAS/SAD phased maps (upper three panels) and (2) comparisons of the heights of anomalous difference Fourier peaks (lower three panels). These comparisons are made between maps calculated in opposite hands; the correct hand is indicated by the individual with higher values. The disparity in values (Δ) is indicated on the vertical axes of the graphs. Greater |Δ| values indicate a stronger phasing power and more reliable choice of hand. There are six comparisons shown for each of the three heavy derivatives: PCMBS (mercury) in red, GdCl3 (gadolinium) in blue, and VIL (iodide) in green. The top three panels illustrate the percent difference between hands in the mean figure of merit (Mean-FOM), the pseudo-free correlation coefficient (Pseudo-free CC) of the density modified map, and the correlation coefficient of the trace (Trace-CC) as reported by ShelxE. The sites and phases were obtained from SIRAS signal for mercury and iodide, and from SAD signal for Gd. The most probable solvent content is ∼59 %, corresponding to one BinAB complex per asymmetric unit. However, we note conflicting choices of hand indicated by fluctuations in the sign of Δ accompanying small variations in the solvent content used in the density modification step (horizontal axes). We found that the difference Fourier maps (lower three panels) offered a stronger and more consistent indication of the choice of hand even when the statistics from SIRAS/SAD phased maps themselves differed little between hands. In these panels, SIRAS phases from the each heavy atom were used to compute three anomalous difference Fourier maps, using as coefficients, the anomalous differences from each derivative (rows 4, 5, 6). The graphs show that for all three derivatives, the original hand choice was correct (indicated by positive Δ), consistent across choices of solvent content (all Δ have the same sign within a graph), and consistent across sources of anomalous differences (all Δ have the same sign within a column). b, Automated tracing and model-building. Phases from the three derivatives were combined using SOLVE (see Methods). The hands which we decided on during the phasing step (a) were specified as ‘known’ to phenix.autosol. We then used RESOLVE (see Methods) to trace the density and build a model. Upper and lower panels show the progress of model building, depending on whether anomalous and isomorphous differences were combined from all derivatives (upper panel) or mixed phases (i.e. anomalous and isomorphous differences from PCMBS and VIL, and anomalous differences from the Gd derivative) (lower panel). Each panel shows scatter plots of R-free, R-factor, number of residues built and number of residues placed in sequence as a function of the number of cycle. The use of mixed phases allowed obtaining a better model, faster (lower panel). c, Electron density maps at various stages of model building. From left to right, the panels illustrate progressive improvement in map and model at two representative regions of BinAB (upper vs. lower panels). The number of residues built (including residues without side chains) is noted at each stage, as well as the number of protein atoms built. The quality of the maps at each stage is reported as a correlation coefficient with the map obtained from the final model. Approximately 60% of the total atoms in BinAB were built automatically. d, Comparison of BinA and BinB structures. Superposition of BinA (lighter colours) and BinB (darker colours) shows similarity between molecules, which superimpose with an RMSD of 1.7 Å over 329 pairs of α-carbons. The “face” view displays the surface involved in the BinA-BinB dimer interface, and the barrel subdomain of the trefoil is oriented toward the viewer. The back view displays the outward faces of the molecules, with the putative carbohydrate binding modules, in the cap subdomain, oriented toward the viewer. One of the largest structural differences is located in a surface loop on the back face, in the trefoil domain (blue). In BinB, a disulphide bond (Cys67-Cys161, yellow sticks) pins a surface loop (residues 60-74) away from the opening in the trefoil domain (open), whereas in BinA, the analogous loop (residues 34-46) is stabilized by a different disulphide bond (Cys31-Cys47, yellow sticks) to take a conformation that covers the opening in the trefoil domain (closed). e, Structure-based sequence alignment of BinA, BinB, and cry35Ab1. The secondary structure of BinA and BinB are shown above the sequences. Heterodimer contacts and cleavage sites are noted.
Extended Data Figure 3
Extended Data Figure 3. Trefoil domains of BinA and BinB
a, Structural relationships among trefoil domains illustrated by a phylogenetic tree plot. Four of the structures used for comparison were identified from a structural similarity search through the Protein Data Bank conducted by the Dali server (using BinA residues 6-156 as the probe). The top 4 hits occupy the top half of the plot (3AH1, 3VT2, 2E4M, and 4JP0). The remaining structures chosen for comparison (1W3G and 3ZXG) were selected based on their membership in the aerolysin family of toxins, of which BinA and BinB are members. That is, these are trefoils covalently linked to aerolysin type pore-forming domains. These are highlighted in blue text and include another insecticidal protein from B. thuringiensis, Cry35Ab1 (4JP0). Note that BinA and BinB are nearly as distant from each other as they are from the closest homologs, hemagglutinin, ricin, and Cry35Ab1. Carbohydrate molecules are shown in sticks where coordinates are available. Notable loop insertions in BinA and BinB are coloured in orange and magenta, respectively. b, Carbohydrate binding modules of BinA and BinB display different levels of structural integrity. No carbohydrates were included or observed in the crystals structure of BinAB. To investigate the structural integrity of the putative carbohydrate binding pockets of BinAB we superimposed coordinates of lectin (1W3G) and hemagglutinin (3AH1). These crystal structures illustrated in the left column are carbohydrate complexes chosen for their structural similarity to BinAB. Some modules appear competent for carbohydrate binding, such as the β and γ modules of BinA and the β module of BinB. Others show steric clash (yellow starburst) such as the α module of BinA and β module of BinB, which could be overcome by allowing adjustments in torsion angles. Notably, the α module of BinB is completely occluded by the insertion in its sequence (magenta) and stapled shut by a disulphide bond. In addition to the canonical α, β, and γ binding modules, 3AH1 displays another weakly bound carbohydrate marked site IIIA (bottom panel). This site is illustrated here because its superimposed coordinates lie adjacent to Y150 in BinB. The Y150A mutation causes complete loss of receptor binding .
Extended Data Figure 4
Extended Data Figure 4. Pore-forming domains (PFD) of BinA and BinB
a, Topology of the aerolysin family of pore forming toxins. These share a core topology composed of five antiparallel β-strands and a putative membrane-spanning segment (green). PDB ID codes are included in parentheses. For clarity, we exclude from this illustration any accessory domains outside the pore forming module (PFM) of these toxins. The PFM is divided into two subdomains: a β-sheet subdomain at one end (above the horizontal grey line) and a β-sandwich subdomain at the opposite end (below the horizontal grey line). The length, twist, and number of strands vary between toxins. Also, the putative membrane-spanning segment (green) varies widely in secondary structure. However, in all cases this putative membrane-spanning segment is located between the second and third strands, suggesting these toxins might share a common mechanism of pore formation. b, Members of the aerolysin family that also contain a β-trefoil domain like BinAB. These are: Cry35Ab1 toxin from B. thuringiensis (4jp0) , lysenin, a haemolytic toxin from the earthworm Eisenia fetida (3zxg) , and a pore-forming lectin from the mushroom Laetiporus suphureus (1w3g) . c, Amphipathicity is evident in the sequence of the putative transmembrane spanning subdomain (TM) of BinA and BinB. The observed secondary structures of BinA and BinB are shown above the sequence alignment. The range of the TM subdomain is coloured yellow. Amino acids are coloured by hydrophobicity according to the scale given at the bottom. Note the alternating hydrophobic-hydrophilic pattern is especially prominent in the N-terminal half of the TM subdomain. This pattern is consistent with the proposal of an oligomeric membrane-spanning β-barrel. The figure was made using the program Jalview .
Extended Data Figure 5
Extended Data Figure 5. Overview and analysis of molecular interfaces in the BinAB crystal
a, Overview of the six molecular interfaces involving BinA in the BinAB crystal. The reference copy of the BinA molecule is depicted as a beige coloured molecular surface and its six neighbouring molecules are shown as cartoon ribbons (upper panels). “Face” and “back” views (left and right panels), reveal opposite surfaces of the BinA molecule. The largest interface is with BinB (x,y,z) which is shown most clearly in the “face” view (left panels) in dark blue colour. It is the only interface of the six which is large enough to stretch over most of the length of the molecule. In all views, the pseudo two-fold axis relating BinA and BinB is in a vertical orientation (black line in upper panels). The areas of contact are illustrated on the BinA molecular surface (middle panels) in colours corresponding to the cartoon ribbons (upper panels). BinA molecules and surfaces are shown in amber colours; BinB molecules and surfaces are shown in blue-green colours. The pie chart shows the relative amounts of total BinA surface area buried by each of the six crystal contacts and the remainder that is solvent exposed. b, Overview of the eight molecular interfaces involving BinB in the BinAB crystal. The reference copy of the BinB molecule is depicted as a dark blue coloured molecular surface and its eight neighbouring molecules are shown as cartoon ribbons (upper panels). “Face” and “back” views (left and right panels), reveal opposite surfaces of the BinB molecule. The largest interface is with BinA (x,y,z) which is shown most clearly in the “face” view (left panels) in beige colour. It is the only interface of the eight which is large enough to stretch over most of the length of the molecule. In all views, the pseudo two-fold axis relating BinA and BinB is in a vertical orientation (black line in upper panels). The areas of contact are illustrated on the BinA molecular surface (middle panels) in colours corresponding to the cartoon ribbons (upper panels). BinA molecules and surfaces are shown in amber colours; BinB molecules and surfaces are shown in blue-green colours. The pie chart shows the relative amounts of total BinB surface area buried by each of the eight crystal contacts and the remainder that is solvent exposed. c, Distribution of BinA-BinB interface area over its subdomains. The pie charts in the upper half shows the area contributions to the principal BinA-BinB interface from each of the five named regions: trefoil domain, TM subdomain, sheet subdomain, sandwich subdomain, and combined N and C-terminal propeptides. The lower charts show analogous contributions on a per residue basis. That is, the area contributed by each region is divided by the total number of residues comprising that region. These pie charts emphasize the role of the TM domain in the dimer interface, perhaps to restrain this domain from inserting into a membrane until after the BinAB dimer dissociates. Interestingly, the higher efficiency of pore formation of BinA compared to BinB correlates with the greater protection of its TM domain (12.5 Å2 buried per residue versus 6.5 Å2 buried per residue) in the dimer.
Extended Data Figure 6
Extended Data Figure 6. Detailed views of the molecular interfaces in the BinAB crystal
a-g, BinA and BinB are shown as green and cyan ribbon diagrams, respectively. The C-terminal pro-peptide of BinB (residues 396-448) is highlighted in blue, while the N- terminal (residues 1-10) and C-terminal (residues 354-367) propeptides of BinA are shown in dark green. Contacting residues are shown as sticks. Polar interactions within a 3.6 Å cut-off are highlighted by yellow dashes. The contacts illustrated in panels a, b, c, d, e, f and g are detailed in Supplementary Tables 3-9, respectively. (a); Molecular contacts between BinA (x,y,z) (green) and BinB (x,y,z) (cyan), i.e. within the biological dimer. A large part of this interface involves the C-terminal pro-peptide of BinB. (b); Molecular contacts between BinA (x,y,z) (green) and BinA (x+1/2,-y+1/2,-z) (lime green). (c); Molecular contacts between BinA (x,y,z) (green) and BinB (x-1/2,-y+1/2,-z) (cyan). This interface involves the pro-peptide of BinB (residues 396-448). (d); Molecular contacts between BinA (x,y,z) (green) and BinB (-x+2, y-1/2,-z+1/2) (cyan). This interface involves the pro-peptide of BinB (residues 396-448). (e); Molecular contacts between BinA (x,y,z) (green) and BinB (-x+5/2, -y,-z+1/2) (cyan). (f); Molecular contacts between BinB (x,y,z) (cyan) and BinB (-x+2, y-1/2,-z+1/2) (teal). A small part of this interface involves the pro-peptide of BinB (residues 396-448). (g); Molecular contacts between BinB (x,y,z) (cyan) and BinB (x, y-1, z) (teal).
Extended Data Figure 7
Extended Data Figure 7. Electrostatic complementarity, tyrosine distribution, predicted electrostatic changes upon pH elevation and crystal solubilisation assays
a, Electrostatic surface complementarity of the BinA-BinB interface. At pH 7.0 (left column), complementary charges are notable between the BinA electrostatic surface potential (top) and the BinB electrostatic surface potential (bottom). The complementarity in potential is highlighted by the vertical arrows connecting adjacent patches on opposing surfaces of the interface. At pH 10.5 (right column), deprotonation of tyrosine and increased negative charge on acid residues causes a reduction in electrostatic complementarity from 0.37 to 0.29 . All panels depict the BinA surface of the BinAB dimer interface. In the upper panels, this surface is coloured by electrostatic surface potential of BinA; in the lower panel, this surface is coloured by electrostatic surface potential of BinB. Residues lining the interface (sticks) are labelled with colour corresponding to the domain to which it belongs. The colour scheme is as described in Extended Data Fig. 2a. BinA residues are labelled in the upper panel. BinB residues are labelled in the lower panel. In all panels, the pseudo two-fold axis relating BinA and BinB is in a vertical orientation (black line in Fig. 3a, lower panel).b, Distribution of tyrosine residues in the BinAB dimer. Of the total 49 tyrosine residues, 48 are ordered in the crystal structure. Of these, 20% are located in the dimer interface, which itself accounts for only 10% of the total molecular surface. Thus, the distribution of tyrosine residues is slightly more concentrated on the dimer interface compared to the remainder of the BinAB surface. Tyrosines outside the dimer interface are probably more prone to deprotonation than those within the dimer interface, due to differences in solvent accessibility. c-d, Electrostatic potential map of BinA and BinB. The surface of the BinAB dimer is depicted, coloured by electrostatic surface potential of BinA, on the left, and by that of BinB, on the right. In (e), the regions of BinA (left) and BinB (right) that participate in the dimer interface are highlighted. In (f), the external surface of the dimer is highlighted. In both (e) and (f), the upper and lower panels show the electrostatic surface potentials of BinA (left) and BinB (right) at pH 7 and pH 10.5, respectively. e, Alkaline induced crystal dissolution is delayed for BinA(D22N) mutant compared to wild type. Our structural data suggested that BinA Asp22 was an important pH sensor for triggering crystal dissolution at the high pH characteristic of the mosquito midgut. We reasoned that a D22N mutation in BinA would render the crystal less sensitive to pH by stabilizing a hydrogen bond with the BinB C-terminal carboxylate. We constructed a BinA D22N mutant and measured solubility of BinA(D22N)BinB crystals at pH 10, colleting three data points for each time point. We found its solubility in vitro decreased by 30% between 30 and 90 minutes at pH 10 compared to wild type crystals, but not at pH 7. After 90 minutes, crystals of wild type BinAB and BinA(D22N)BinB mutant are completely dissolved. This delay in crystal dissolution up to the 90 minutes time point is an important difference because in the fourth-instar Culex larvae, the larval feeding rate from the time particles are ingested until they are digested and exit the hindgut is 30 minutes (indicated by gray shading). Hence, the 60 minute delay that we see in our experiments with D22N is long enough to contribute to the striking loss of toxicity of more than 20-fold at the LC95 level (Supplementary Table 13). These results are consistent with the model of Asp22 serving as a pH sensor for crystallization.
Extended Data Figure 8
Extended Data Figure 8. Comparison of FopHi-FopHj maps obtained from crystals receiving different X-ray doses suggests that the structural changes observed are due to pH change and not radiation damage
a-f, The pH 5 and pH 10 datasets were collected with a ∼500-fold higher dose than the pH 7 dataset, raising the concern that some of the peaks in the FopH10-FopH7, φpH7 map result from radiation damage, most notably those observed on disulphides. Panels a-d show, for each of the four regions identified as highly sensitive to pH elevation in Figure 4 (Fig. 4c-f), the six possible FopHj-FopHi, φpHi maps calculated from the pH 5, pH 7 and pH 10 datasets and structures. Panels e-f show these maps around the disulphides of BinA (e) and BinB (f). BinA and BinB are shown as cartoons, coloured by subdomain, as in Fig. 4. The cartoons range in colour from pale to medium, to dark, signifying the pH values 5, 7, and 10. Consistent with the hypothesis that a 500-fold difference in dose causes no significant structural change, we see a lack of peaks in the FopH5-FopH7, φpH7 map (Riso=0.26) around disulphides (e, f) and other pH sensitive residues (a-d). Consistent with the hypothesis that the peaks observed in the FopH10-FopH7, φpH7 map (Riso=0.23) are caused by pH change, these peaks are reproduced in the FopH10-FopH5, φpH5 and FopH5- FopH10, φpH10 maps (Riso =0.35). We interpret this pattern of peaks as implying movement of the disulphide bonds rather than their disruption. This movement accompanies pH-sensitive rigid-body motion of the trefoil domains (Extended Data Fig. 9). g-h, Peaks stronger than ± 3.5 σ were integrated contiguously in the FopH10- FopH7, φpH7 (upper panels) and FopH5-FopH7, φpH7 map (lower panels) and then assigned to the closest residue. The secondary structures of BinA (g) and BinB (h) are shown as cartoons, coloured by subdomain as in Fig. 4. The background of the sequence is also coloured by subdomain. The sequence-wise integration of the FopH10-FopH7, φpH7 map reveals that BinB is more affected by the pH elevation than BinA, and in both chains, the trefoil is more affected than the pore-forming domain. The propeptide and TM regions of both proteins are also sensitive to pH elevation. Peaks in the FopH5-FopH7, φpH7 map (lower panels) are smaller in magnitude and concentrated in the trefoil domain of BinA and the C-terminal propeptide of BinB. They correspond to side chains reorientation rather than increased dynamics or domain motion (Extended Data Fig. 9). The marked difference in pattern between the FopH10-FopH7, φpH7 and FopH5-FopH7, φpH7 map integrations is consistent with the hypothesis that the peaks observed in these maps are not due to radiation damage, but rather to pH induced conformational changes.
Extended Data Figure 9
Extended Data Figure 9. Conformational changes in the BinAB dimer upon pH elevation from 7 to 10
a-d, Distance difference matrices (DDMs) calculated between the pH 7 (reference) structure and either the pH 10 or the pH 5 structure. Blue and red indicate decreases and increases in Cα-Cα distances in the pH 10 or pH 5 structures as compared to the pH 7 structure, respectively. The secondary structures of BinA (a-c) and BinB (a, b, d) are recapitulated by cartoons on the side or the diagonal of the DDMs. These cartoons are coloured by subdomain as in Fig. 4. (a) Intermolecular (BinA vs. BinB) DDM between the pH 10 and the pH 7 structures. This DDM illustrates that the BinAB dimer contracts upon pH elevation, with the two trefoil domains coming closer to one another. This might be due to electrostatic repulsion at crystal contact zone 5 (Fig. 4e, Extended Data Fig. 6e and Supplementary Table 7), which involves the trefoils of BinA and BinB from two symmetry related dimers. (b); Intermolecular (BinA vs. BinB) DDM between the pH 5 and the pH 7 structures. The pH5 structure is overall slightly more compact than the pH 7 structures but shows no major conformational changes. (c, d); Intramolecular DDMs of BinA (c) and BinB (d). Changes in Cα-Cα distances between the pH 10 and the pH 7 structures are reported below the diagonal, while those between the pH 7 and the pH 5 structures are shown above the diagonal. The pH 5 and pH 7 structures of BinA. (c) and BinB (d) are overall similar, with only the BinA loop Ile110-Arg120 and BinB loop Lys175-Ser184 showing a noticeable change of conformation. In contrast, the pH 10 structures of BinA (c) and BinB (d) appear more compact. On the local level, striking conformational changes are observed upon pH elevation in the N-terminal propeptide of BinA, in loops Ile110-Thr120 (trefoil) and Asn341-Tyr345 (Pore forming domain: PFD) of BinA, and in loop Lys175-Ser184 (trefoil) of BinB. The increase in compactness is due to the trefoil domain coming closer to the PFD, in both BinA and BinB. BinA loop Ile110-Thr120 appears sensitive to both pH elevation and decrease. e-f, Porcupine plots depicting differences between structures of BinAB for pH 7 vs. 5 (green arrows) and pH 7 vs. 10 (red arrows). The pH7 structure of BinAB is shown, coloured by subdomain as in Fig. 4. The movement of Cα atoms is indicated by arrows on the ribbon representation, with the magnitude of motions illustrated by length of arrows exaggerated by 2.5 Å to increase visibility (for all atoms that move by more than 0.1 Å). (e); View of the BinAB dimer, in a orientation similar to Fig. 4b. As compared to Fig. 3a, b, this view is rotated by 180° around the vertical axis. (f); View from the top of the trefoil domains; this face of the BinAB dimer is presumably that interacting with the apical membrane of larvae midgut cells. The view in (f) is 90° apart from that in (e).
Figure 1
Figure 1. De novo phasing of SFX data collected by from nanocrystals of L. sphaericus BinAB
a-b, Phase contrast micrograph of B. thuringiensis sporulated cells engineered to produce BinAB nanocrystals (a) and scanning electron micrograph of isolated BinAB nanocrystals (a). c, The contribution of partiality refinement to the accuracy of the experimental phases is illustrated by maps calculated without (top row) and with (bottom row) benefit of the post-refinement procedure. The left three columns show SIRAS-phased maps from PCMBS, Gd, and VIL derivatives. The fourth column shows MIRAS phased maps from all three derivatives. The right column shows the refined model and 2Fo-Fc map. The improvement from post-refinement is quantified by the correlation coefficient (CC) between each experimental map and the map phased by the final refined coordinates. Main chain and side chain atoms are shown in black and grey sticks, respectively.
Figure 2
Figure 2. BinA and BinB folds and carbohydrate binding modules
a, BinA and BinB are structurally similar to each other, each composed of trefoil and pore forming domains. The most noticeable differences correspond to insertions in surface loops on the trefoil domains (purple). b, The trefoil domains are composed of barrel and cap subdomains. In the cap subdomain, there are three canonical carbohydrate modules (α, β, γ). Carbohydrate molecules superimposed from structures of hemagglutinin (3AH1) and hemolytic lectin (1W3G) are shown in black sticks. These occupy the α, β, and γ binding modules. A fourth carbohydrate binding site, marked IIIA, is a minor site observed in hemagglutinin. c, View of the cap subdomains along the pseudo-three fold symmetry axis; loop insertions (purple) break the symmetry in BinB. The starburst indicates a steric overlap between the modelled carbohydrate and the α module of BinB. The conflict arises from the 9-residue insertion in this loop, tethered by a disulphide bond, C67-C161. d, View of the barrel subdomains along the pseudo three-fold symmetry axis. BinB residues implicated in receptor binding are shown in sticks (orange). Structurally analogous residues are shown on BinA.
Figure 3
Figure 3. BinAB dimer assembly is weakened by proteolysis
a, The BinAB dimer shown here manifests the largest intermolecular interface in the crystal. The vertical arrow and lens shaped symbol (black) indicate the position of the pseudo two-fold rotation axis that relates BinA and BinB. The interface extends over all four domains in both molecules. Propeptides (dark blue and dark red) play a substantial role in the interface. b, Sphere representation of the BinAB dimer shows that the canonical carbohydrate modules are accessible, but the receptor binding epitope is not, implying that carbohydrate binding occurs first, and then a conformational change exposes the receptor binding epitope. c, d, e Transformation of the BinAB interface accompanying proteolysis. Panel (c) illustrates the BinAB dimer split apart to reveal the interface. (d), All four subdomains and three propeptides contribute to the BinAB interface. Dashed lines connect select propeptide residues in contact across the dimer interface. (e) Dissociation of the propeptides following proteolysis eliminates 42% of the interface. Dotted lines encompassing white patches mark the interface lost after dissociation of the propeptides. Dashed lines connect select residues remaining in contact across the dimer interface following propeptide dissociation. The TM subdomain is the only subdomain that does not lose contacts after proteolysis.
Figure 4
Figure 4. pH sensing in BinAB crystals
a-f, BinA and BinB cartoons are coloured by subdomain. The pH 5, pH 7 and pH 10 structures are increasingly shaded. Symmetry-related molecules are coloured similarly. The Fo[pH10] - Fo[pH7] map is superimposed at ± 3.5 σ, with positive and negative peaks shown in green and red, respectively. Panels (a) and (b) show orthogonal views of the BinAB dimer. The Fo-Fo map reveals four regions (c, d, e, f) of the BinAB crystal that are perturbed by elevated pH, probably reflecting early events in crystal dissolution. Rupture of H-bonds and conformational changes are highlighted by starbursts and arrows, respectively. (c); Deprotonation of Asp8, Glu14 and Tyr213 triggers a helix to extended β-strand conformational change in BinA N-term propeptide, increasing its accessibility to proteolytic cleavage. (d); Deprotonation of BinB Gln448 terminal carboxylate breaks its H-bond with BinA Asp22, weakening the BinA-BinB dimer interface and making the C-terminal propeptide of BinB available for proteolysis. (e); Deprotonation of BinA Tyr134 and His125 results in the rupture of their H-bonds with BinB Glu59. Loss of these contacts directly weakens the lattice. (f); Negative electrostatic repulsion pushes Asp342 away from Glu240 in BinA. This rearrangement could be an early step in the transformation into a pore owing to Asp342's location at the junction between the three PFD subdomains.

References

    1. Moreira LA, et al. A Wolbachia symbiont in Aedes aegypti limits infection with dengue, Chikungunya, and Plasmodium. Cell. 2009;139:1268–1278. - PubMed
    1. Alphey N, Bonsall MB, Alphey L. Combining pest control and resistance management: synergy of engineered insects with Bt crops. J Econ Entomol. 2009;102:717–732. - PubMed
    1. Federici BA, Park HW, Bideshi DK. Overview of the basic biology of Bacillus thuringiensis with emphasis on genetic engineering of bacterial larvicides for mosquito control. Open Toxinol J. 2010;3:83–100.
    1. Fang W, et al. Development of transgenic fungi that kill human malaria parasites in mosquitoes. Science. 2011;331:1074–1077. - PMC - PubMed
    1. Worrall E, Fillinger U. Large-scale use of mosquito larval source management for malaria control in Africa: a cost analysis. Malar J. 2011;10:338. - PMC - PubMed

Additional references for Methods, Supplementary Discussion and Supplementary Tables

    1. Park HW, Ge B, Bauer LS, Federici BA. Optimization of Cry3A yields in Bacillus thuringiensis by use of sporulation-dependent promoters in combination with the STAB-SD mRNA sequence. Appl Environ Microbiol. 1998;64:3932–3938. - PMC - PubMed
    1. Sawaya MR, et al. Protein crystal structure obtained at 2.9 Å resolution from injecting bacterial cells into an X-ray free-electron laser beam. Proc Natl Acad Sci U S A. 2014;111:12769–12774. - PMC - PubMed
    1. Park HW, et al. Recombinant larvicidal bacteria with markedly improved efficacy against culex vectors of west nile virus. Am J Trop Med Hyg. 2005;72:732–738. - PubMed
    1. Bourgouin C, Delécluse A, de la Torre F, Szulmajster J. Transfer of the toxin protein genes of Bacillus sphaericus into Bacillus thuringiensis subsp israelensis and their expression. Appl Environ Microbiol. 1990;56:340–344. - PMC - PubMed
    1. Park HW, Hice RH, Federici BA. Effect of Promoters and Plasmid Copy Number on Cyt1A Synthesis and Crystal Assembly in Bacillus thuringiensis. Curr Microbiol. 2016;72:33–40. - PubMed

Publication types