. 2016 Oct 6;538(7623):114-117.
doi: 10.1038/nature19771. Epub 2016 Sep 28.

XPO1-dependent nuclear export is a druggable vulnerability in KRAS-mutant lung cancer

Affiliations

XPO1-dependent nuclear export is a druggable vulnerability in KRAS-mutant lung cancer

Jimi Kim et al. Nature. .

Abstract

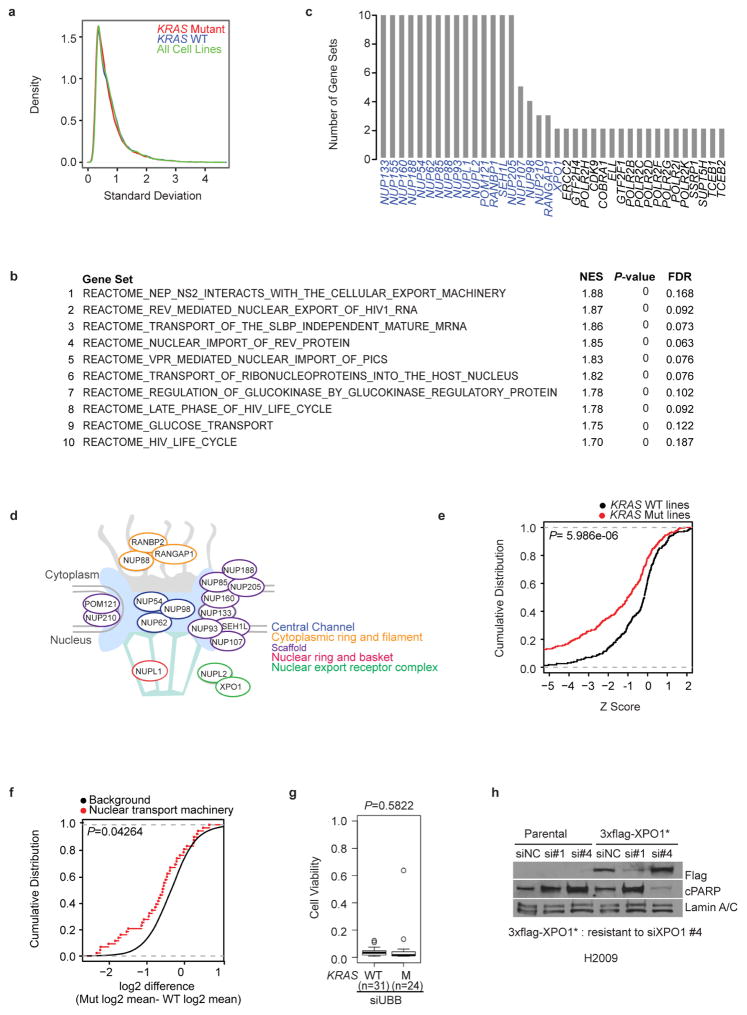
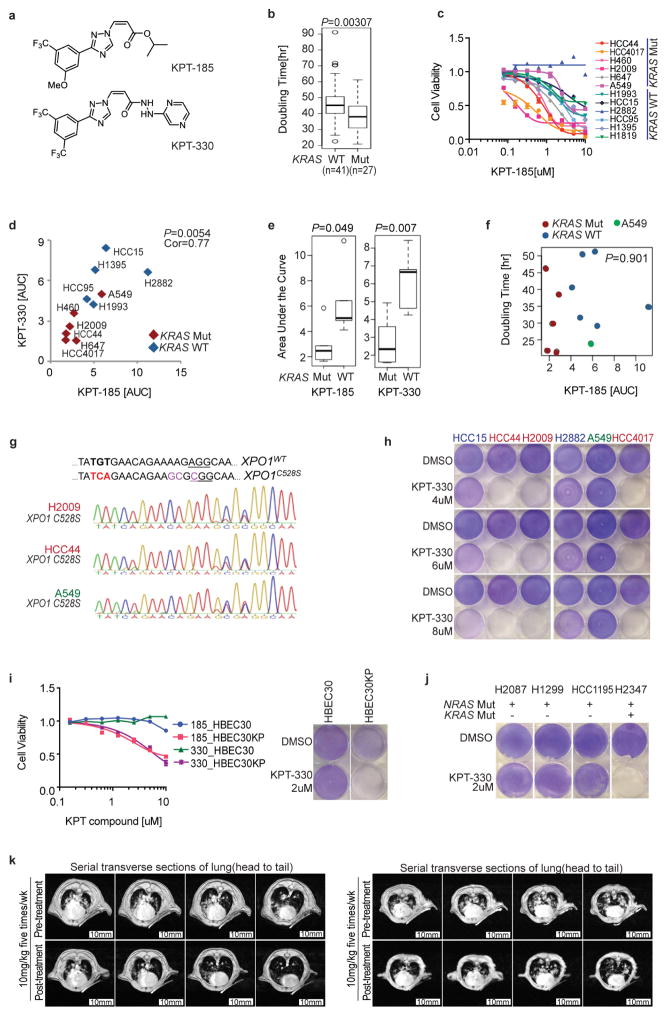
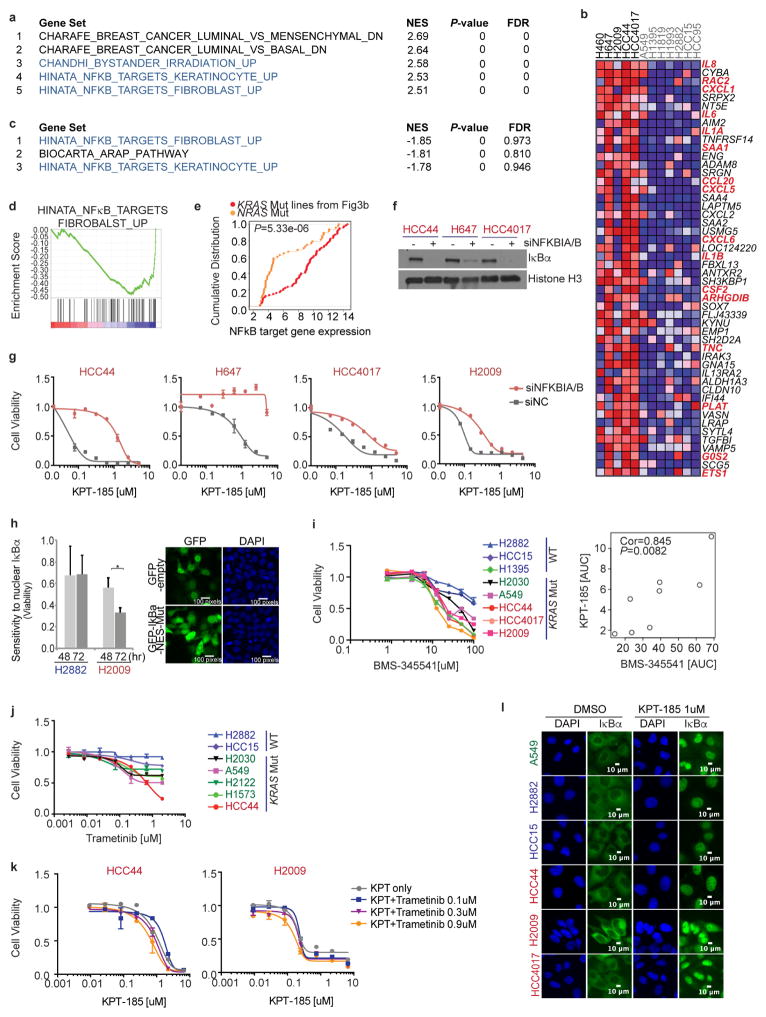
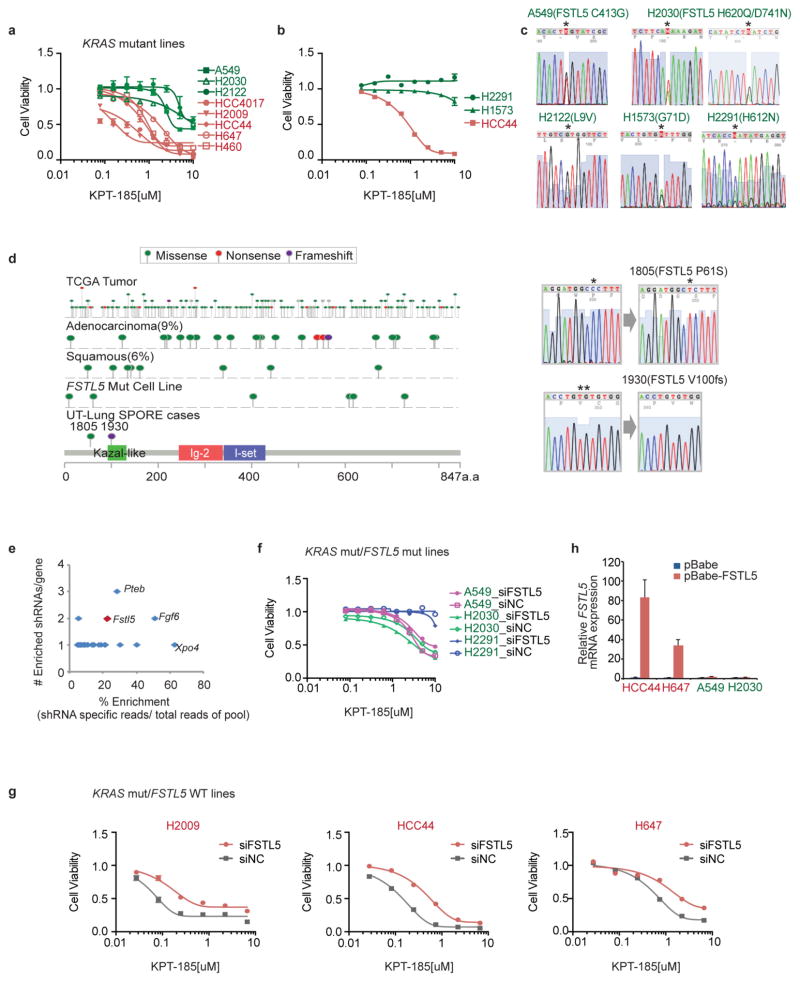
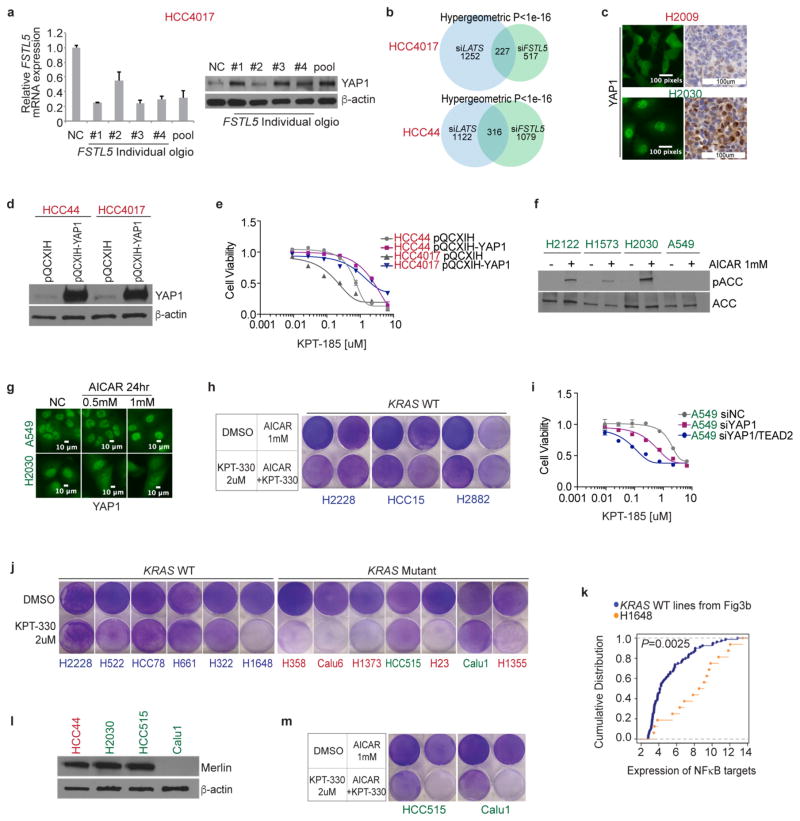
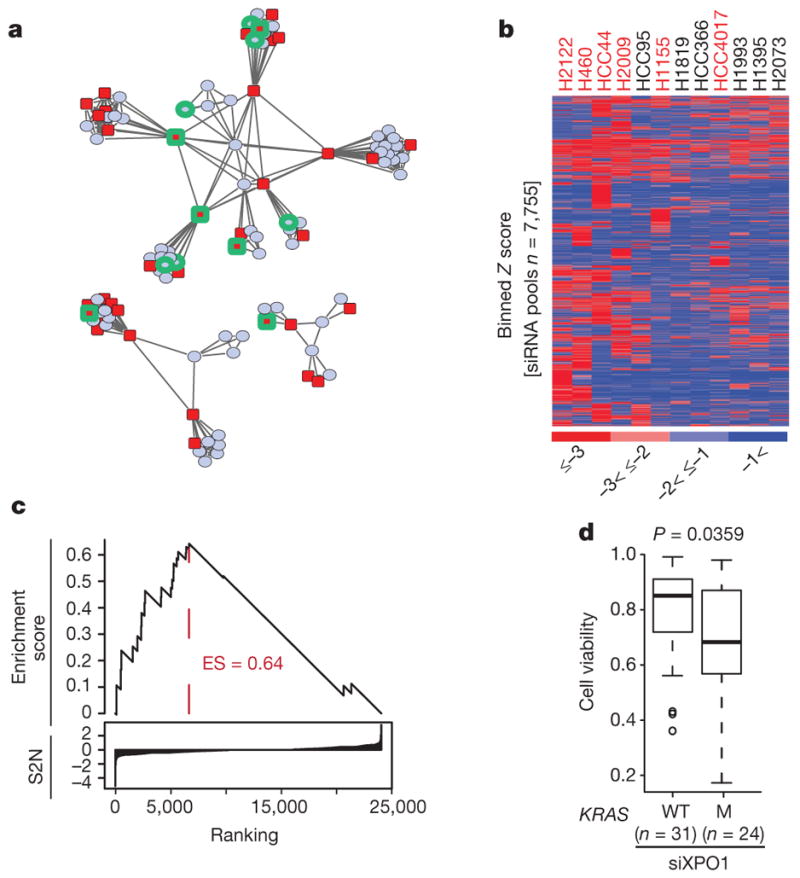
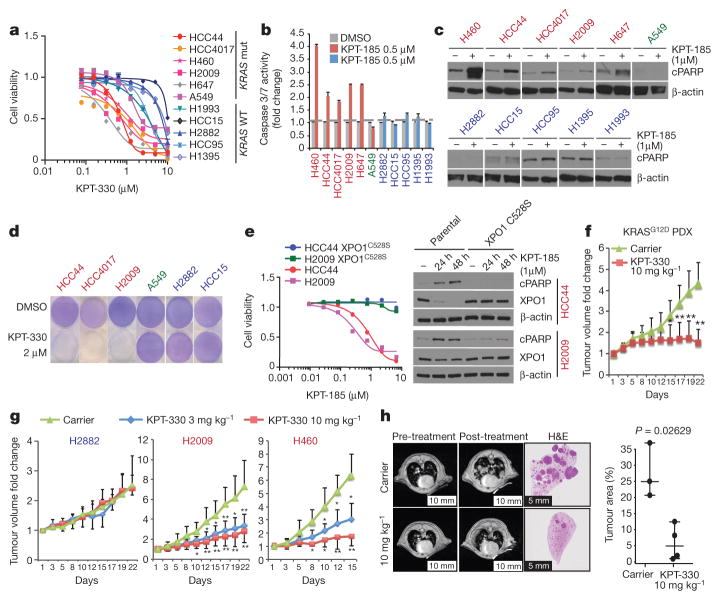
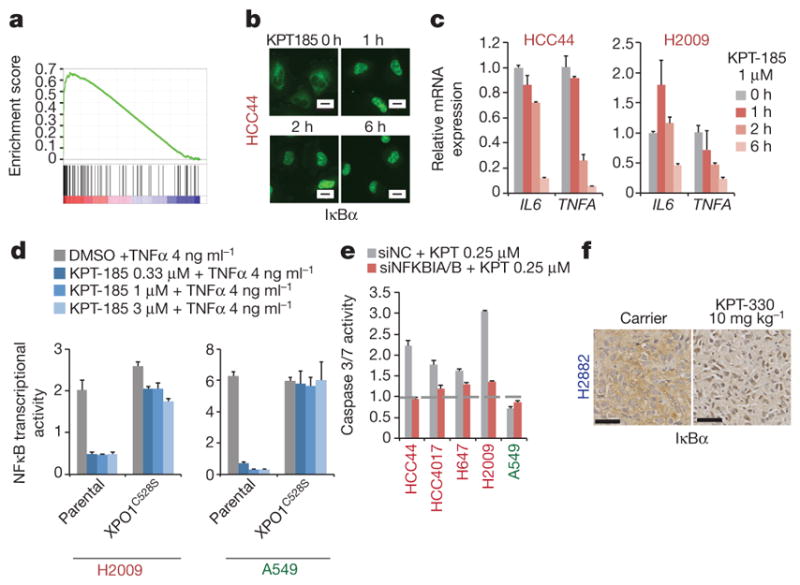
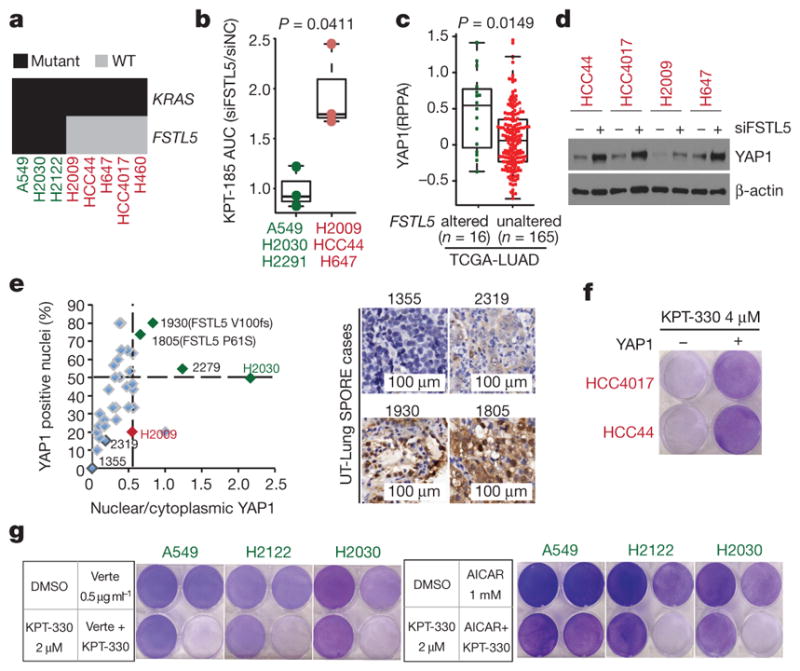
The common participation of oncogenic KRAS proteins in many of the most lethal human cancers, together with the ease of detecting somatic KRAS mutant alleles in patient samples, has spurred persistent and intensive efforts to develop drugs that inhibit KRAS activity. However, advances have been hindered by the pervasive inter- and intra-lineage diversity in the targetable mechanisms that underlie KRAS-driven cancers, limited pharmacological accessibility of many candidate synthetic-lethal interactions and the swift emergence of unanticipated resistance mechanisms to otherwise effective targeted therapies. Here we demonstrate the acute and specific cell-autonomous addiction of KRAS-mutant non-small-cell lung cancer cells to receptor-dependent nuclear export. A multi-genomic, data-driven approach, utilizing 106 human non-small-cell lung cancer cell lines, was used to interrogate 4,725 biological processes with 39,760 short interfering RNA pools for those selectively required for the survival of KRAS-mutant cells that harbour a broad spectrum of phenotypic variation. Nuclear transport machinery was the sole process-level discriminator of statistical significance. Chemical perturbation of the nuclear export receptor XPO1 (also known as CRM1), with a clinically available drug, revealed a robust synthetic-lethal interaction with native or engineered oncogenic KRAS both in vitro and in vivo. The primary mechanism underpinning XPO1 inhibitor sensitivity was intolerance to the accumulation of nuclear IκBα (also known as NFKBIA), with consequent inhibition of NFκB transcription factor activity. Intrinsic resistance associated with concurrent FSTL5 mutations was detected and determined to be a consequence of YAP1 activation via a previously unappreciated FSTL5-Hippo pathway regulatory axis. This occurs in approximately 17% of KRAS-mutant lung cancers, and can be overcome with the co-administration of a YAP1-TEAD inhibitor. These findings indicate that clinically available XPO1 inhibitors are a promising therapeutic strategy for a considerable cohort of patients with lung cancer when coupled to genomics-guided patient selection and observation.


Conflict of interest statement

The authors declare no competing financial interests. Readers are welcome to comment on the online version of the paper.

Figures

Extended Data Figure 1
Extended Data Figure 1. Two-dimensional APC projection of 106 NSCLC lines based on whole-genome mRNA expression variation
High-resolution, annotated version of Fig. 1a.
Extended Data Figure 2
Extended Data Figure 2. Synthetic-lethal genetic interactions in KRAS-mutant NSCLC cells
a, Distribution of the variation in mRNA expression among KRAS-mutant lines (red curve, n = 37), KRAS-wild-type lines (blue curve, n = 69) and all NSCLC lines (green curve). b, Top-ranked gene sets (FDR <0.2, Kolmogorov–Smirnov P <1 ×10⁻¹⁶) returned by functional GSEA. c, Genes present in leading edge gene representation among the gene sets in b. Known components of nuclear transport machinery (indicated in d) are labelled in blue. d, Biological process representation of the leading-edge synthetic-lethal gene-depletion targets. e, Cumulative distributions of the viability Z-scores for siRNA pools, targeting genes in d, among KRAS-mutant versus KRAS-wild-type cell lines. Kolmogorov–Smirnov test P value is indicated. f, Cumulative distributions of log2 difference scores for depletion of shRNAs in KRAS-mutant versus KRAS-wild-type cells. Red, shRNAs targeting genes encoding nuclear transport machinery from e; black, all other shRNAs. Kolmogorov–Smirnov test P value is indicated. Data obtained from a previous study. g, Cell viability after UBB depletion (a broadly toxic siRNA target that serves as a positive transfection control) in KRAS-mutant versus wild-type lines. Unpaired t-test was used for the comparison. h, Rescue of XPO1 siRNA toxicity by ectopic expression of a mutant XPO1 cDNA designed to be resistant to XPO1 siRNA number 4. Lamin A/C is shown as a loading control.
Extended Data Figure 3
Extended Data Figure 3. Selective sensitivity of KRAS-mutant NSCLC cells to chemical inhibition of the nuclear transport receptor XPO1
a, Structures of SINE compounds (XPO1 inhibitors), KPT-185 and KPT-330. b, Enrichment of short doubling times in KRAS-mutant versus wild-type NSCLC lines. Box plots indicate median and IQR. Unpaired t-test was used for the comparison. c, The 8-point dose–response viability curves for the indicated panel of NSCLC lines following a 72-h exposure to KPT-185. Mean ± s.d. (n = 3) is shown. d, Correlation of sensitivity to the XPO1 inhibitors KPT-330 and KPT-185. AUCs from c and Fig. 2a. Red, KRAS mutant; blue, KRAS wild type. Pearson correlation P value is indicated. e, Response of KRAS-mutant versus KRAS-wild-type cohorts to XPO1 inhibitors. Box plots indicate median values and IQR, an unpaired t-test was used for the comparison. f, Scatter plot of cell-line doubling time versus KPT-185 sensitivity. Pearson correlation P value is indicated. g, Sequencing chromatogram of XPO1 genomic DNA of genome-edited cells. The C528S substitution was induced by CRISPR/Cas9-induced homologous recombination. Three synonymous mutations were simultaneously introduced near the PAM site (underlined) in order to prevent re-cutting of the recombined DNA. h, Selective sensitivity of KRAS-mutant lines to KPT-330 at doses over 400% higher than bioactive in vivo concentrations. Post-confluent cells were exposed to KPT-330 for 5 days. i, Response of KRASG12V-expressing lung epithelia (HBEC30KP), versus wild-type parental epithelia (HBEC30), to KPT-185 and KPT-330. Left, mean ± s.d., n = 3; right, monolayer assay is as in h. j, Cytotoxic effect of 2 μM KPT-330 on the indicated NRAS-mutant cell lines. Monolayer assay is as in h. k, Lung tumour burden pre- and post-treatment as indicated by magnetic resonance images. Two mice presenting with exceptionally high initial tumour burden were treated with 10 mg kg−1 KPT-330 five times per week. Lungs were imaged with serial transverse magnetic resonance sections on treatment day 0 and again on day 21.
Extended Data Figure 4
Extended Data Figure 4. Selective addiction to NFκB activity specifies sensitivity to XPO1 inhibition
a, Top five gene sets that significantly discriminate XPO1-inhibitor-sensitive lines from XPO1-inhibitor-resistant lines. NFκB target gene sets are indicated in blue. b, Top 50 differentially expressed genes ranked by signal-to-noise (S2N) ratio. Known NFκB targets are indicated in red (16/133; hypergeometric P <1 ×10⁻¹⁶). c, Top 3 gene sets that are downregulated by a 12-h exposure to an XPO1 inhibitor. NFκB target gene sets are indicated in blue. d, Enrichment plot of NFκB target genes (KPT-185-treated versus DMSO-treated). e, Evidence for attenuated NFκB signalling in XPO1-inhibitor-resistant NRAS-mutant cell lines. Empirical cumulative distributions of NFκB target gene expression (from b) are shown for NRAS-mutant cell lines versus KRAS-mutant cell lines as indicated. Yellow, NRAS-mutant/XPO1-inhibitor-resistant lines (H2087, H1299 and HCC1195, shown in Extended Data Fig. 3j); red, KRAS-mutant/XPO1-inhibitor-sensitive line (shown in Figs 2, 3). Yellow versus red, P < 0.01 using Kolmogorov–Smirnov test. f, Immunoblot of IκBα 48 h post-transfection of siNFKBIA/siNFKBIB (targeting genes that express IκBα/IκBβ) for confirmation of target depletion. Histone H3 is shown as a loading control. g, IκB-dependent sensitivity to KPT-185. Cells were exposed to the indicated concentrations of XPO1 inhibitors for 72 h 24 h post-transfection with the indicated siRNA. Mean and range (n = 2). h, Intolerance to ectopic nuclear accumulation of IκBα in XPO1-inhibitor-sensitive cells. Left, y axis indicates fold change in the percentage of GFP-positive nuclei of GFP-IκB-NES-mutant-positive cells normalized to GFP-empty-vector-positive cells. Bars indicate mean ± s.d. for three independent experiments (*P <0.05, Unpaired t-test). Right, 293T cells transfected with the indicated plasmids to confirm plasmid transfection efficiency and localization of ectopically expressed proteins. Cells were fixed and photographed 48 h post-transfection. i, Positive correlation between sensitivity to KPT-185 and BMS-345541 (P <0.01, Pearson correlation). Dose–response curves of a panel of NSCLC lines following a 72-h exposure to BMS-345541. Mean ± s.d. (n = 3). AUCs of KPT-185 were determined from Extended Data Fig. 3c. Red labels, KRAS mutant/XPO1-inhibitor sensitive; green labels, KRAS mutant/XPO1-inhibitor resistant; blue labels, KRAS wild type. j, Dose–response curves of a panel of NSCLC lines following a 72-h exposure to Trametinib. Mean and range (n = 2). Label colours as in i. k, Dose–response curves of a panel of NSCLC lines following a 72-h exposure to KPT-185 combined with the indicated concentrations of Trametinib. Mean and range (n = 2). l, Subcellular localization of IκBα in the presence of 1 μM KPT-185. Cells were exposed to KPT-185 for 24 h. Label colours are as in i.
Extended Data Figure 5
Extended Data Figure 5. Concurrent mutations in FSTL5 are associated with intrinsic resistance of KRAS-mutant lines to XPO1 inhibitor
a, Eight-point dose–response viability curves for H2122 and H2030 following a 72-h exposure to KPT-185. Mean ± s.d. (n = 3). Data are overlaid with responses of the indicated lines from Extended Data Fig. 3c for comparison. b, KPT-185 dose–response curves. Mean ± s.d. (n = 3). c, FSTL5 Sanger-sequencing chromatograms of detected FSTL5 variants in the indicated cell lines. d, Map of somatic alterations in FSTL5 detected in all cancers (TCGA), lung adenocarcinoma (TCGA), lung squamous (TCGA), NSCLC cell lines (this study), and human lung tumour samples, 1805 and 1930 (this study). e, Tumour suppressor genes identified in an oncogenomics-based in vivo RNAi screen. Among the genes targeted by 36 shRNAs overrepresented during HCC tumour development, Fstl5 was the third ranked gene suppressed by >1 enriched shRNA. The y axis indicates number of shRNAs per gene among the 36 enriched shRNAs. The x axis indicates shRNA specific reads over a total 2,307 sequence reads. f, g, KPT-185 dose–response of cells transfected with the indicated siRNAs as in Extended Data Fig. 4g. f shows KRAS-mutant/FSTL5-wild-type lines, g shows KRAS-mutant/FSTL5 mutant lines. Mean and range (n = 2). h, Relative ectopic expression of FSTL5 mRNA. Cells were infected with retrovirus carrying the indicated plasmids. Following a 7-day puromycin selection, cells were collected for qPCR. Mean and range (n = 2).
Extended Data Figure 6
Extended Data Figure 6. Concurrent mutations in FSTL5 are mechanistically coupled to YAP1 activation
a, Expression of FSTL5 mRNA (left) and YAP1 protein (right) following transfection with the indicated siRNAs targeting FSTL5. Cells were collected 72 h post-transfection for parallel qPCR and immunoblotting. Mean and range (n = 2). b, Intersection of the FSTL5-dependent and LATS-dependent gene expression programs in KRAS-mutant/XPO1-inhibitor-sensitive NSCLC lines. To evaluate the enrichment of YAP-responsive genes within the FSTL5-dependent gene expression network, quantitative whole-genome transcript arrays were prepared with mRNA isolated from the indicated cell lines treated with the indicated siRNAs 72 h post-transfection. LATS1/2 depletion was used to activate YAP-dependent gene expression. All arrays were normalized to corresponding control siRNA-treated samples. Euler plots indicate genes up- or downregulated at least twofold in response to siFSTL5, siLATS or both; hypergeometric P values are indicated. c, YAP1 fluorescence micrographs and representative YAP1 immunohistochemistry. H2009 and H2030 cell lines were used as a negative and positive control for YAP1 staining, respectively. d, Stably overexpressed YAP1 in KRAS-mutant/XPO1-inhibitor-sensitive lines. Cells were infected with the indicated retroviral vector, selected with hygromycin and then collected for immunoblotting. e, Induction of XPO1-inhibitor resistance by YAP1 overexpression. Proliferating cells stably expressing indicated plasmids were exposed to XPO1 inhibitors for 3 days. Mean ± range (n = 2). f, Immunoblot of the indicated proteins in KRAS-mutant/XPO1-inhibitor-resistant lines following a 24-h exposure to 1 mM AICAR. AICAR resulted in accumulation of phospho-acetyl-CoA-carboxlyase (pACC), an indicator of AMPK activation in all the lines tested except A549. A549 is known to be non-responsive to AICAR owing to the absence of LKB1 (also known as STK11) expression. g, Subcellular localization of YAP1 in response to 0.5 or 1 mM AICAR. Cells were exposed to AICAR for 24 h. Cytoplasmic accumulation of YAP1 was observed in response to AICAR exposure in H2030, but not in A549. h, Resistance of KRAS-wild-type lines to KPT-330 in combination with AICAR. Post-confluent cells were exposed to the indicated compounds for 3 days. i, Induction of XPO1 inhibitor-sensitivity by YAP1 and TEAD2 depletion. 48 h post-transfection with the indicated siRNAs, cells were exposed to the indicated concentrations of XPO1 inhibitors for 3 days. Mean and range (n = 2). j, Cytotoxic effect of 2 μM KPT-330 on indicated cell lines. Post-confluent cells were exposed to KPT-330 for 5 days. Red labels, KRAS-mutant/XPO1-inhibitor-sensitive; green labels, KRAS-mutant/XPO1-inhibitor-resistant; blue labels, KRAS wild type. k, Evidence for NFκB pathway activation in H1648 cells. Empirical cumulative distributions of NFκB target gene expression (from Extended Data Fig. 4b) are shown for H1648 versus KRAS-wild-type cell lines as indicated. Blue, KRAS-wild-type/XPO1-inhibitor-resistant lines (H2882, HCC15, H1395, H1993 and HCC95 shown in Figs 2 and 3); yellow, KRAS-wild-type/XPO1-inhibitor-sensitive line H1648 (shown in j). Cancer Cell Line Encyclopedia data indicates that H1648 harbours genomic amplification of IKBKB. Blue versus yellow, P <0.01, Kolmogorov–Smirnov test. l, Merlin expression is absent in Calu1 cells. m, Cytotoxic effect of the indicated compounds on the indicated cell lines. Post-confluent cells were treated as in h. HCC515 harbours a somatic mutation in LATS1.
Figure 1
Figure 1. Synthetic-lethal genetic interactions in KRAS-mutant NSCLC cells
a, Two-dimensional APC projection of 106 NSCLC lines based on whole-genome variation in mRNA expression. Nodes represent cell lines and edges represent the Euclidean distance between cell lines. Red nodes, KRAS mutant (n = 37); blue nodes, KRAS wild type (n = 69). Cell lines subjected to whole-genome siRNA toxicity screening are highlighted in green. b, Binned Z-score distributions of selectively toxic gene depletions across the indicated cell lines. Cell lines (in columns; red label, KRAS mutant; black label, KRAS wild type) and siRNA target genes (rows) are clustered by two-way unsupervised unweighted pair group method with arithmetic mean (UPGMA). c, The reactome NEP NS2 interacts with the cellular export machinery. Empirical cumulative siRNA score distribution for a top-ranked KRAS-mutant-enriched gene set. S2N, signal-to-noise ratio. d, Differences in cell viability following XPO1 depletion with XPO1 siRNA (siXPO1) in KRAS-mutant versus KRAS-wild-type (WT) cell lines. Box plots indicate median and interquartile range (IQR). Unpaired t-test, P = 0.0359.
Figure 2
Figure 2. Selective sensitivity of KRAS-mutant NSCLC cells to chemical inhibition of the nuclear transport receptor XPO1
a, Dose–response curves for a panel of NSCLC lines following a 72-h exposure to KPT-330. Data are mean ± s.d. (n = 3). b, Induction of Caspase 3/7 activity in KRAS-mutant lines by KPT-185. Bars indicate mean and range of data (n = 2). c, Accumulation of the cell death marker cleaved PARP (cPARP) in KRAS-mutant lines following exposure to 1 μM KPT-185. β-actin is shown as a loading control. d, Stationary-phase cell populations exposed to KPT-330 for 6 d (crystal violet). e, Rescue of XPO1 inhibitor toxicity by gene editing. Dose–response curves are as in a. Mean and range (n = 2). Immunoblots are as in c. f, g, Fold change in tumour volume in indicated xenografts upon XPO1 inhibition. *P <0.05, **P <0.01, Unpaired t-test, mean ± s.d. h, Representative lung magnetic resonance image of KrasLSL-G12D;p53fl/fl mouse is shown before and after treatment for each cohort. Post-treatment haematoxylin and eosin (H&E)-stained left lung lobe is shown. Tumour burden was calculated as the tumour area divided by lung area. Unpaired t-test, P = 0.0263; scale bars, 10 mm (left 4) and 5mm (right 2).
Figure 3
Figure 3. Selective addiction to NFκB activity specifies sensitivity to XPO1 inhibition
a, GSEA gene set, Hinata NFκB targets keratinocyte up. NFκB transcriptional target enrichment plot (XPO1-inhibitor-sensitive versus XPO1-inhibitor-resistant). b, Time-dependent nuclear accumulation of IκBα in response to 1 μM KPT-185. Scale bars, 20 μm. c, Time-dependent inhibition of NFκB target gene expression in response to 1 μM KPT-185. Mean and range (n = 2). d, Rescue of NFκB transcriptional activity by gene editing. Normalized luminescence-based NFκB reporter activity is shown. Mean + s.d. (n = 3). e, IκB-dependent induction of apoptosis by XPO1 inhibitors. Cells were transfected with the indicated siRNAs and 24 h later they were exposed to 0.25 μM KPT-185 for 48 h. siNC, negative control siRNA. Mean and range (n = 2). f, Nuclear accumulation of IκBα in xenograft tumours in response to KPT-330 treatment. Scale bars, 50 μm.
Figure 4
Figure 4. Concurrent mutations in FSTL5 are associated with intrinsic resistance of KRAS-mutant lines to XPO1 inhibitors and are mechanistically coupled to YAP1 activation
a, Biclustering results for NSCLC cell lines and KRAS and FSTL5 mutation status. b, Selective effects of FSTL5 depletion on the XPO1-inhibitor-sensitivity of KRAS-mutant, FSTL5-wild-type lines (red) versus KRAS-mutant, FSTL5-mutant lines (green). Box plot indicates fold changes in area under the curve (AUC) of FSTL5 siRNA (siFSTL5)-transfected cells normalized to negative control siRNA-transfected cells. AUCs calculated from Extended Data Fig. 5f, g. Unpaired t-test, P = 0.0411. c, Significant enrichment of YAP1 protein in tumours harbouring FSTL5 somatic alterations (data taken from the TCGA-LUAD). Unpaired t-test, P = 0.0149. d, YAP1 protein accumulation 72 h post-transfection with FSTL5 siRNAs. e, YAP1 immunohistochemistry. Detected somatic FSTL5 variants are indicated. Representative YAP1 immunohistochemistry stains are shown in the right panel. f, Induction of XPO1-inhibitor resistance by YAP1 overexpression (crystal-violet stained). g, Induction of XPO1 inhibitors sensitivity by verteporfin/AICAR-mediated YAP pathway inhibition (crystal-violet stained).

Comment in

References

    1. Cox AD, Fesik SW, Kimmelman AC, Luo J, Der CJ. Drugging the undruggable RAS: mission possible? Nat Rev Drug Discov. 2014;13:828–851. - PMC - PubMed
    1. Barbie DA, et al. Systematic RNA interference reveals that oncogenic KRAS-driven cancers require TBK1. Nature. 2009;462:108–112. - PMC - PubMed
    1. Luo J, et al. A genome-wide RNAi screen identifies multiple synthetic lethal interactions with the RAS oncogene. Cell. 2009;137:835–848. - PMC - PubMed
    1. Kumar MS, et al. The GATA2 transcriptional network is requisite for RAS oncogene-driven non-small cell lung cancer. Cell. 2012;149:642–655. - PubMed
    1. Scholl C, et al. Synthetic lethal interaction between oncogenic KRAS dependency and STK33 suppression in human cancer cells. Cell. 2009;137:821–834. - PubMed

MeSH terms

Substances