. 2016 Sep 27;17(1):149-164.
doi: 10.1016/j.celrep.2016.08.090.

The Homeobox Transcription Factor RHOX10 Drives Mouse Spermatogonial Stem Cell Establishment

Affiliations

The Homeobox Transcription Factor RHOX10 Drives Mouse Spermatogonial Stem Cell Establishment

Hye-Won Song et al. Cell Rep. .

Abstract

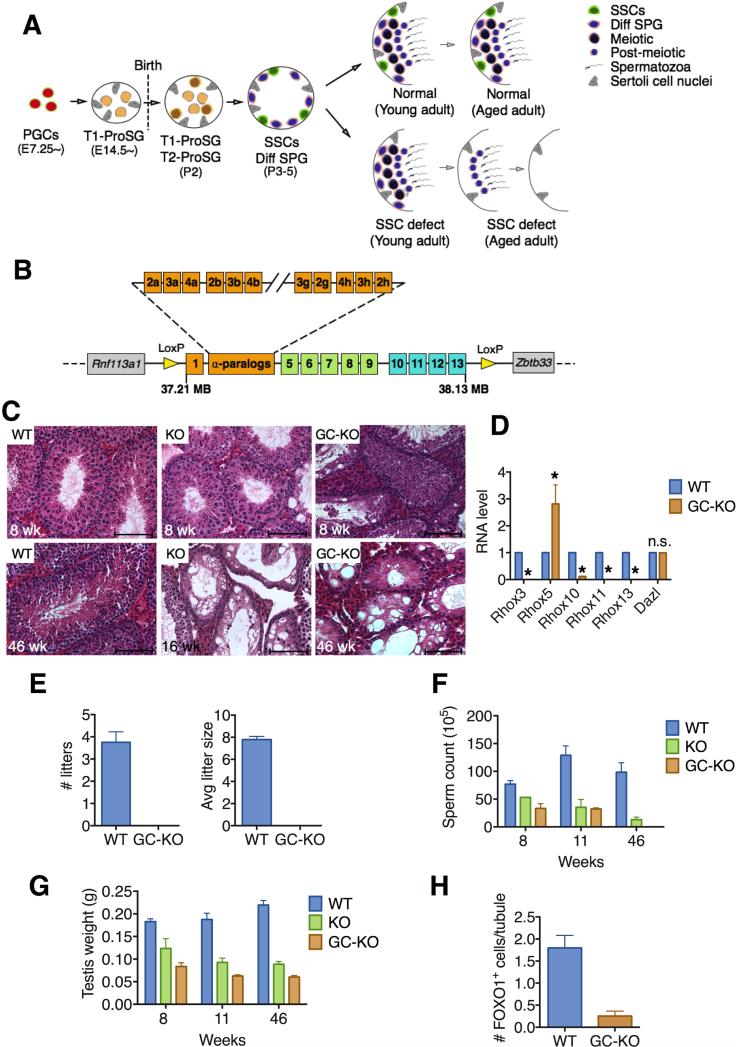
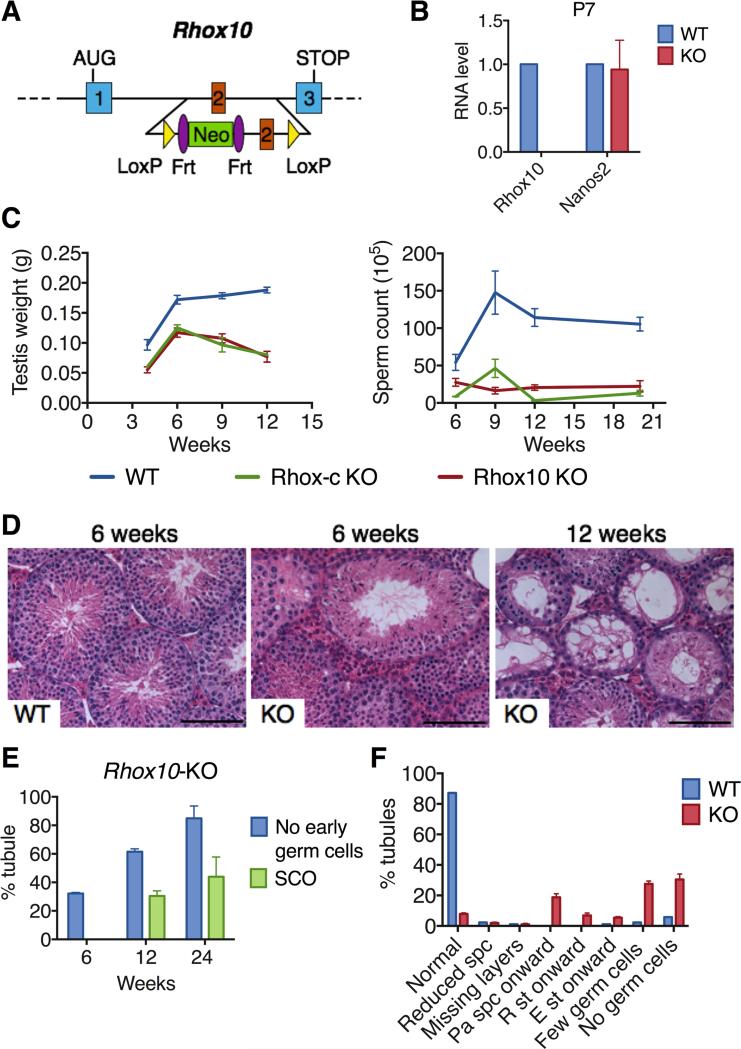
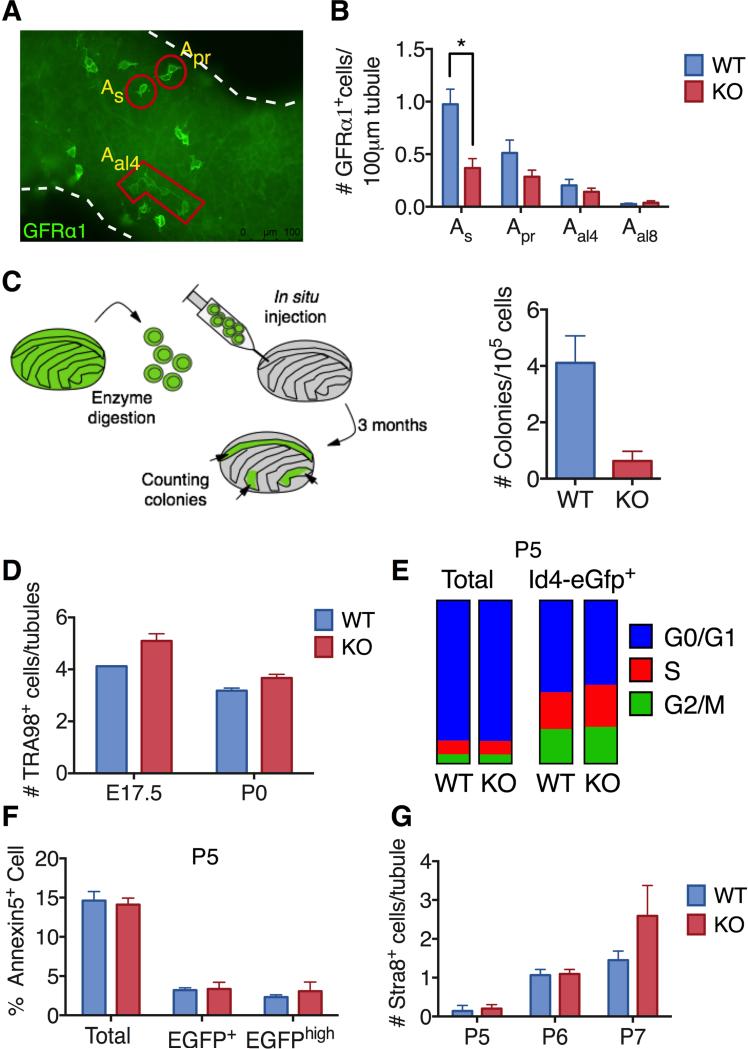
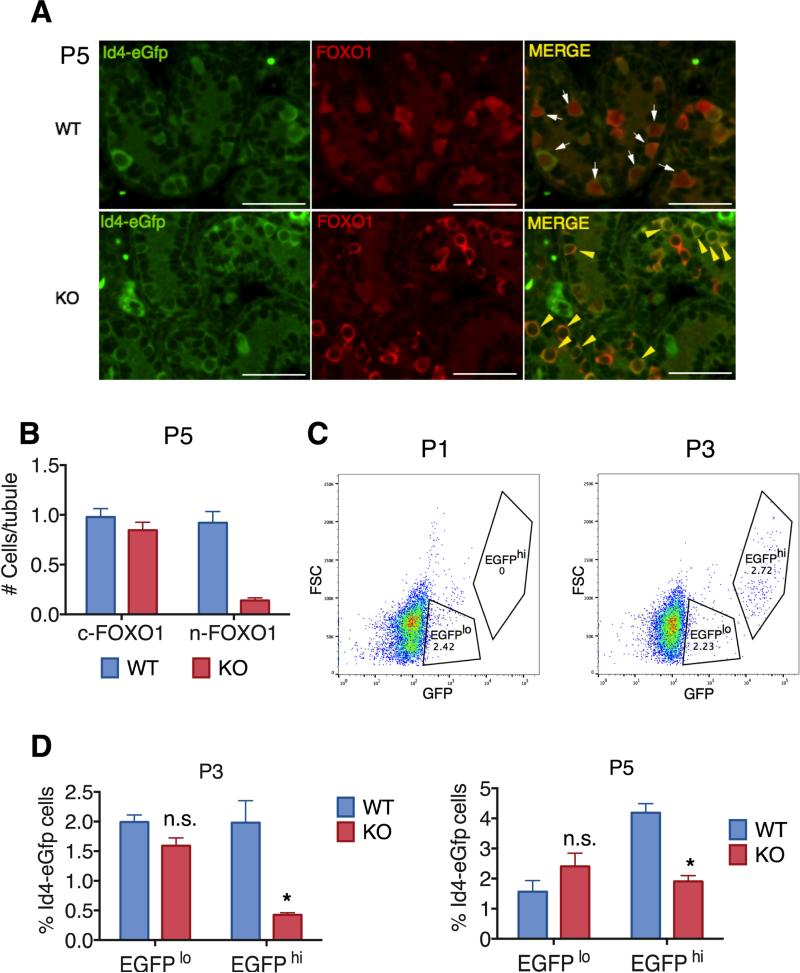
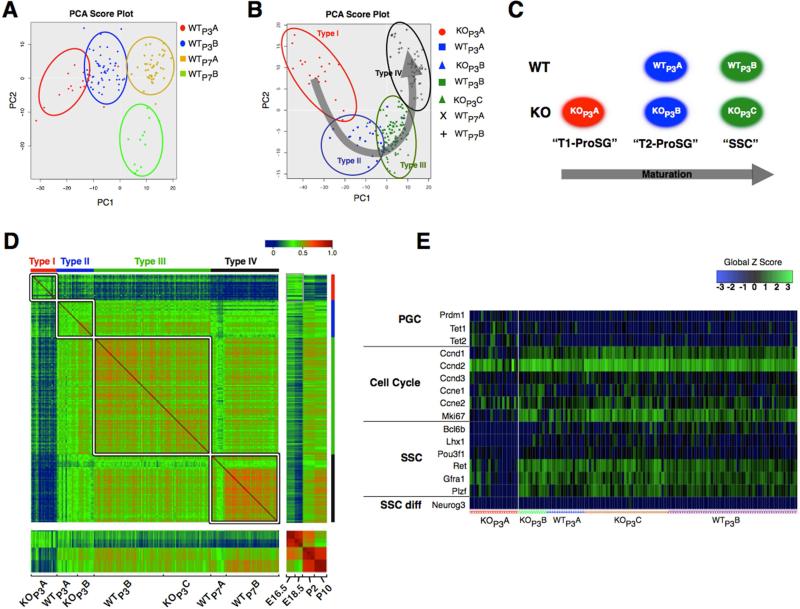
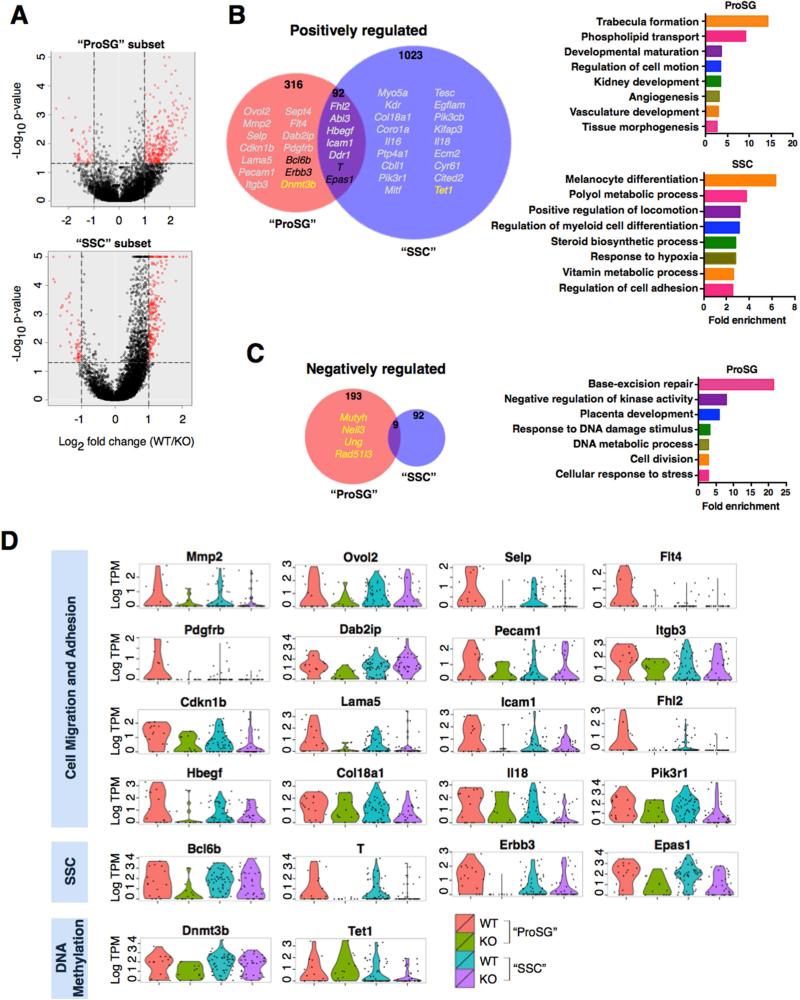
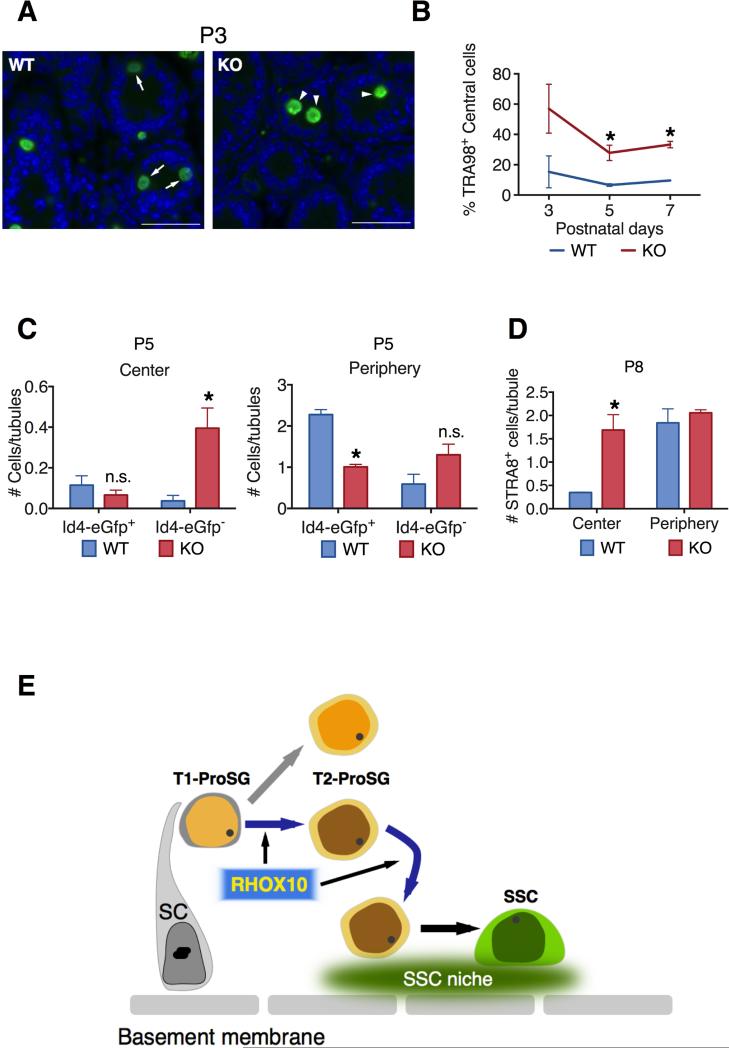
The developmental origins of most adult stem cells are poorly understood. Here, we report the identification of a transcription factor-RHOX10-critical for the initial establishment of spermatogonial stem cells (SSCs). Conditional loss of the entire 33-gene X-linked homeobox gene cluster that includes Rhox10 causes progressive spermatogenic decline, a phenotype indistinguishable from that caused by loss of only Rhox10. We demonstrate that this phenotype results from dramatically reduced SSC generation. By using a battery of approaches, including single-cell-RNA sequencing (scRNA-seq) analysis, we show that Rhox10 drives SSC generation by promoting pro-spermatogonia differentiation. Rhox10 also regulates batteries of migration genes and promotes the migration of pro-spermatogonia into the SSC niche. The identification of an X-linked homeobox gene that drives the initial generation of SSCs has implications for the evolution of X-linked gene clusters and sheds light on regulatory mechanisms influencing adult stem cell generation in general.

Keywords: Rhox; germ cell; germ line stem cell; gonocytes; homeobox; prospermatogonia; spermatogenesis; spermatogonia; spermatogonial stem cells; transcription factor.


Figures

Figure 1
Figure 1. Loss of the Rhox Cluster Causes Progressive Spermatogenic Decline
(A) Male germ cell development in normal and SSC-deficient mice. A SSC defect causes a progressive decline in spermatogenesis because the first wave of spermatogenesis is SSC independent. PGCs, primordial germ cells; ProSG, prospermatogonia; SSCs, spermatogonial stem cells; Diff SPG, differentiating spermatogonia. (B) Strategy to conditionally delete the entire Rhox cluster: insertion of loxP sites (yellow arrows) at the beginning and end of the ~920-kb Rhox cluster (see Figure S1A for exact location of loxP sites). (C) Hematoxylin and eosin staining of testes sections from Rhox-c-KO (labeled “KO”), Rhox-c fl/y;Vasa-Cre (labeled “GC-KO”), and control (WT) mice. Upper and lower rows are from 8- and 16-to-46-week-old mice, respectively. Scale bars = 100 μm. (D) qRT-PCR analysis demonstrating selective defect in expression of germ cell-expressed Rhox genes in testes from 8 week-old Rhox-c fl/y;Vasa-Cre mice (GC-KO) relative to WT mice. Values were normalized to Rpl19 mRNA level and denote the mean fold change ± standard error of the mean (SEM). Asterisks indicate the difference is statistically significant (P<0.05). (E) Testis weight of Rhox-c-KO (KO), Rhox-c fl/y; Vasa-Cre (GC-KO), and WT mice of the indicated ages. (F) Epididymal sperm count of Rhox-c-KO (KO), Rhox-c fl/y; Vasa-Cre (GC-KO), and WT mice of the indicated ages. (G) Fertility analysis of adult male Rhox-c fl/y;Vasa-Cre (GC-KO) and WT mice, each housed with two BL6 female mice (initially 8-weeks old) for 4 months. Values denote the mean ± standard error of the mean (SEM). Asterisks indicate that the difference is statistically significant (P<0.05). (H) Quantification of FOXO1-positive spermatogonia in testes from 8 week-old Rhox-c fl/y;Vasa-Cre (GC-KO) and WT mice (n=3 per genotype). All values are mean ± SEM. See also Figure S1
Figure 2
Figure 2. Loss of Rhox10 Causes Progressive Spermatogenic Decline
(A) Strategy to conditionally mutate Rhox10. LoxP sites were inserted on either side of exon 2, which encodes a critical part of the RHOX10 homeodomain. (B) qRT-PCR analysis of Rhox10-KO (KO) and WT littermate control mice. Nanos2 is a germ cell marker. Values were normalized to Rpl19 mRNA level and denote the mean fold change ± standard error of the mean (SEM). (C) Testis weight (left) and epididymal sperm count (right) of Rhox10-KO, Rhox-c-KO and control (WT) mice of the indicated ages. (D) Hematoxylin and eosin staining of representative testis sections from Rhox10-KO (KO) and control (WT) mice of the indicated ages. Scale bars =100 μm. (E) Quantification of percentage of seminiferous tubule sections without early germ cells or without any detectable germ cells (Sertoli cell only [SCO]) in testes sections from Rhox10-KO mice of the indicated ages. Littermate control mice at all ages had <5% abnormal tubules. Values denote the mean % tubules ± standard error of the mean (SEM). n=2-4, 50-100 tubules per each sections were counted. (F) Seminiferous tubule abnormalities in 12 week-old Rhox10-KO (KO) and littermate control (WT) mice. spc, spermatocytes; pa spc, pachytene spermatocytes; R st, round spermatids; E st, elongating spermatids. See also Figure S2
Figure 3
Figure 3. Loss of Rhox10 Causes SSC Defects
(A) Representative image of whole mount staining of 6 month-old adult mice seminiferous tubules with GFRα1 antibody. As, Apr and Aal4 cells are positively stained with the GFRα1 antibody. (B) Quantification of GFRα1+ spermatogonia in testes from 6- to 10-month-old Rhox10-KO and littermate control (WT) mice (n=4-5 per genotype). All values are mean ± SEM. Asterisks indicate differences that are statistically significant (P<0.05). (C) Germ cell transplantation analysis. Donor-derived colonies in recipient testes were counted and normalized to 105 cells injected per testis 3 month after transplantation of testicular cells from P7-8 Rhox10-KO (Rhox10−/y;Ubc-Gfp) mice (n=4) and littermate control (WT) (Rhox10+/y;Ubc-Gfp) mice (n=5). (D) Germ (TRA98+) cells per tubule in testes sections from Rhox10-KO and littermate control (WT) mice of the indicated ages (n=1-4, each time point). (E) Cell cycle analysis of either total testicular cells or Id4-eGfp+ cells from P5 Rhox10-KO and littermate control (WT) mice (n=5). (F) Flow cytometric analysis of Annexin V+ cells (among total, Id4-eGfp+ or Id4-eGfphigh testicular cells) from P5 Rhox10-KO mice (n=6) and littermate control (WT) mice (n=9). (G) Quantification of STRA8+ cells in testes sections from Rhox10-KO and littermate control (WT) mice of the ages indicated (n=2-5, each time point). All values are mean ± SEM. See also figure S3
Figure 4
Figure 4. Rhox10 Promotes ProSG-to-SSC Progression
(A) Representative images of testes sections from P5 Rhox10-KO (Rhox10−/y;Id4-eGfp) mice and littermate control (Rhox10+/y;Id4-eGfp) mice stained for the indicated markers. Mice with the same genotype were used for panels B-D. Scale bars = 60 μm. (B) Quantification of cytoplasmic c-FOXO1+/Id4-eGfp+ and nuclear n-FOXO1+/Id4-eGfp+ cells in testes sections from P5 Rhox10-KO mice (n=3) and littermate control (WT) mice (n=2). (C) Flow cytometric analysis of GFP intensity (x-axis) and forward scatter (size, y-axis) of testicular cells from P1 and P3 Id4-eGfp WT mice. Cells were judged as exhibiting high (hi) or low (lo) expression of EGFP. (D) Id4-eGfp+ cell populations identified by FACS (analyzed as in panel C) derived from P3 (n=3) and P5 (n=6-8) Rhox10-KO mice and littermate control (WT) mice. All values are mean ± SEM. Asterisks indicate statistically significant differences (P<0.05). See also Figure S4
Figure 5
Figure 5. Single-Cell RNAseq Analysis of Id4-eGfp+ Cell Subsets
(A) PCA of Id4-eGfp+ cells from P3 and P7 WT Id4-eGfp mice, analyzed by SC-RNAseq, using the 1009 most differentially expressed genes. (B) PCA-defined Id4-eGfp+ cell clusters containing cells from P3 Rhox10-KO (Rhox10−/y; Id4-eGfp) and littermate control (Rhox10+/y; Id4-eGfp) mice. The four clusters (Type I through Type IV) were defined based on the gene expression profiles described in panel A. The arrow represents the direction of germ cell maturation. (C) The P3 Id4-eGfp+ cell subsets are enriched in the indicated cell subsets, based on the evidence described in the text. (D) Pairwise correlations of gene expression profiles of purified germ cells from the time points indicated (Pastor et al., 2014) and the single cells from our study. The genes examined were the 1009 differentially expressed genes described in panel A. (E) Expression of the indicated genes in individual Id4-eGfp+ cells. Of note, neither KOP3A cells nor any of the other P3 Id4-eGfp-positive cell subsets expressed the SSC progenitor marker, Neurog3. See also Figure S5 and Tables S1-S3.
Figure 6
Figure 6. Rhox10-Regulated Genes in Germ Cell Subsets
(A) SC-RNAseq coupled with SCDE analysis was used to identify genes differentially expressed in the “ProSG subset” (KOP3B vs. WTP3A; left) and “SSC subset” (KOP3C vs. WTP3B; right), as defined in Figure 5. Red points are genes >2-fold differentially expressed (P<0.05). (B-C) (Left) Selected Rhox10-regulated genes (defined in panel A) are indicated with different colors: grey, Cell migration and adhesion; black, SSC genes; yellow, DNA methylation (>2 fold, P<0.05). Note that “Positively regulated” refers to genes upregulated by Rhox10 (i.e., downregulated in Rhox10-KO cells) and “Negatively regulated” refers to the converse. (Right) Selected highly enriched GO categories are shown (>2.5 fold enrichment, P<0.02). Note that there is no significantly enriched GO category for Rhox10-negatively regulated genes in the SSC subset. (D) The level of RHOX10-positively regulated genes in single cells in the “ProSG” and “SSC” subsets. See also Figure S6 and Table S4
Figure 7
Figure 7. Evidence that Rhox10 Promotes ProSG Migration into the SSC Niche
(A) Representative images of germ cells (stained with TRA98) in testes cross-sections from P3 Rhox10-KO mice and littermate control (WT) mice. Arrows, cells located in the periphery; Arrow heads, cells located in the center. Scale bars = 20 μm. (B) Percentage of TRA98+ germ cells located in the center of seminiferous tubules as compared to total TRA98+ germ cells in Rhox10-KO mice and littermate control (WT) mice of the indicated age (n= 2-5 each time point). All values are mean ± SEM. Asterisks indicate statistically significant differences (P<0.05). (C) Quantification of FOXO1+ cells co-stained for Id4-eGfp located in the center (Left) or periphery (Right) of seminiferous tubules in P5 Rhox10-KO mice (n=3) and littermate control (WT) mice (n=2). All values are mean ± SEM. Asterisks indicate statistically significant differences (P<0.05). (D) Quantification of STRA8+ cells (differentiating A-spermatogonia) located in the center or periphery of seminiferous tubules in P8 Rhox10-KO mice and littermate control (WT) mice (n=2). All values are mean ± SEM. Asterisks indicate statistically significant differences (P<0.05). (E) Model: Rhox10 promotes ProSG progression into SSCs. The model posits that Rhox10 drives both the T1-ProSG-to-T2-ProSG differentiation step and the ProSG migration step, which temporal studies suggest may occur simultaneously. Depicted are two kinds of T2-ProSG, each with a different fate, a possibility that is consistent with published studies (Kluin and de Rooij, 1981; Murphey et al., 2013), but has not been directly demonstrated. SC, Sertoli cell. See also Figure S7.

Comment in

References

    1. Almenara A, Escalante G, Gazzo E, Gonzales GF. Transillumination to evaluate spermatogenesis: effect of testosterone enanthate in adult male rats. Arch. Androl. 2001;46:21–27. - PubMed
    1. Aloisio GM, Nakada Y, Saatcioglu HD, Peña CG, Baker MD, Tarnawa ED, Mukherjee J, Manjunath H, Bugde A, Sengupta AL, et al. PAX7 expression defines germline stem cells in the adult testis. J. Clin. Invest. 2014;124:3929–3944. - PMC - PubMed
    1. Aramaki S, Hayashi K, Kurimoto K, Ohta H, Yabuta Y, Iwanari H, Mochizuki Y, Hamakubo T, Kato Y, Shirahige K, et al. A mesodermal factor, T, specifies mouse germ cell fate by directly activating germline determinants. Dev. Cell. 2013;27:516–529. - PubMed
    1. Basciani S, De Luca G, Dolci S, Brama M, Arizzi M, Mariani S, Rosano G, Spera G, Gnessi L. Platelet-derived growth factor receptor beta-subtype regulates proliferation and migration of gonocytes. Endocrinology. 2008;149:6226–6235. - PubMed
    1. Breen EC. VEGF in biological control. J. Cell. Biochem. 2007;102:1358–1367. - PubMed

Publication types