

New Algorithm and Software (BNOmics) for Inferring and Visualizing Bayesian Networks from Heterogeneous Big Biological and Genetic Data
- PMID: 27681505
- PMCID: PMC5372779
- DOI: 10.1089/cmb.2016.0100
New Algorithm and Software (BNOmics) for Inferring and Visualizing Bayesian Networks from Heterogeneous Big Biological and Genetic Data
Abstract
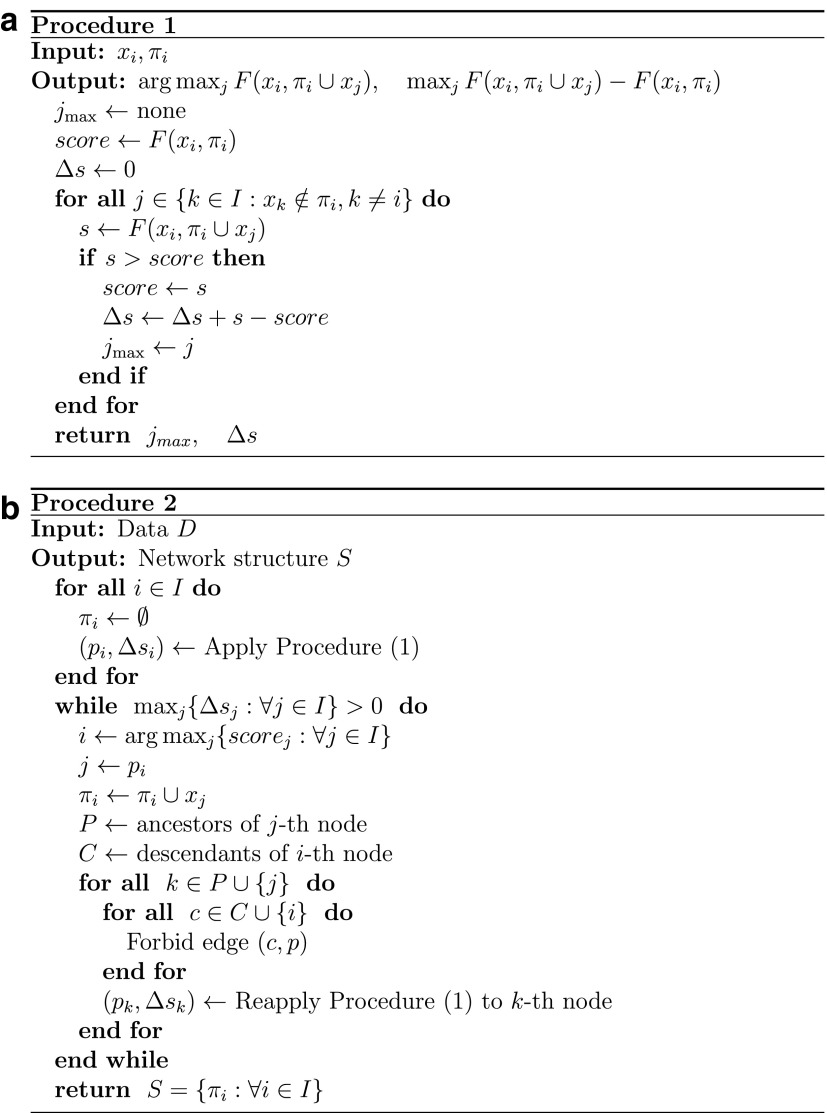
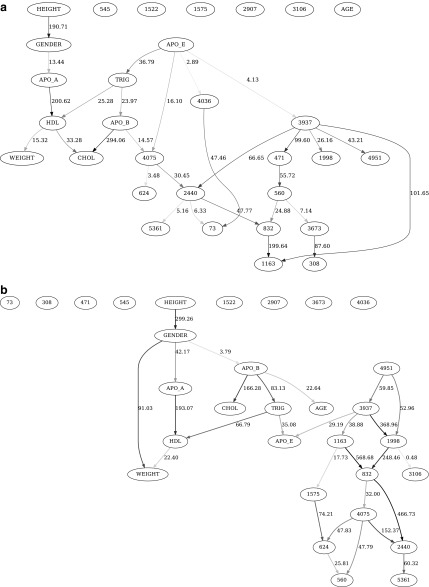
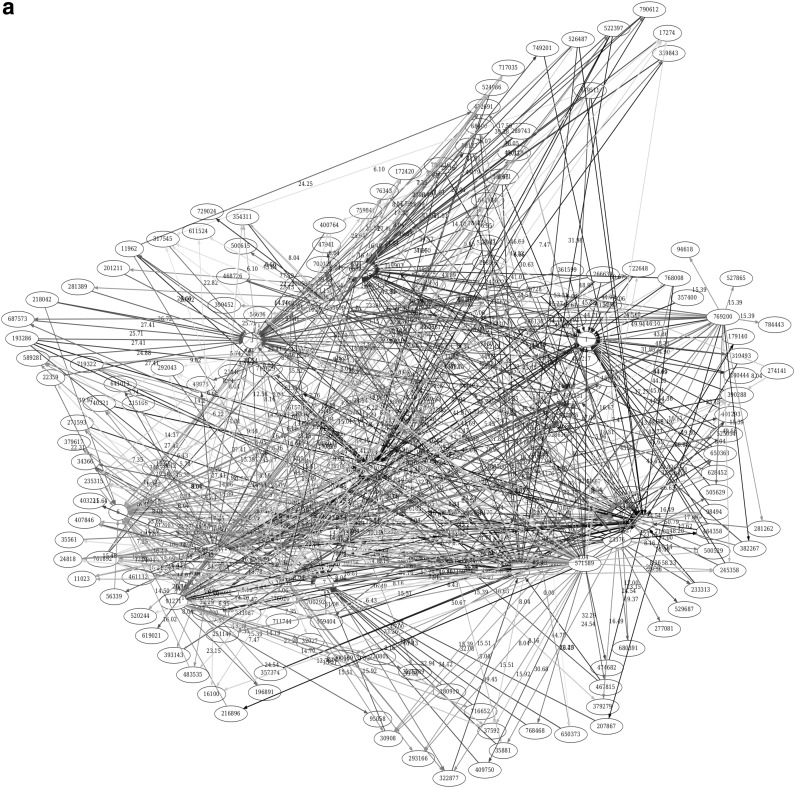
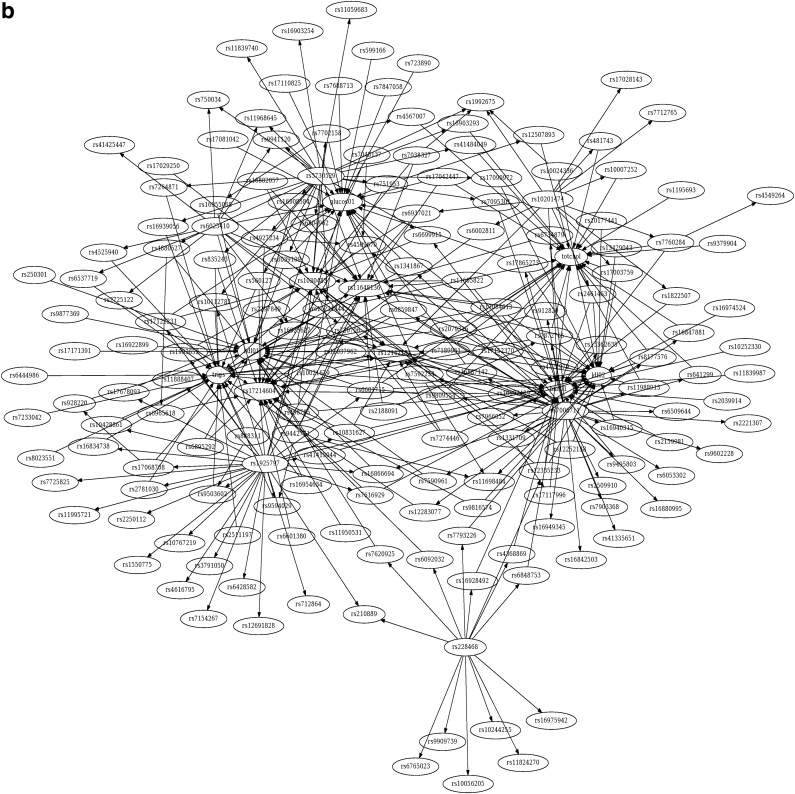
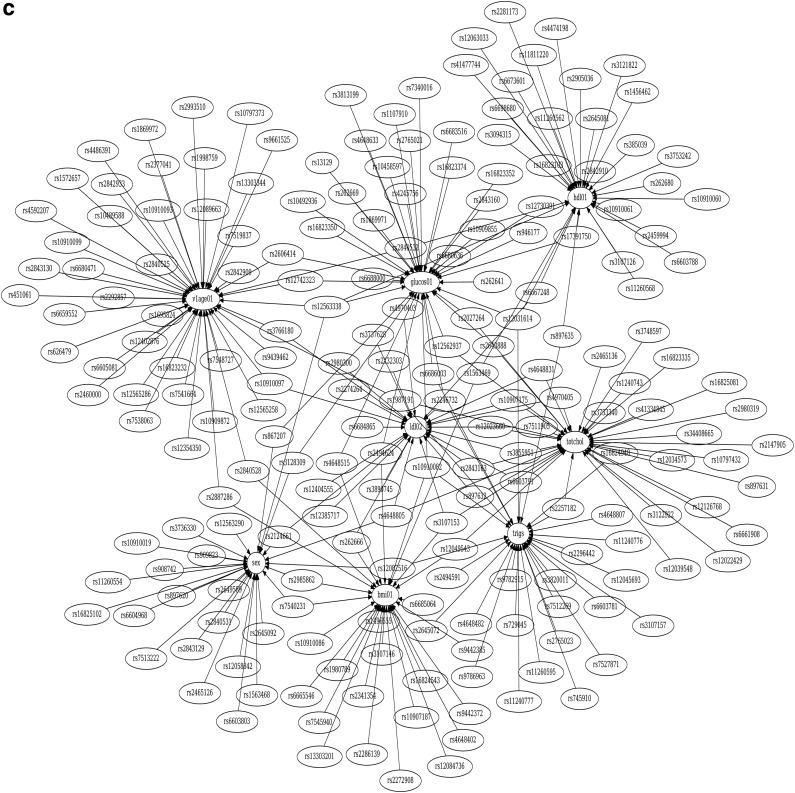
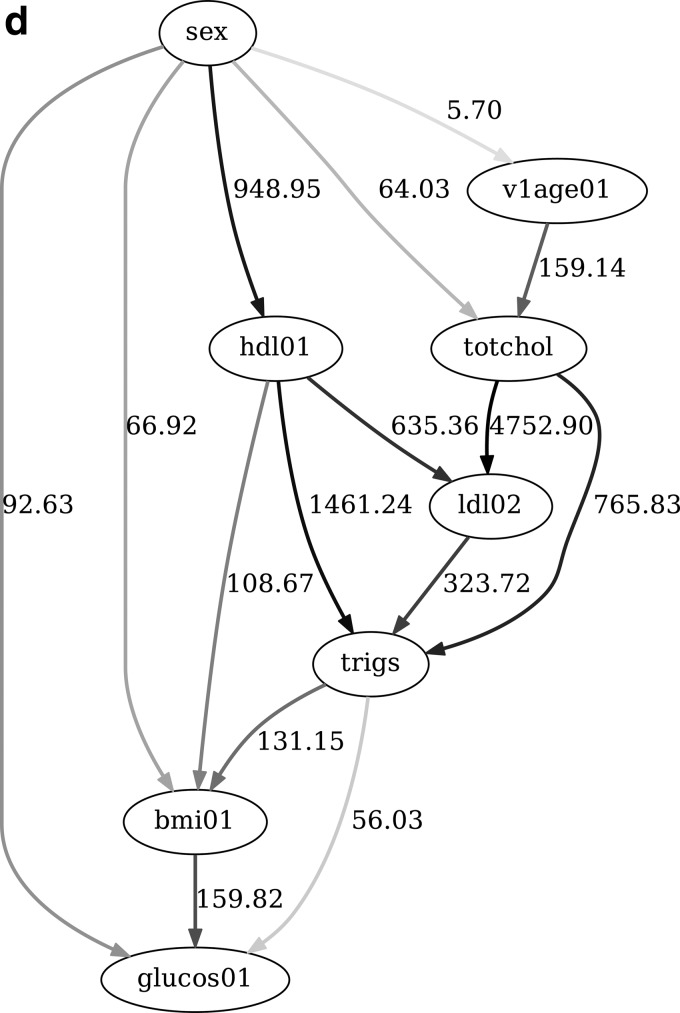
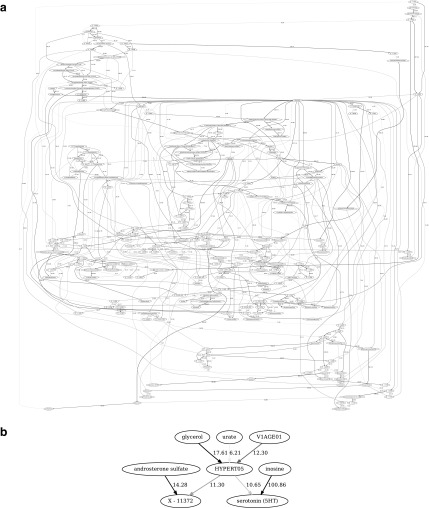
Bayesian network (BN) reconstruction is a prototypical systems biology data analysis approach that has been successfully used to reverse engineer and model networks reflecting different layers of biological organization (ranging from genetic to epigenetic to cellular pathway to metabolomic). It is especially relevant in the context of modern (ongoing and prospective) studies that generate heterogeneous high-throughput omics datasets. However, there are both theoretical and practical obstacles to the seamless application of BN modeling to such big data, including computational inefficiency of optimal BN structure search algorithms, ambiguity in data discretization, mixing data types, imputation and validation, and, in general, limited scalability in both reconstruction and visualization of BNs. To overcome these and other obstacles, we present BNOmics, an improved algorithm and software toolkit for inferring and analyzing BNs from omics datasets. BNOmics aims at comprehensive systems biology-type data exploration, including both generating new biological hypothesis and testing and validating the existing ones. Novel aspects of the algorithm center around increasing scalability and applicability to varying data types (with different explicit and implicit distributional assumptions) within the same analysis framework. An output and visualization interface to widely available graph-rendering software is also included. Three diverse applications are detailed. BNOmics was originally developed in the context of genetic epidemiology data and is being continuously optimized to keep pace with the ever-increasing inflow of available large-scale omics datasets. As such, the software scalability and usability on the less than exotic computer hardware are a priority, as well as the applicability of the algorithm and software to the heterogeneous datasets containing many data types-single-nucleotide polymorphisms and other genetic/epigenetic/transcriptome variables, metabolite levels, epidemiological variables, endpoints, and phenotypes, etc.
Keywords: Bayesian network(s); big data; omic data; systems biology.
Conflict of interest statement
No competing financial interests exist.
Figures
Similar articles
-
Inferring cellular regulatory networks with Bayesian model averaging for linear regression (BMALR).Mol Biosyst. 2014 Aug;10(8):2023-30. doi: 10.1039/c4mb00053f. Mol Biosyst. 2014. PMID: 24899235
-
A hybrid Bayesian network learning method for constructing gene networks.Comput Biol Chem. 2007 Oct;31(5-6):361-72. doi: 10.1016/j.compbiolchem.2007.08.005. Epub 2007 Aug 19. Comput Biol Chem. 2007. PMID: 17889617
-
H-CORE: enabling genome-scale Bayesian analysis of biological systems without prior knowledge.Biosystems. 2007 Jul-Aug;90(1):197-210. doi: 10.1016/j.biosystems.2006.08.004. Epub 2006 Aug 22. Biosystems. 2007. PMID: 17005318
-
Causal Queries from Observational Data in Biological Systems via Bayesian Networks: An Empirical Study in Small Networks.Methods Mol Biol. 2019;1883:111-142. doi: 10.1007/978-1-4939-8882-2_5. Methods Mol Biol. 2019. PMID: 30547398 Review.
-
Bayesian Computation Methods for Inferring Regulatory Network Models Using Biomedical Data.Adv Exp Med Biol. 2016;939:289-307. doi: 10.1007/978-981-10-1503-8_12. Adv Exp Med Biol. 2016. PMID: 27807752 Review.
Cited by
-
Dissecting Response to Cancer Immunotherapy by Applying Bayesian Network Analysis to Flow Cytometry Data.Int J Mol Sci. 2021 Feb 26;22(5):2316. doi: 10.3390/ijms22052316. Int J Mol Sci. 2021. PMID: 33652558 Free PMC article.
-
Analysis of high-resolution 3D intrachromosomal interactions aided by Bayesian network modeling.Proc Natl Acad Sci U S A. 2017 Nov 28;114(48):E10359-E10368. doi: 10.1073/pnas.1620425114. Epub 2017 Nov 13. Proc Natl Acad Sci U S A. 2017. PMID: 29133398 Free PMC article.
-
Bow-tie architectures in biological and artificial neural networks: Implications for network evolution and assay design.iScience. 2023 Jan 25;26(2):106041. doi: 10.1016/j.isci.2023.106041. eCollection 2023 Feb 17. iScience. 2023. PMID: 36818303 Free PMC article.
-
The Human Brainome: changes in expression of VGF, SPECC1L, HLA-DRA and RANBP3L act with APOE E4 to alter risk for late onset Alzheimer's disease.Res Sq [Preprint]. 2023 Dec 14:rs.3.rs-3678057. doi: 10.21203/rs.3.rs-3678057/v1. Res Sq. 2023. Update in: Sci Rep. 2024 Jun 28;14(1):14954. doi: 10.1038/s41598-024-65010-7. PMID: 38168398 Free PMC article. Updated. Preprint.
-
Identifying large-scale interaction atlases using probabilistic graphs and external knowledge.J Clin Transl Sci. 2022 Feb 11;6(1):e27. doi: 10.1017/cts.2022.18. eCollection 2022. J Clin Transl Sci. 2022. PMID: 35321220 Free PMC article.
References
-
- Akaike H. 1974. A new look at the statistical identification problem. IEEE Trans. Auto. Control 19, 716–723
-
- ARIC Investigators. 1989. The Atherosclerosis Risk in Communities (ARIC) study: Design and objectives. Am. J. Epidemiol. 129, 687–702 - PubMed
-
- Beinlich I.A., Suermondt H.J., Chavez R.M., et al. . 1989. The ALARM monitoring system: A case study with two probablistic inference techniques for belief networks. Second European Conference on Artificial Intelligence in Medicine, London, 38, 247–256
-
- Chickering D.M., Heckerman D., and Meek C. 2004. Large-sample learning of Bayesian networks is NP-hard. J. Mach. Learn. Res. 5, 1278–1330
MeSH terms
LinkOut - more resources
Full Text Sources
Other Literature Sources
Research Materials