. 2016 Nov 25;291(48):24900-24911.
doi: 10.1074/jbc.M116.725895. Epub 2016 Sep 28.

Heparin Binds Lamprey Angiotensinogen and Promotes Thrombin Inhibition through a Template Mechanism

Affiliations

Heparin Binds Lamprey Angiotensinogen and Promotes Thrombin Inhibition through a Template Mechanism

Hudie Wei et al. J Biol Chem. .

Abstract

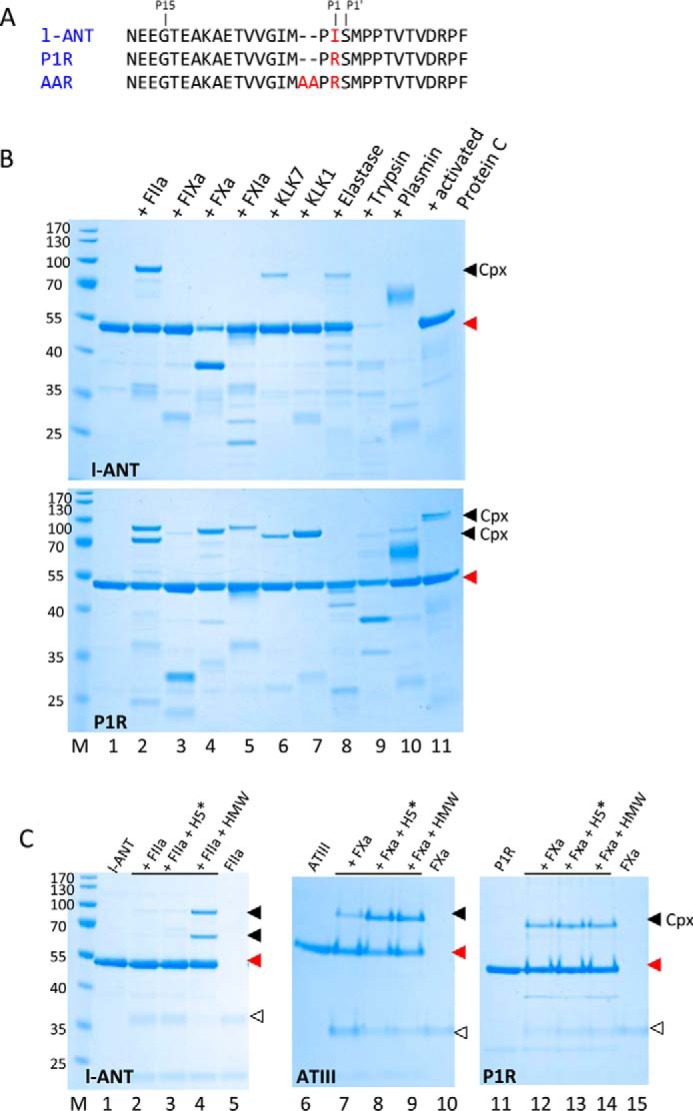
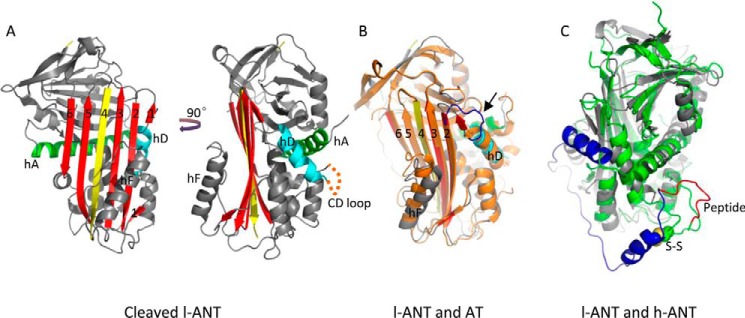
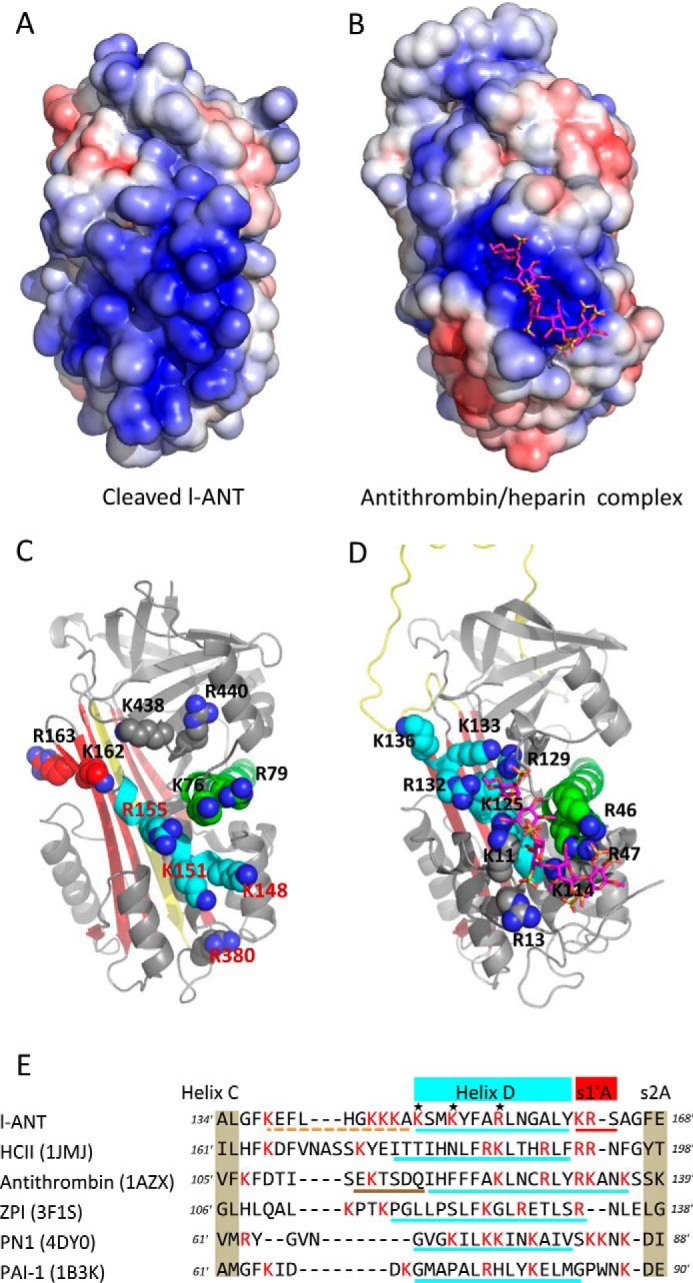
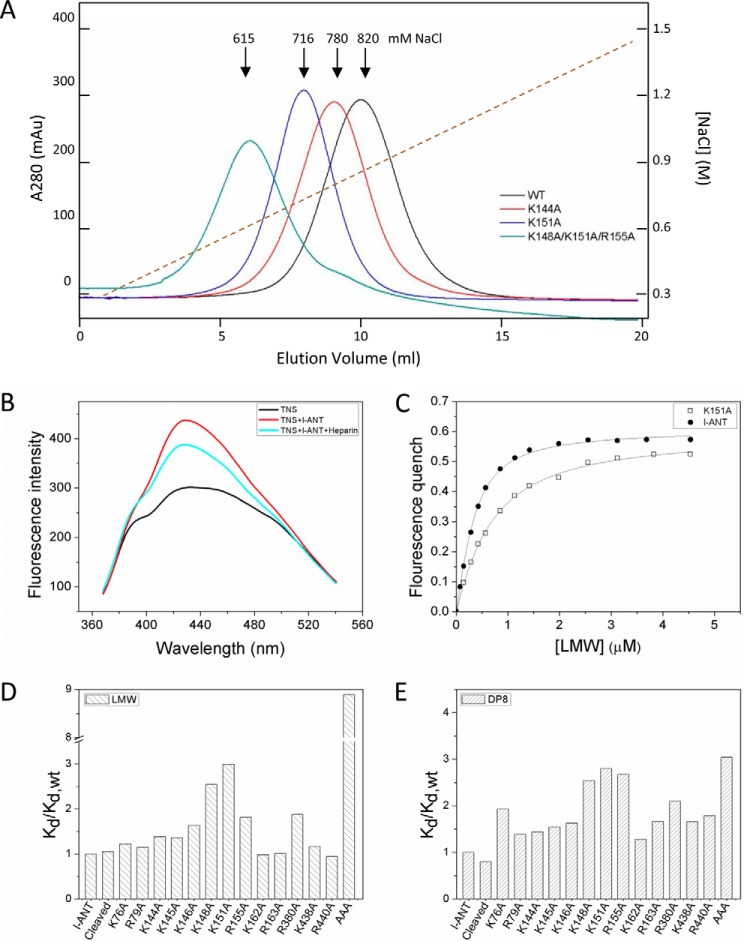
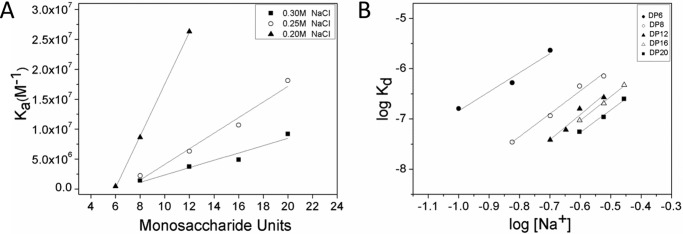
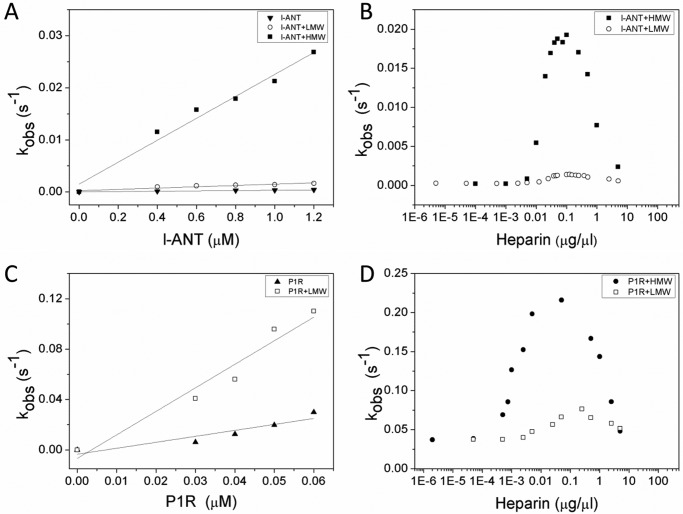
Lamprey angiotensinogen (l-ANT) is a hormone carrier in the regulation of blood pressure, but it is also a heparin-dependent thrombin inhibitor in lamprey blood coagulation system. The detailed mechanisms on how angiotensin is carried by l-ANT and how heparin binds l-ANT and mediates thrombin inhibition are unclear. Here we have solved the crystal structure of cleaved l-ANT at 2.7 Å resolution and characterized its properties in heparin binding and protease inhibition. The structure reveals that l-ANT has a conserved serpin fold with a labile N-terminal angiotensin peptide and undergoes a typical stressed-to-relaxed conformational change when the reactive center loop is cleaved. Heparin binds l-ANT tightly with a dissociation constant of ∼10 nm involving ∼8 monosaccharides and ∼6 ionic interactions. The heparin binding site is located in an extensive positively charged surface area around helix D involving residues Lys-148, Lys-151, Arg-155, and Arg-380. Although l-ANT by itself is a poor thrombin inhibitor with a second order rate constant of 500 m-1 s-1, its interaction with thrombin is accelerated 90-fold by high molecular weight heparin following a bell-shaped dose-dependent curve. Short heparin chains of 6-20 monosaccharide units are insufficient to promote thrombin inhibition. Furthermore, an l-ANT mutant with the P1 Ile mutated to Arg inhibits thrombin nearly 1500-fold faster than the wild type, which is further accelerated by high molecular weight heparin. Taken together, these results suggest that heparin binds l-ANT at a conserved heparin binding site around helix D and promotes the interaction between l-ANT and thrombin through a template mechanism conserved in vertebrates.

Keywords: angiotensinogen; crystal structure; heparin; hypertension; serpin; thrombin.


Figures

FIGURE 1.
FIGURE 1.
Inhibition of proteases by l-ANT variants. A, RCL sequence of l-ANT variants. B, protease inhibition by wild type l-ANT (top) or P1R (bottom). 2 μg of l-ANT or P1R were incubated with 0.5 μg of serine protease for 15 min at room temperature in 20 μl of PBS. Lane M, molecular weight marker; lane 1, l-ANT variants; lanes 2–11, l-ANT or P1R interacts with human α-thrombin (factor IIa), factor IXa, factor Xa, factor XIa, KLK7, KLK1, elastase, trypsin, plasmin, and activated protein C, respectively. C, effect of heparin on protease inhibition by l-ANT or antithrombin (ATIII). 0.5 μg of protease was incubated with 2 μg of l-ANT or P1R variant or antithrombin for 5 min in the absence or presence of HMW heparin or H5*. All samples were analyzed by reducing SDS-PAGE and stained by Coomassie Blue. The filled triangles show the positions of serpin·protease complexes (cpx), red triangles show the positions of native serpins, and open triangles show proteases.
FIGURE 2.
FIGURE 2.
Overall structure of cleaved l-ANT. A, the structure of cleaved l-ANT exhibits a very typical serpin fold. The RCL (yellow) cleaved by human α-thrombin is completely inserted into central β-sheet A (red) as a middle strand. A seventh chain of β-sheet A (termed s1′A here) is seen above helix D (cyan), composed of residues 162–164. The N-terminal residues 1–72 and residues 138–147 between helix C and helix D (indicated with an orange dashed line) are not built into the structure because of poor electron density. Helix A is shown in green. B, overlaid structures of l-ANT and latent antithrombin (AT) (orange, PDB code 1AZX) indicate a large shift in helix F position and a different conformation of the connecting loop (blue) on top of helix D in antithrombin. C, overlaid structures of l-ANT (gray) and human angiotensinogen (h-ANT) (green, PDB code 2WXW). The N-terminal fragment of human angiotensinogen is shown in blue, and the hormone peptide is shown in red. The Cys-18–Cys-138 disulfide bond of human angiotensinogen is shown as spheres.
FIGURE 3.
FIGURE 3.
The heparin binding site near helix D. Surface electrostatic analysis shows that l-ANT (A) has a larger positively charged area than that seen in the native antithrombin·heparin complex structure (B) (PDB code 1AZX). All of the positively charged residues in this region are shown as spheres in C (l-ANT) and D (antithrombin), with these two structures shown as schematics with the same orientation. The RCL is colored in yellow, β-sheet A in red, helix A in green, and helix D in cyan. Heparin is shown as magenta sticks. E, sequence alignment of residues between helix C and strand 2A based on the structures of heparin-binding serpins (HCII, antithrombin, ZPI, PN1, and PAI-1). All of the Lys and Arg residues are colored in red. The residues of helix D are underlined in cyan with the CD loop of l-ANT indicated by an orange dashed line and helix P of antithrombin indicated by a brown dashed line.
FIGURE 4.
FIGURE 4.
Identification of heparin binding site. A, heparin column affinity of l-ANT variants. l-ANT variants were loaded onto a 1-ml heparin column and eluted with a 20-column volume (x axis) with a gradient of 0.3–1.5 m NaCl (right y axis, brown dashed line). The left y axis shows the absorption value at 280-nm wavelength. Wild type l-ANT (black line) is eluted at 820 mm NaCl. Variants K144A (red line) and K151A (blue line) are eluted at about 780 mm NaCl and 716 mm NaCl, respectively. The variant K148A/K151A/R155A (termed AAA, green line) is eluted at about 615 mm NaCl. The exact values of NaCl concentrations in elution peaks are listed in Table 2. B, fluorescence spectrum of TNS. The fluorescence spectrum of 5 μm TNS alone is given as a black line. The TNS fluorescence intensity increases with the addition of 0.3 μm l-ANT (red line) and decreases in response to the addition of 0.1 μm LMW heparin (cyan line). C, dissociation constants are non-linearly fitted by Equation 1 as described under “Experimental Procedures.” All titrations were performed in solutions containing 5–10 μm TNS in 50 mm Tris-HCl, pH 7.4, 20% glycerol, 0.1% PEG 8000. The ionic strengths were adjusted by adding NaCl. Filled circles, wild type l-ANT; open circles, K151A. D and E, column diagram of the relative dissociation constant values (Kd/Kd,wt) of the variants binding to LMW heparin (D) or 8-monosaccharide heparin (DP8) (E). The exact values are listed in Table 2.
FIGURE 5.
FIGURE 5.
Heparin-binding properties of l-ANT. A, effect of chain length on heparin affinity of l-ANT was determined by a linear fit using Equation 1/Kd = 1/Kd, int × (N - L + 1). The x intercept of the linear plot gives the minimal heparin length L (x intercept + 1) at NaCl concentrations of 0.2 m (filled triangles), 0.25 m (open circles), and 0.3 m (filled squares), respectively. B, the effect of ionic strength on heparin affinity of l-ANT was determined by a linear fitting using the equation, log Kd = log KNI + ZΨlog [Na+]. The ionic interaction (Z) was calculated from the slope for DP6 (filled circles), DP8 (open circles), DP12 (filled triangles), DP16 (open triangles), and DP20 (filled squares). The apparent strength of the nonionic interactions (KNI) was determined from the y intercept. The detailed values are listed in Table 3.
FIGURE 6.
FIGURE 6.
Effect of heparin on thrombin inhibition by l-ANT. Shown are the discontinuous measurements for the rates of thrombin inhibition by wild type l-ANT (A) or P1R (C) without or with 0.1 μg/μl LMW or HMW heparin. The apparent second rate constants (kapp) were determined from the slope of the plot of kobs versus inhibitor concentrations, which are listed in Table 4. Apparent first order rate constants (kobs) for wild type (B) or P1R (D) were measured with LMW or HMW heparin ranging from 10−5 to 10 μg/μl under pseudo-first-order conditions containing 5 nm thrombin and 1.0 μm l-ANT or 0.05 μm P1R in PBS with 0.1 mg/ml BSA and 0.1% PEG 8000. The kobs values were obtained from the slope of semilog plots of residual enzyme activity measured from initial velocities of S-2238 hydrolysis (A405/min) versus time. Filled inverted triangles, l-ANT; open circles, l-ANT + LMW; filled squares, l-ANT + HMW; filled triangles, P1R; open squares, P1R + LMW; filled circles, P1R + HMW.

References

    1. Kumar A. (2015) Bayesian phylogeny analysis of vertebrate serpins illustrates evolutionary conservation of the intron and indels based six groups classification system from lampreys for approximately 500 MY. PeerJ 3, e1026. - PMC - PubMed
    1. Wong M. K., and Takei Y. (2011) Characterization of a native angiotensin from an anciently diverged serine protease inhibitor in lamprey. J. Endocrinol. 209, 127–137 - PubMed
    1. Fournier D., Luft F. C., Bader M., Ganten D., and Andrade-Navarro M. A. (2012) Emergence and evolution of the renin-angiotensin-aldosterone system. J. Mol. Med. 90, 495–508 - PMC - PubMed
    1. Atlas S. A. (2007) The renin-angiotensin aldosterone system: pathophysiological role and pharmacologic inhibition. J. Manag. Care Pharm. 13, 9–20 - PMC - PubMed
    1. Khakoo A. Y., Sidman R. L., Pasqualini R., and Arap W. (2008) Does the renin-angiotensin system participate in regulation of human vasculogenesis and angiogenesis? Cancer Res. 68, 9112–9115 - PubMed