. 2016 Oct 11;113(41):E6209-E6218.
doi: 10.1073/pnas.1605964113. Epub 2016 Sep 28.

Mutant PFN1 causes ALS phenotypes and progressive motor neuron degeneration in mice by a gain of toxicity

Affiliations

Mutant PFN1 causes ALS phenotypes and progressive motor neuron degeneration in mice by a gain of toxicity

Chunxing Yang et al. Proc Natl Acad Sci U S A. .

Abstract

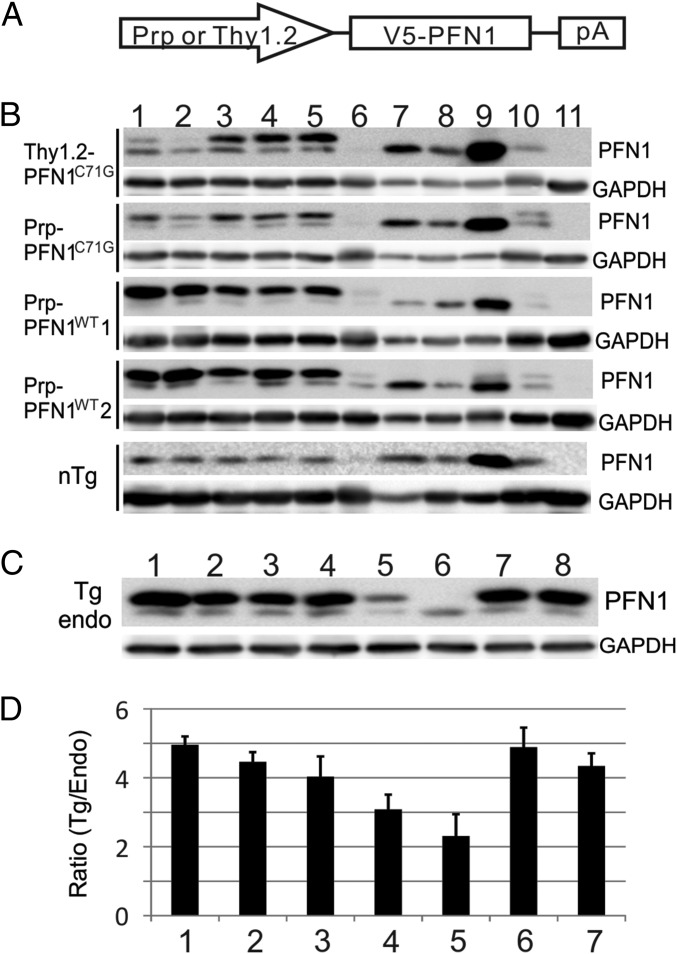
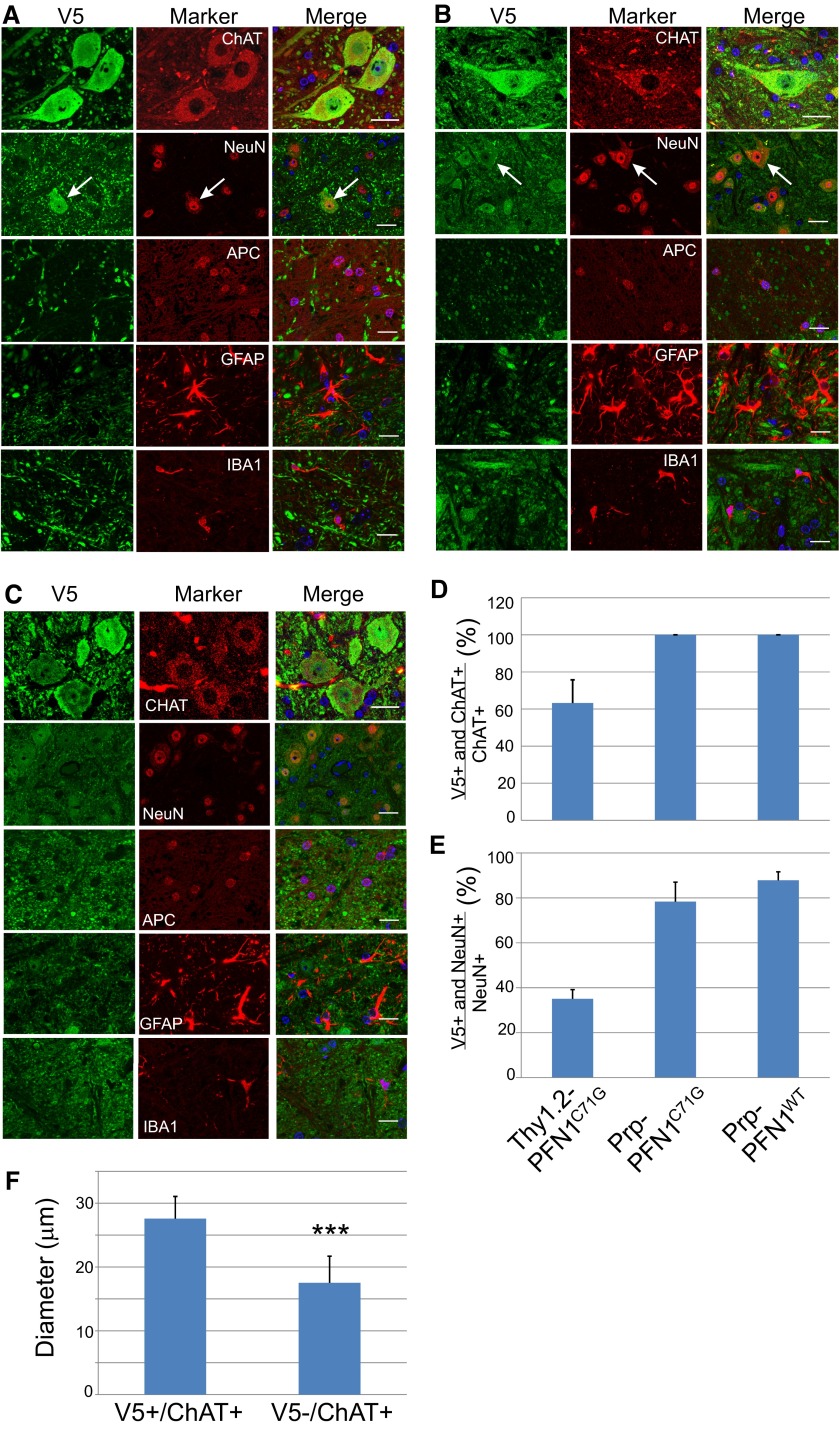
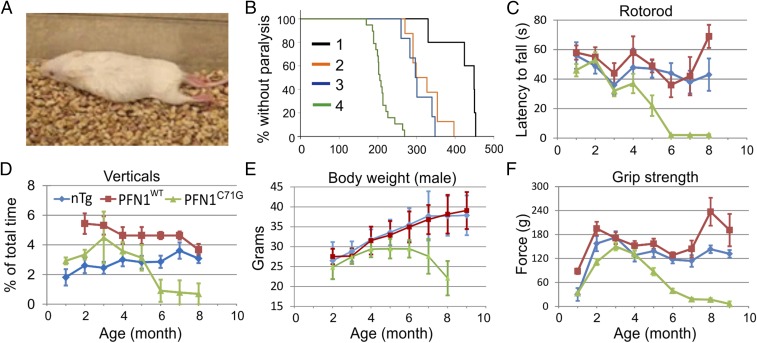
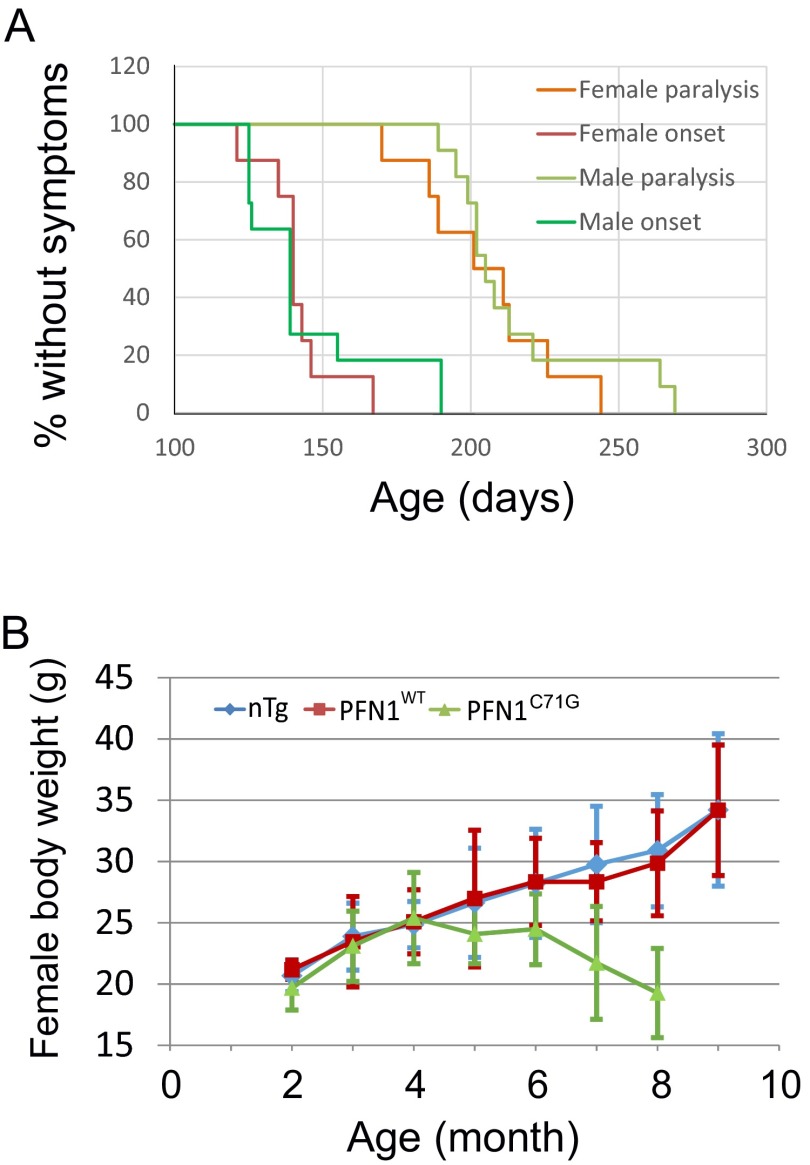
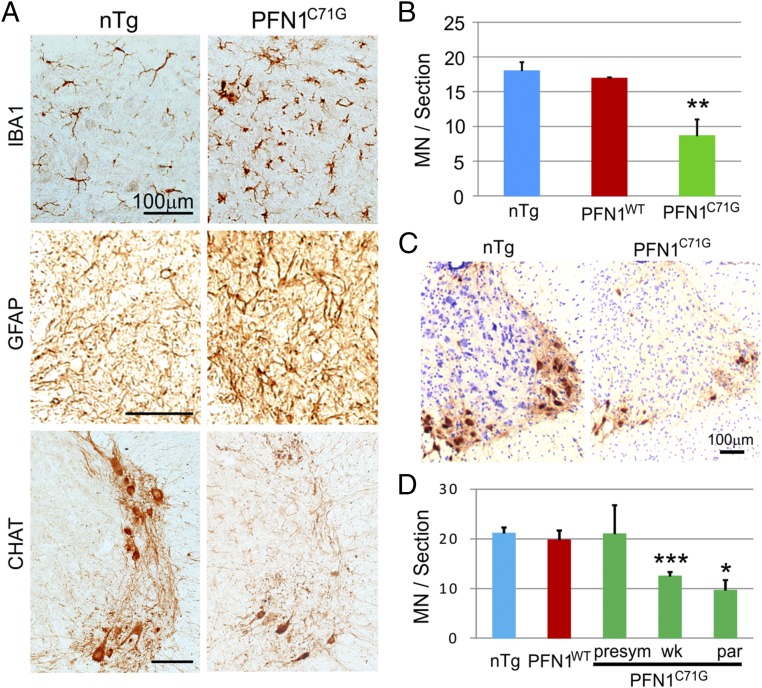
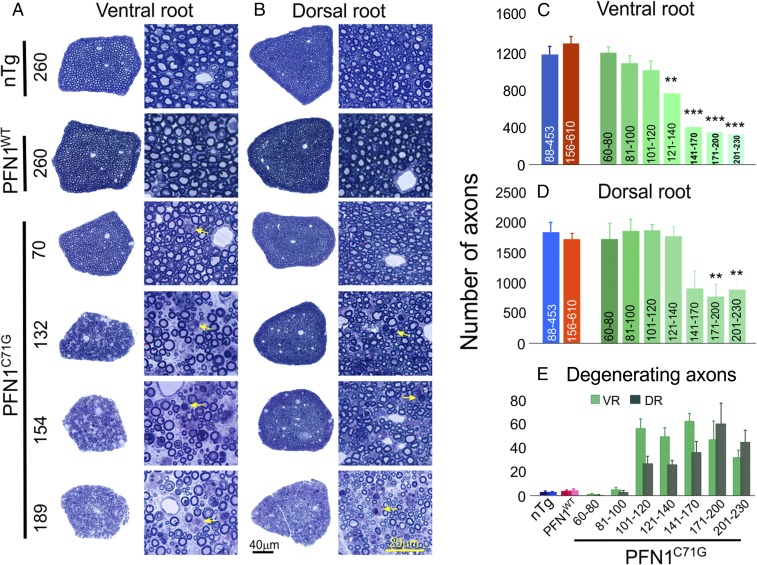
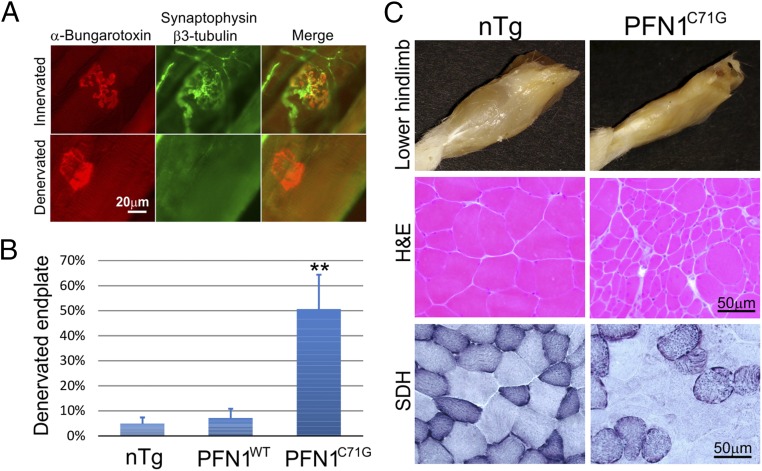
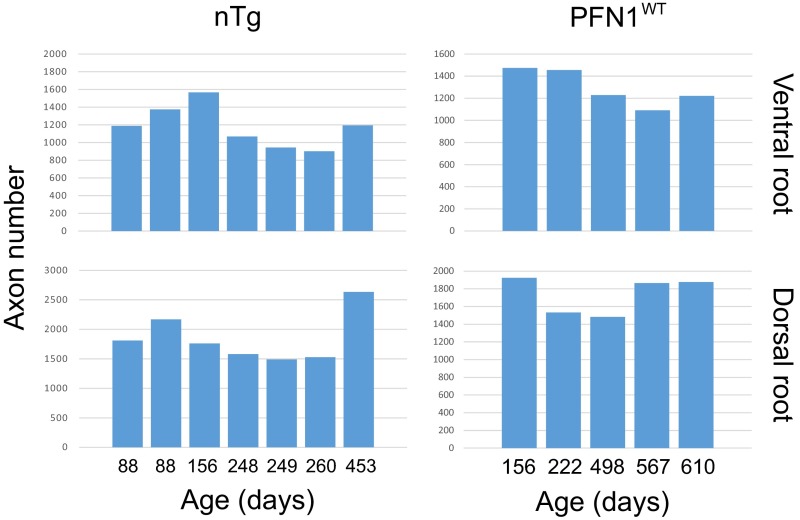
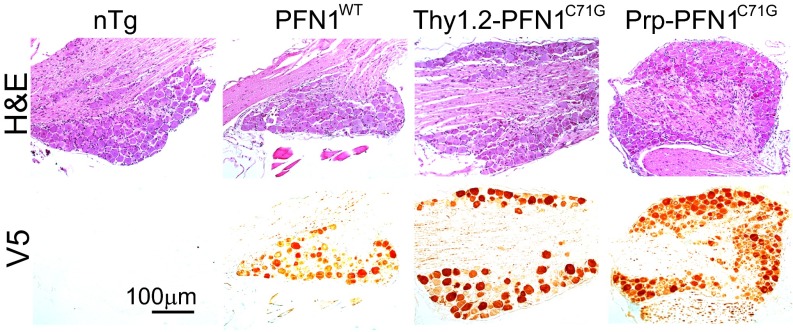
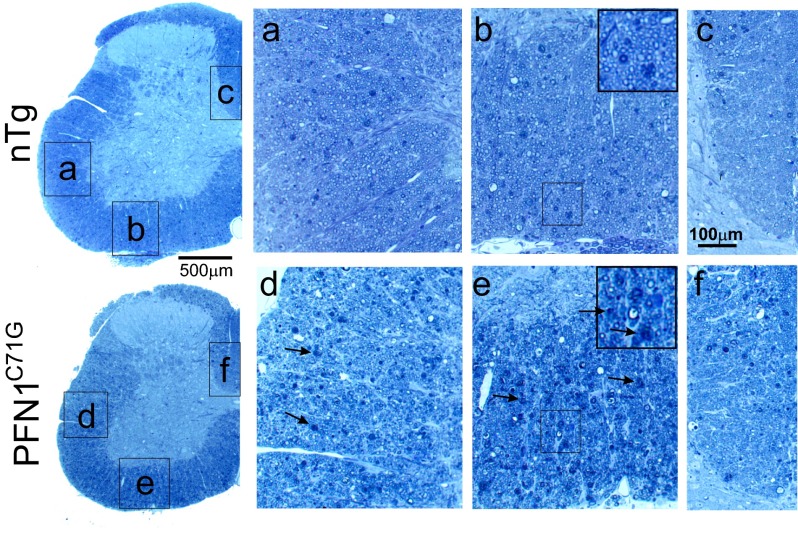
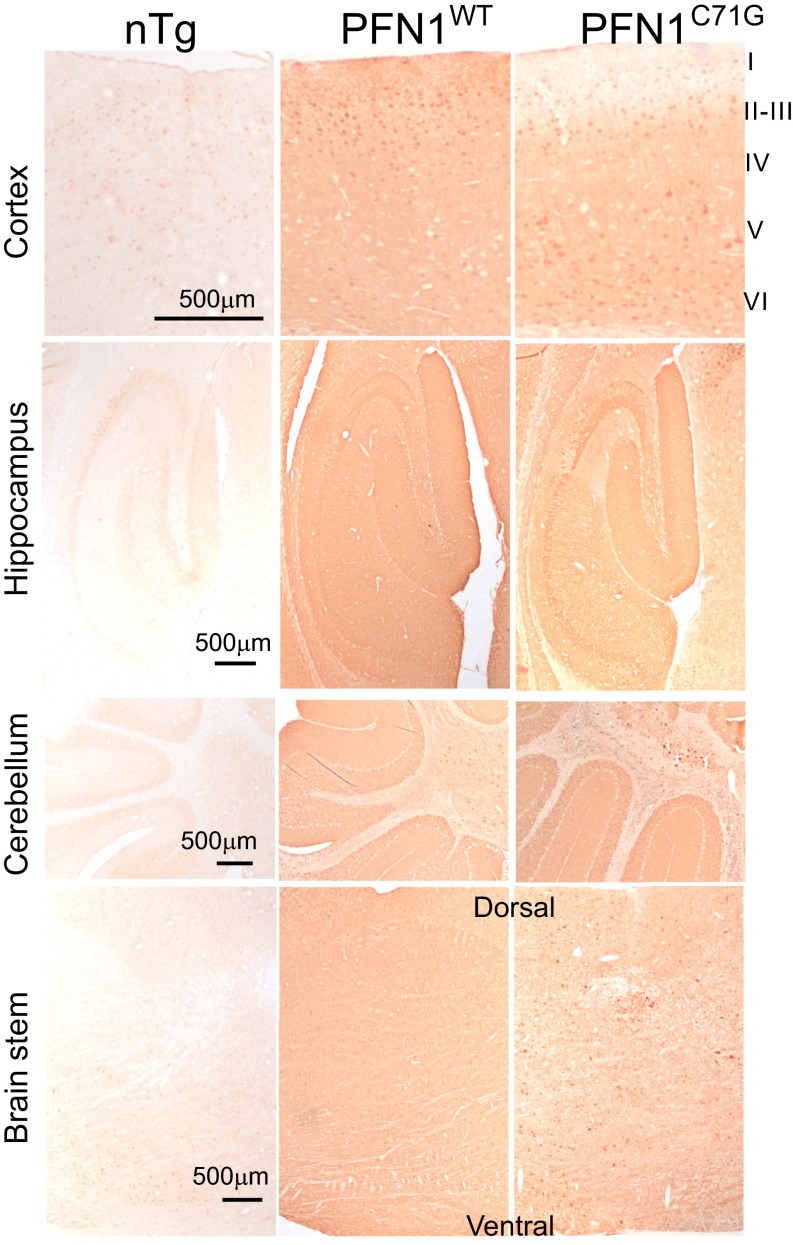
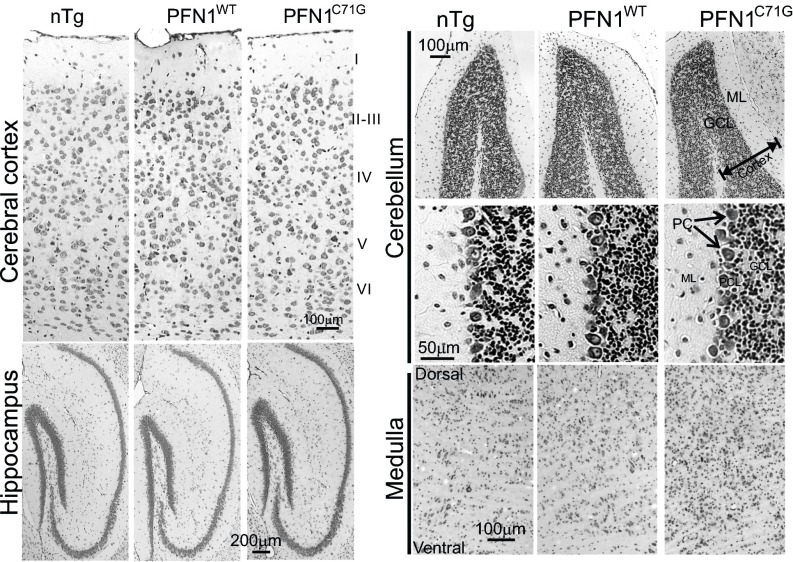
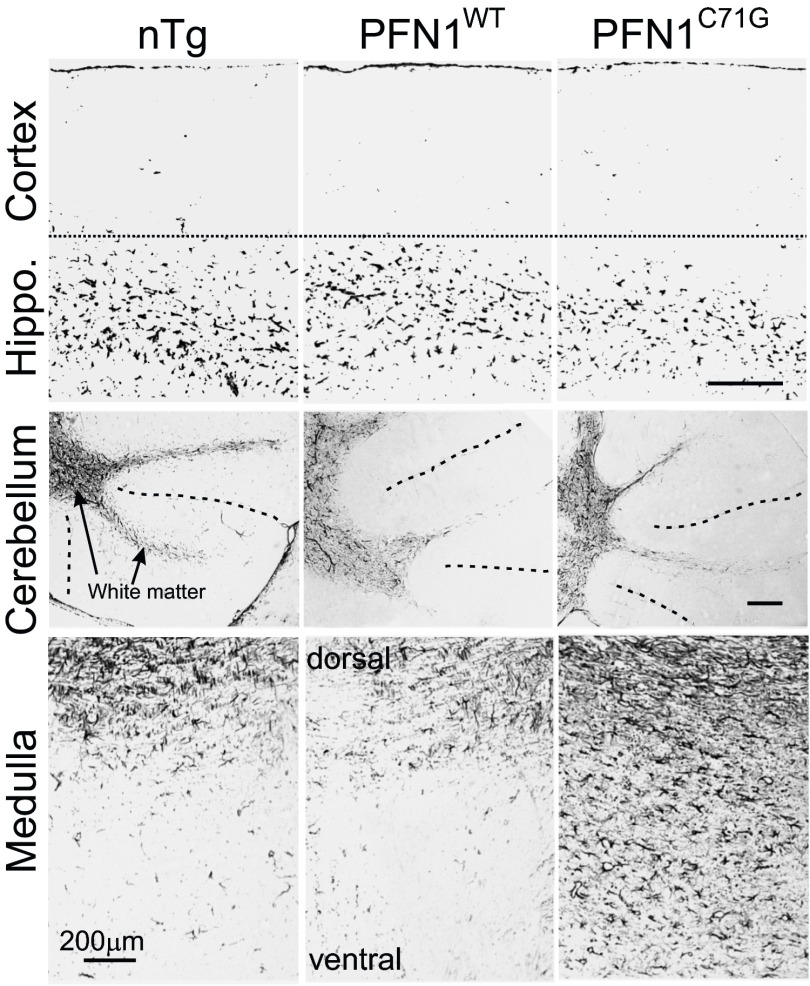
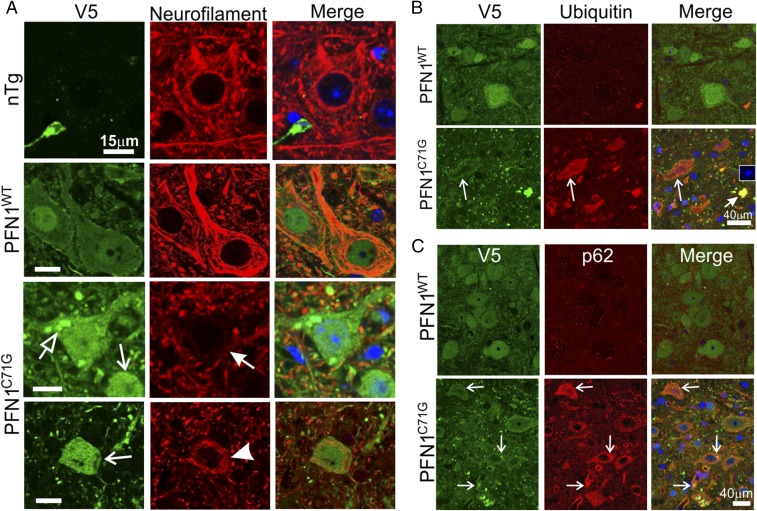
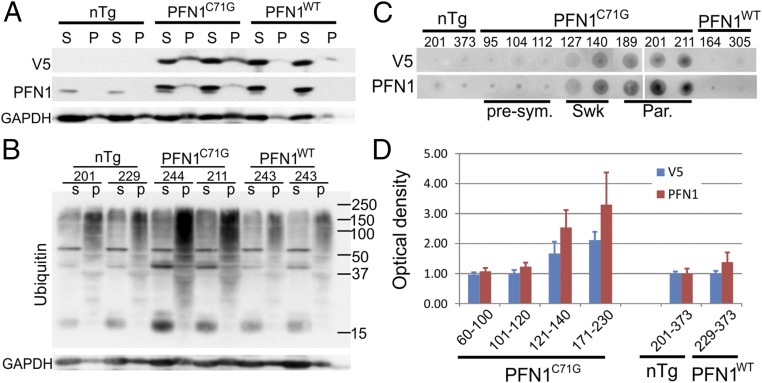
Mutations in the profilin 1 (PFN1) gene cause amyotrophic lateral sclerosis (ALS), a neurodegenerative disease caused by the loss of motor neurons leading to paralysis and eventually death. PFN1 is a small actin-binding protein that promotes formin-based actin polymerization and regulates numerous cellular functions, but how the mutations in PFN1 cause ALS is unclear. To investigate this problem, we have generated transgenic mice expressing either the ALS-associated mutant (C71G) or wild-type protein. Here, we report that mice expressing the mutant, but not the wild-type, protein had relentless progression of motor neuron loss with concomitant progressive muscle weakness ending in paralysis and death. Furthermore, mutant, but not wild-type, PFN1 forms insoluble aggregates, disrupts cytoskeletal structure, and elevates ubiquitin and p62/SQSTM levels in motor neurons. Unexpectedly, the acceleration of motor neuron degeneration precedes the accumulation of mutant PFN1 aggregates. These results suggest that although mutant PFN1 aggregation may contribute to neurodegeneration, it does not trigger its onset. Importantly, these experiments establish a progressive disease model that can contribute toward identifying the mechanisms of ALS pathogenesis and the development of therapeutic treatments.

Keywords: denervation; motor neuron disease; muscle atrophy; neurodegeneration; proteostasis.


Conflict of interest statement

The authors declare no conflict of interest.

Figures

Fig. 1.
Fig. 1.
Exogenous PFN1 is predominantly expressed in the CNS within transgenic lines. (A) Transgene constructs expressed PFN1 cDNA with an N-terminal V5 epitope tag. Transgenic lines used the mouse prion (Prp) promoter to drive expression of either wild-type (Prp-PFN1WT) or an ALS-associated mutant (Prp-PFN1C71G) PFN1. An additional mouse line used the human Thy1.2 promoter to drive expression of mutant PFN1 (Thy1.2-PFN1C71G). (B) Western blots demonstrate that four transgenic lines (two wild-type, two mutant) express the transgenes (upper band) predominantly in the CNS. Lanes represent different organs: 1, forebrain; 2, cerebellum; 3, brainstem; 4, cervical spinal cord; 5, lumbar spinal cord; 6, heart; 7, lung; 8, liver; 9, spleen; 10, kidney; 11, muscle. nTg, nontransgenic mice. (C) Western blots for PFN1 demonstrate the relative expression of exogenous PFN1 in the spinal cord after intercrossing the two mutant transgenic lines. endo, endogenous PFN1; Tg, V5-PFN1 transgene; 1, Thy1.2-PFN1C71G/C71G/Prp-PFN1C71G triple transgenic mice; 2, Thy1.2-PFN1C71G/C71G homozygous mice; 3, Thy1.2-PFN1C71G/Prp-PFN1C71G double transgenic mice; 4, Thy1.2-PFN1C71G mice; 5, Prp-PFN1C71G mice; 6, nTg mice; 7, Prp-PFN1WT line 1; 8, Prp-PFN1WT line 2. (D) Quantification of Western blots defines the transgene PFN1 expression levels relative to the endogenous levels in the spinal cord. Bars 1–5 are the same as in C. Bars 6 and 7 are Prp-PFN1WT lines 1 and 2, respectively. Error bars are SE. Four mice were quantified in each line.
Fig. S1.
Fig. S1.
(A) Thy1.2-PFN1C71G mice express the mutant PFN1 only in large motor neurons. Lumbar spinal cord sections from presym mice were stained for V5 and cell-specific markers: ChAT for motor neurons, NeuN for all neurons, APC for oligodendrocytes, GFAP for astrocytes, and Iba1 for microglia. Note that the V5 signal only overlaps with ChAT-positive cells and the largest neurons (arrow in the second row). (Scale bar, 40 µm.) (B) Prp-PFN1C71G mice express the mutant PFN1 in wide neuronal populations that include motor neurons, but they do not express in glial cells including oligodendrocytes, astrocytes, and microglia. Cell-specific markers are the same as in A. Note that the V5 signal overlaps with all NeuN-positive cells including the largest neurons (arrow in the second row). (Scale bar, 40 µm.) (C) Prp-PFN1WT mice express mutant PFN1 in the same cell populations as in the Prp-PFN1C71G mice shown in B. Cell-specific markers are the same as in A. (Scale bar, 40 µm.) (D–F) CNS cells that express the transgenes are quantified. (D) In the ventral horn, 60% of ChAT-positive neurons express the mutant PFN1 in Thy1.2-PFN1C71G mice, whereas all ChAT-positive neurons express the mutant in Prp-PFN1C71G and Prp-PFN1WT mice. (E) In the ventral horn, approximately 35% of NeuN-positive neurons express the mutant PFN1 in Thy1.2-PFN1C71G mice, whereas nearly 80% express transgene in Prp-PFN1C71G and Prp-PFN1WT mice. (F) The sizes of ChAT-positive neurons in D were measured from the ChAT-stained areas and converted to equivalent diameters. The result shows that the V5-positive cells are significantly larger than the V5-negative cells (***P < 0.001). The bars in D–F represent averages from 30 or more ChAT-positive neurons per animal and 100 or more NeuN-positive neurons per animal. Each bar represents an average from four to five animals. Error bars are SD.
Fig. 2.
Fig. 2.
Transgenic mice expressing mutant but not WT PFN1 show progressive loss of motor capabilities. (A) Photo of a Thy1.2-PFN1C71G transgenic at ∼400 d old displaying ppar (Movie S1). (B) The onset age of paralysis of mutant PFN1 mice are shown: 1, Thy1.2-PFN1C71G mice; 2, Thy1.2-PFN1C71G/C71G mice; 3, Thy1.2-PFN1C71G/Prp-PFN1C71G mice; 4, Thy1.2-PFN1C71G/C71G/Prp-PFN1C71G mice. The rank order of the ages correlated inversely with the expression of the mutant PFN1 protein (Fig. 1 C and D). The plots represent data from both genders, as this did not appear to contribute to disease onset or progression (Fig. S2A). (C) Rotorod tests demonstrated stable performances in the nTg and PFN1WT mice but a progressive decline in the PFN1C71G mice after 4 mo of age. All time points represent averages of 5–28 mice, 4–21 mice, and 10–25 mice for the nTg, PFN1WT, and PFN1C71G groups, respectively, with the exception of the end point for PFN1C71G (n = 2). Error bars represent the SE. (D) PFN1C71G mice display a progressive decline in home cage vertical behavior (rearing, jumping, hanging, climbing, and coming down). Vertical time points represent averages from 8 to 10 mice, 7–10 mice, and 8–10 for the nTg, PFN1WT, and PFN1C71G groups, respectively. Error bars are SE. (E) The peak body weight of PFN1C71G mice is reached between age 4 and 6 mo and declined afterward. In contrast, the nTg and PFN1WT mice progressively increased body weight beyond this time period. Female mice display a similar pattern of weight loss (Fig. S2B). Time points are averages of 11–30 mice, 3–18 mice, and 9–21 mice for the nTg, PFN1WT, and PFN1C71G groups, respectively. Error bars represent the SD. (F) Grip strength tests demonstrated stable performances in the nTg and PFN1WT mice but a progressive decline in PFN1C71G mice after peaking at 3 mo of age. Time points are averages of 8–25 mice, 6–15 mice, and 11–32 mice for the nTg, PFN1WT, and PFN1C71G groups, respectively. The color representation of mouse genotypes in C–F is shown in D. Error bars represent the SE.
Fig. S2.
Fig. S2.
Characterization of disease phenotype in PFN1C71G mice. (A) Male (n = 11) and female (n = 8) transgenic mice show the same disease onset and paralysis ages. The mean onset age (±SD) for males is 145 ± 24 d and for females 142 ± 13 d. The mean paralysis age for males is 215 ± 27 d and for females 205 ± 24 d. The differences between the sexes are not statistically significant (P > 0.05, Wilcoxon Rank Sum test). (B) The body weight of the female PFN1C71G mice shows the same changing pattern as the male mice (Fig. 2E). Body weight reached the peak between age 4 and 6 mo and declined afterward, whereas it continued to climb in nTg and PFN1WT mice. Time points are averages from 4–24, 7–13, and 6–14 animals in nTg, WT, and ph(h)PFN1C71G groups, respectively.
Fig. S3.
Fig. S3.
PFN1C71G and PFN1WT mice express the transgene in spinal cord and in motor neurons at similar levels. (A) Both PFN1C71G and PFN1WT mice expressed the transgene broadly in the gray matter of the spinal cord as shown by V5 staining in the lumbar area. The cervical spinal cord shows the same pattern. (B) Spinal cords from PFN1C71G and PFN1WT mice were sectioned and doubly stained for V5 and ChAT in parallel. Images were taken using confocal microscopy using the same exposure settings. The fluorescence intensity in individual cells was quantified (unfilled symbols) and averaged from each animal. The averages of individual animals were averaged and plotted as the average of the genotype (filled symbols with error bars, which represent SD). Symbols arranged in one vertical line represent values from cells in one animal.
Fig. 3.
Fig. 3.
Transgenic PFN1C71G mice display progressive motor neuron degeneration. (A) At the paralysis disease stage, PFN1C71G mice showed a significant microgliosis, astrogliosis, and motor neuron loss. All of the sections were isolated from the ventral horn in the lumbar spinal cord. (B) Quantification of motor neuron numbers in the lumbar spinal cord confirmed a significant motor neuron loss at the paralysis stage within the PFN1C71G mice. Each bar represents an average of three animals. (C) At the paralysis stage, cervical spinal cords of PFN1C71G mice display severe motor neuron loss. The sections were stained for ChAT and counterstained with hematoxylin. (D) Quantification of motor neuron numbers in the cervical spinal cord at different disease stages reveals a progressive loss in PFN1C71G mice. The age ranges for the PFN1C71G mice are as follows: 61–102 d for the presym stage, 132–154 d for the Wk stage, and 170–226 d for the par stage. The age range for the PFN1WT mice is 250–271 d and for the nTg mice is 138–250 d. Each bar represents an average from three to six mice. Error bars represent the SD. Student’s t test was used to compare all transgenic mice with nTg mice. **P < 0.01; ***P < 0.001. (Scale bar for A and C, 100 µm.)
Fig. 4.
Fig. 4.
Progressive loss of motor and sensory axons is observed in PFN1C71G mice but not in nTg and PFN1WT mice. (A and B) The cross-sections of the whole L5 ventral and dorsal roots at different ages (days) as well as an enlarged area from these roots are shown. The ventral root degeneration in PFN1C71G mice precedes the degeneration of dorsal root. Arrows indicate degenerating axons. (C and D) Quantification of L5 ventral and dorsal root axon numbers, respectively, is shown. The axon numbers in the ventral and dorsal root of nTg and PFN1WT mice are relatively constant at different ages (Fig. S4B) and thus are grouped together. The range of ages for each group is shown under each bar. Statistics and significance levels are the same as in Fig. 3. (E) Quantification of degenerating axons in ventral and dorsal root axons, respectively, is shown. Disease stages: <120 d, presym; 121–140 d, swk; 141–170 d, Wk; 171–200 d, Wk to ppar; and 201–230 d, par. The bars in C–E represent averages from three to nine mice. All error bars are SE.
Fig. 5.
Fig. 5.
Muscle denervation and atrophy are observed in the late stages (ppar and par) of PFN1C71G mice. (A) Examples of innervated and denervated endplates are shown. The images were taken from a paralyzed PFN1C71G mouse. (B) Quantification of muscle denervation in gastrocnemius muscle is shown. Sample sizes: nTg (n = 5); PFN1WT (n = 3); PFN1C71G (n = 4, two partially and two fully paralyzed). (C) Muscles are atrophic in late stages (partially and fully paralyzed) in PFN1C71G mice relative to age-comparable nTg mice. (Top) The muscle mass in the lower hindlimb is significantly diminished in the PFN1C71G mouse compared with the nTg mouse. These images are representative of >5 observations. (Middle) A cross section of gastrocnemius muscle reveals clustered atrophic fibers in a partially paralyzed PFN1C71G mouse, whereas the nTg mice display relatively uniform fiber sizes. (Bottom) Staining for succinate dehydrogenase (SDH) reveals clustering of SDH-strong and SDH-weak fibers in the PFN1C71G mice compared with a more interspersed distribution observed in the nTg mice.
Fig. S4.
Fig. S4.
The axon numbers in the L5 roots are stable throughout different ages in nTg and PFN1WT animals. Each bar represents the value from a single root.
Fig. S5.
Fig. S5.
PFN1 transgenes are expressed in DRG. Successive paraffin sections from DRG were stained with hematoxylin and eosin (Top) and V5 (Bottom).
Fig. S6.
Fig. S6.
Toluidine blue-stained spinal cord sections show various degrees of axon degeneration in the white matter. Compared with the control nTg mice, there is a modest axon degeneration in the lateral column (A and D) and a severe degeneration in the ventral column (B and E) but very few degenerating fibers in the dorsal column (C and F) that contain CST. Arrows point to examples of degenerating axons.
Fig. S7.
Fig. S7.
Mutant and wild-type PFN1 transgenes are broadly expressed in brains of the transgenic mice.
Fig. S8.
Fig. S8.
Survey of neurodegeneration in the brain of mutant PFN1 mice. Nissl staining reveals no obvious difference in the cerebral and cerebellar cortices among nTg, PFN1WT, and PFN1C71G mice. However, an increased cellulation is observed in the medulla of PFN1C71G mice compared with nTg and PFN1WT mice. GCL, granule cell layer; ML, molecular layer; PC = Purkinje cell.
Fig. S9.
Fig. S9.
GFAP staining of the brains of PFN1 transgenic mice. Notice the levels of staining intensity are similar among nTg, PFN1WT, and PFN1C71G mice in the cortex, hippocampus, and cerebellum. However, in medulla the GFAP staining intensity is higher in the mutant than in the nTg and PFN1WT mice. The dotted lines in the cerebellar images indicate a boundary between folia. (Scale bar, 200 µm.)
Fig. 6.
Fig. 6.
Cytoskeletal alterations and proteostress are observed in the motor neurons of PFN1C71G mice. (A) End stage lumbar spinal cord sections from PFN1C71G mice as well as age-matched nTg and PFN1WT mice were stained for V5 and neurofilament subunit L. The open arrow points to large PFN1 aggregates. The filled arrow points to a motor neuron with reduced neurofilaments. The barbed arrows point to neurons with small particulate aggregates. The arrowhead points to a neuron with circular neurofilament bundles around the cell periphery. (Scale bar, 15 µm.) (B) Altered ubiquitin staining is observed in the spinal cord of PFN1C71G mice. Lumbar spinal cord sections from end stage PFN1C71G mice and PFN1WT mice were stained for V5 and ubiquitin. Long arrows point to a motor neuron with a high level of ubiquitin. The short arrow points to a densely stained structure that contains DNA (Inset). This may represent the remnant of a collapsed cell. nTg is omitted from this figure, as it showed the same ubiquitin staining as the PFN1WT mice. (C) Changes in p62/SQSTM staining are observed in the spinal cord of PFN1C71G mice. Lumbar spinal cord sections from the end stage mutant mice and from age-matched PFN1WT mice were stained for V5 and p62/SQSTM. Arrows point to PFN1 aggregates that were colocalized with p62/SQSTM. nTg is omitted from this figure, as it showed the same p62 staining as the PFN1WT mice.
Fig. 7.
Fig. 7.
Aggregation of mutant PFN1 is observed in PFN1C71G mice. (A) Lumbar spinal cords from end-stage PFN1C71G mice and age-matched controls were subject to homogenization followed by centrifugation. Proteins in the soluble (S) and pellet (P) fractions were resolved by SDS/PAGE. PFN1 was detected in PFN1C71G mice but not in PFN1WT or nTg mice. (B) Soluble and pellet fractions of lumbar spinal cords were subject to Western blot analysis to detect ubiquitin. The high-molecule weight polyubiquitinated species were increased in PFN1C71G mice relative to PFN1WT and nTg mice. (C) Filter trapping assays were applied to spinal cord protein extracts from PFN1C71G mice at different disease stages to assess the level of protein aggregation. The numbers above the gel indicate the ages of the individual mouse. The abbreviations at the bottom indicate the disease stage: par, paralysis; presym, presymptomatic; swk, slightly weak. (D) The optical density of the dot blots shown in C were quantified and plotted. The bars represent the average of 3–5 mice normalized to the average of the nTg mice. The numbers below the bars indicate range of ages for the mice. Error bars are SD.

Similar articles

Cited by

References

    1. Rowland LP, Shneider NA. Amyotrophic lateral sclerosis. N Engl J Med. 2001;344(22):1688–1700. - PubMed
    1. Smith BN, et al. Novel mutations support a role for Profilin 1 in the pathogenesis of ALS. Neurobiol Aging. 2015;36(3):1602.e1617–1602.1627. - PMC - PubMed
    1. Wu CH, et al. Mutations in the profilin 1 gene cause familial amyotrophic lateral sclerosis. Nature. 2012;488(7412):499–503. - PMC - PubMed
    1. Witke W. The role of profilin complexes in cell motility and other cellular processes. Trends Cell Biol. 2004;14(8):461–469. - PubMed
    1. Boopathy S, et al. Structural basis for mutation-induced destabilization of profilin 1 in ALS. Proc Natl Acad Sci USA. 2015;112(26):7984–7989. - PMC - PubMed

Publication types

MeSH terms