. 2016 Nov 7;27(22):3659-3672.
doi: 10.1091/mbc.E16-06-0427. Epub 2016 Sep 28.

Molecular signatures of mu opioid receptor and somatostatin receptor 2 in pancreatic cancer

Affiliations

Molecular signatures of mu opioid receptor and somatostatin receptor 2 in pancreatic cancer

Raphael Jorand et al. Mol Biol Cell. .

Abstract

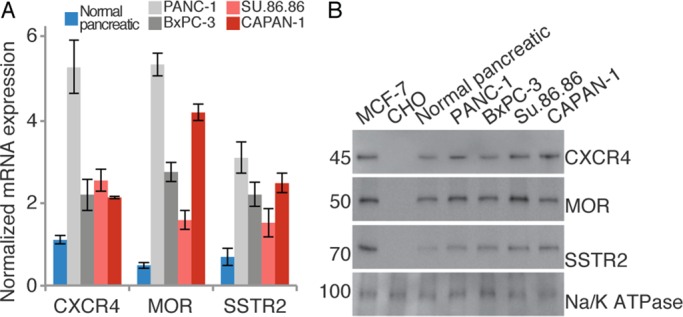
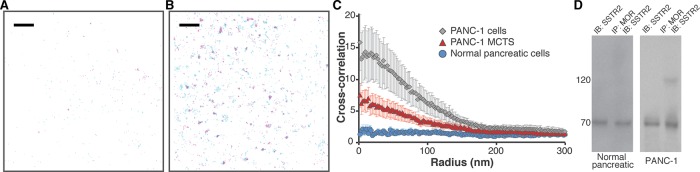
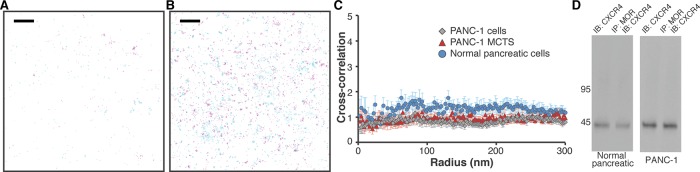
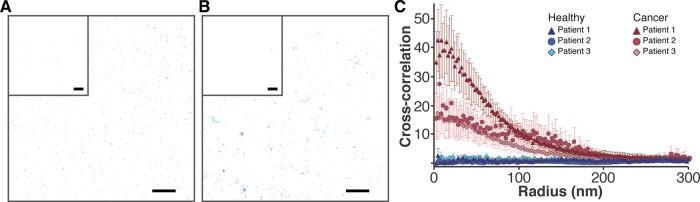
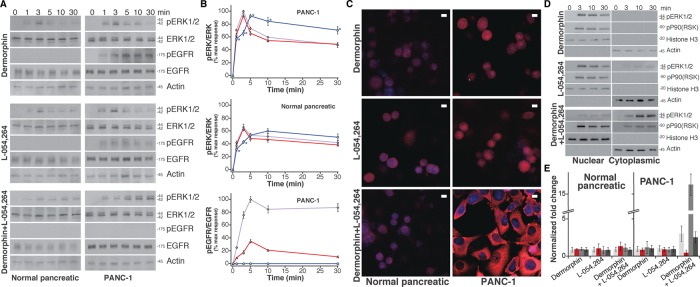
Pancreatic ductal adenocarcinoma (PDAC), a particularly aggressive malignancy, has been linked to atypical levels, certain mutations, and aberrant signaling of G-protein-coupled receptors (GPCRs). GPCRs have been challenging to target in cancer because they organize into complex networks in tumor cells. To dissect such networks with nanometer-scale precision, here we combine traditional biochemical approaches with superresolution microscopy methods. A novel interaction specific to PDAC is identified between mu opioid receptor (MOR) and somatostatin receptor 2 (SSTR2). Although MOR and SSTR2 did not colocalize in healthy pancreatic cells or matching healthy patient tissues, the pair did significantly colocalize in pancreatic cancer cells, multicellular tumor spheroids, and cancerous patient tissues. Moreover, this association in pancreatic cancer cells correlated with functional cross-talk and increased metastatic potential of cells. Coactivation of MOR and SSTR2 in PDAC cells led to increased expression of mesenchymal markers and decreased expression of an epithelial marker. Together these results suggest that the MOR-SSTR2 heteromer may constitute a novel therapeutic target for PDAC.


Figures

FIGURE 1:
FIGURE 1:
Expression of CXCR4, MOR, and SSTR2 in pancreatic cell lines. (A) Using the mRNA levels of GAPDH in pancreatic cell lines as a point of comparison, we determined the relative mRNA levels of CXCR4, MOR, and SSTR2. Normal epithelial pancreatic cells are shown in blue; primary pancreatic cancer cell lines are shown in gray; metastatic pancreatic cell lines are shown in red. Measurements are from three independent experiments, each done in triplicate. CHO-S cells were used as negative controls and MCF-7 cells as positive controls. Results are expressed as the average with SD. All GPCRs show statistically increased expression in cancerous cell lines compared with normal pancreatic cells (p ≤ 0.02). (B) In the membrane fraction of pancreatic cell lines, the protein levels of CXCR4, MOR, and SSTR2 were determined. CHO-S cells were used as negative controls and MCF-7 cells as positive controls. Loading was validated with Na/K ATPase. Quantitation of GPCR protein levels in different cell lines from three independent experiments is shown in Supplemental Figure S13A. Images were cropped for clarity; full blots are given in Supplemental Figure S13B.
FIGURE 2:
FIGURE 2:
Colocalization of MOR and SSTR2. (A) The distribution of SSTR2 (magenta, detected with Atto 488) and MOR (cyan, detected with Alexa Fluor 647) was determined in a region of normal epithelial pancreatic cells. Scale bar, 2 μm. Peak centers are shown. (B) The distribution of SSTR2 (magenta, detected with Atto 488) and MOR (cyan, detected with Alexa Fluor 647) was determined in a region of PANC-1 cells. Scale bar, 2 μm. Overlap is evident in dark blue. Peak centers are shown. (C) Cross-correlation curves with SEM show colocalization between MOR and SSTR2 in both PANC-1 cells (gray diamonds, 41 regions from 22 cells) and PANC-1 MCTS (red triangles, 40 regions from 21 cells). In contrast, colocalization was not observed in normal pancreatic epithelial cells (blue circles, 50 regions from 21 cells). These results represent combined data obtained using two labeling schemes: 1) MOR detected with Alexa Fluor 647 and SSTR2 detected with Atto 488 and, 2) MOR detected with Atto 488 and SSTR2 detected with Alexa Fluor 647. Individual curves are given in Supplemental Figure S6. In all cases, no long-range correlations were observed. (D) Cell lysates from either normal pancreatic epithelial cells or PANC-1 cells were immunoprecipitated with anti-MOR antibody and immunoblotted with anti-SSTR2 antibody. SSTR2 was detected in the MOR immunoprecipitate in the PANC-1 cell line.
FIGURE 3:
FIGURE 3:
There is no colocalization between MOR and CXCR4. (A) The distribution of CXCR4 (magenta, detected with Atto 488) and MOR (cyan, detected with Alexa Fluor 647) was determined in a region of normal pancreatic cells. Scale bar, 2 μm. Peak centers are shown. (B) The distribution of CXCR4 (magenta, detected with Atto 488) and MOR (cyan, detected with Alexa Fluor 647) was determined in a region of PANC-1 cells. Scale bar, 2 μm. Peak centers are shown. (C) Cross-correlation curves with SEM show no colocalization between MOR and CXCR4 in PANC-1 cells (gray diamonds, 32 regions from 14 cells), PANC-1 MCTS (red triangles, 20 regions from 12 cells), and normal pancreatic epithelial cells (blue circles, 21 regions from 13 cells). In all cases, no long-range correlations were observed. (D) Cell lysates from either normal pancreatic epithelial cells or PANC-1 cells were immunoprecipitated with anti-MOR antibody and immunoblotted with anti-CXCR4 antibody. CXCR4 was not detected in the MOR immunoprecipitate in either cell line. Quantitation is shown in Supplemental Figure S13D.
FIGURE 4:
FIGURE 4:
Colocalization of MOR and SSTR2 in patient tissues. (A) The distribution of SSTR2 (cyan, detected with Alexa Fluor 647) and MOR (magenta, detected with Atto 488) was determined in healthy pancreatic tissue margins. Scale bar, 2 μm. Inset, controls with blocking peptides; scale bar, 5 μm. Peak centers are shown. (B) The distribution of SSTR2 (cyan, detected with Alexa Fluor 647) and MOR (magenta, detected with Atto 488) was determined in matching cancerous pancreatic tissue. Scale bar, 2 μm. Controls with blocking peptides are given in the inset; scale bar, 5 μm. Overlap is evident in dark blue. Peak centers are shown. (C) Cross-correlation with SEM demonstrates colocalization between MOR and SSTR2 in tumor tissue: red triangles (patient 1, N = 9), red circles (patient 2, N = 8) and red diamonds (patient 3, N = 15). Colocalization was not detected in matching healthy tissue: blue triangles (patient 1, N = 7), blue circles (patient 2, N = 8), and blue diamonds (patient 3, N = 14). Only areas positive for keratin 8 and 18 were used for quantification. In all cases, no long-range correlations are observed.
FIGURE 5:
FIGURE 5:
Combined MOR and SSTR2 agonist treatment leads to a distinct signaling pathway in PANC-1 cells. (A) After treatment of either normal epithelial pancreatic cells or PANC-1 cells with agonists, phosphorylation of ERK1/2 and EGFR in cell lysates was analyzed (Western blot detection). The agonist treatments were 10 nM dermorphin, 10 nM L-054,264, or 10 nM dermorphin with 10 nM L-054,264. Treatment time periods are indicated. Images were cropped for clarity; large regions of representative original images are provided in Supplemental Figure S13E. (B) Image Lab software was used to quantify the amount of ERK1/2 or EGFR phosphorylation in each lane. The data are expressed as a ratio of either pERK1/2 over total ERK1/2 or pEGFR over total EGFR and averaged. Results are normalized (the maximum response for dermorphin in PANC-1 cells is taken as 100%) and presented with SE. Dermorphin treatment is presented in purple; L-054,264 treatment is presented in red; and the combined treatment is presented in blue. *p < 0.01 (obtained using the single-tail t test) between dermorphin activation and either L-054,264 or combined L-054,264 and dermorphin activation. For pEGFR/EGFR, the corresponding p < 0.01 in all cases. (C) Confocal imaging was used to determine pERK1/2 localization in cells. The combined MOR and SSTR2 agonists targeted pERK1/2 to the nucleus in normal pancreatic cells (low levels) and to cytoplasm in PANC-1 cells (high levels). Single agonists targeted pERK1/2 to the nucleus in normal pancreatic cells (low levels) and to the nucleus in PANC-1 cells (high levels). Scale bars, 10 μm. (D) After treatment of PANC-1 cells with agonists (10 nM dermorphin, 10 nM L-054,264, or 10 nM dermorphin with 10 nM L-054,264) for the indicated periods of time, nuclear and cytoplasmic cell fractions were separated, and levels of pERK1/2 and pRSK were observed using Western blots. Large regions of representative original images are provided in Supplemental Figure S13F. (E) After treatment of normal pancreatic and PANC-1 cells with agonists (10 nM dermorphin, 10 nM L-054,264, or 10 nM dermorphin with 10 nM L-054,264) for 24 h, mRNA levels of N-cadherin (light gray), MMP-9 (dark gray), vimentin (medium gray), and E-cadherin (red) were measured and compared with their levels in untreated cells. Measurements from three independent experiments, each done in duplicate. Results are expressed as the average with SD.

References

    1. AbdAlla S, Lother H, el Massiery A, Quitterer U. Increased AT(1) receptor heterodimers in preeclampsia mediate enhanced angiotensin II responsiveness. Nat Med. 2001;7:1003–1009. - PubMed
    1. Ahn S, Shenoy SK, Wei H, Lefkowitz RJ. Differential kinetic and spatial patterns of beta-arrestin and G protein-mediated ERK activation by the angiotensin II receptor. J Biol Chem. 2004;279:35518–35525. - PubMed
    1. Albizu L, Cottet M, Kralikova M, Stoev S, Seyer R, Brabet I, Roux T, Bazin H, Bourrier E, Lamarque L, et al. Time-resolved FRET between GPCR ligands reveals oligomers in native tissues. Nat Chem Biol. 2010;6:587–594. - PMC - PubMed
    1. Albizu L, Holloway T, Gonzalez-Maeso J, Sealfon SC. Functional crosstalk and heteromerization of serotonin 5-HT2A and dopamine D2 receptors. Neuropharmacology. 2011;61:770–777. - PMC - PubMed
    1. Allavena P, Garlanda C, Borrello MG, Sica A, Mantovani A. Pathways connecting inflammation and cancer. Curr Opin Genet Dev. 2008;18:3–10. - PubMed

MeSH terms

LinkOut - more resources