. 2016 Nov 8;7(45):72699-72715.
doi: 10.18632/oncotarget.12236.

Interaction of microtubules with the actin cytoskeleton via cross-talk of EB1-containing +TIPs and γ-actin in epithelial cells

Affiliations

Interaction of microtubules with the actin cytoskeleton via cross-talk of EB1-containing +TIPs and γ-actin in epithelial cells

Vera Dugina et al. Oncotarget. .

Abstract

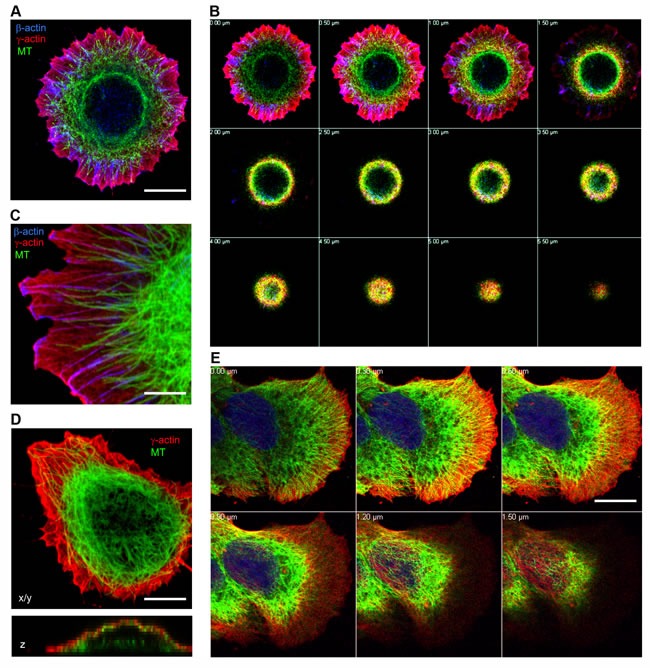
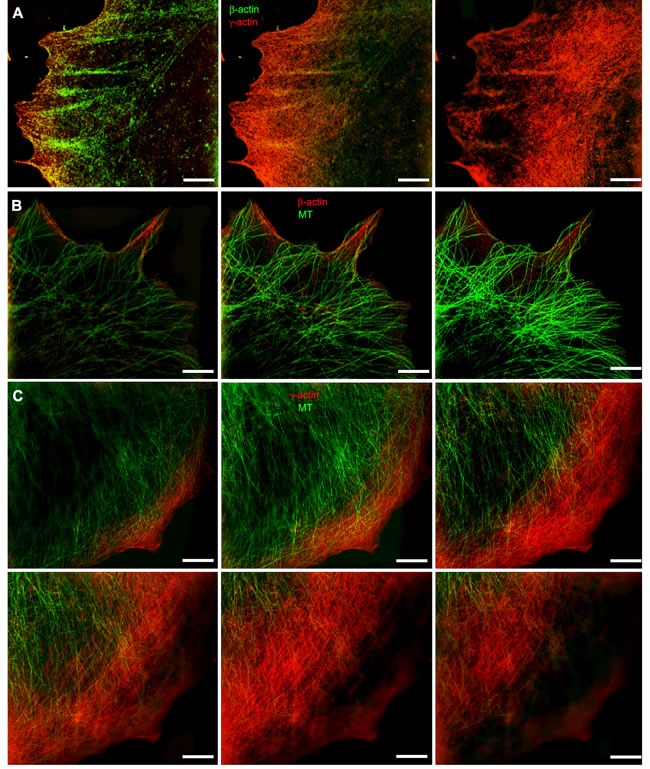
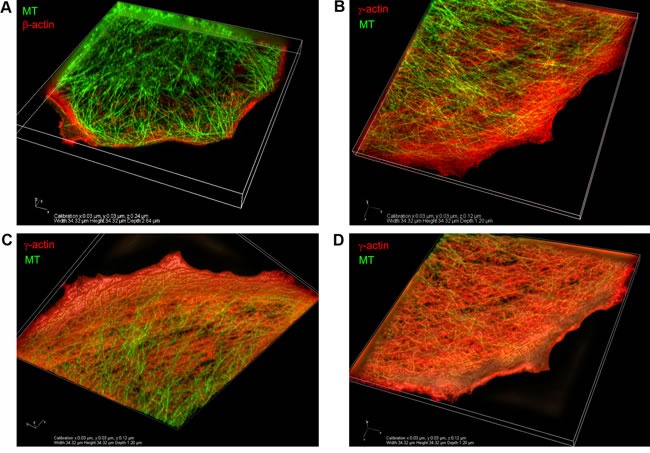
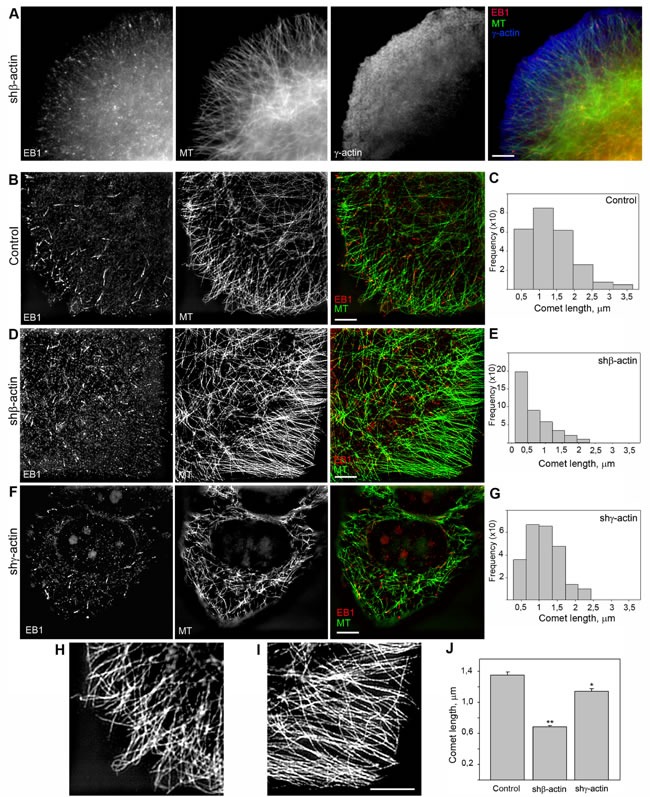
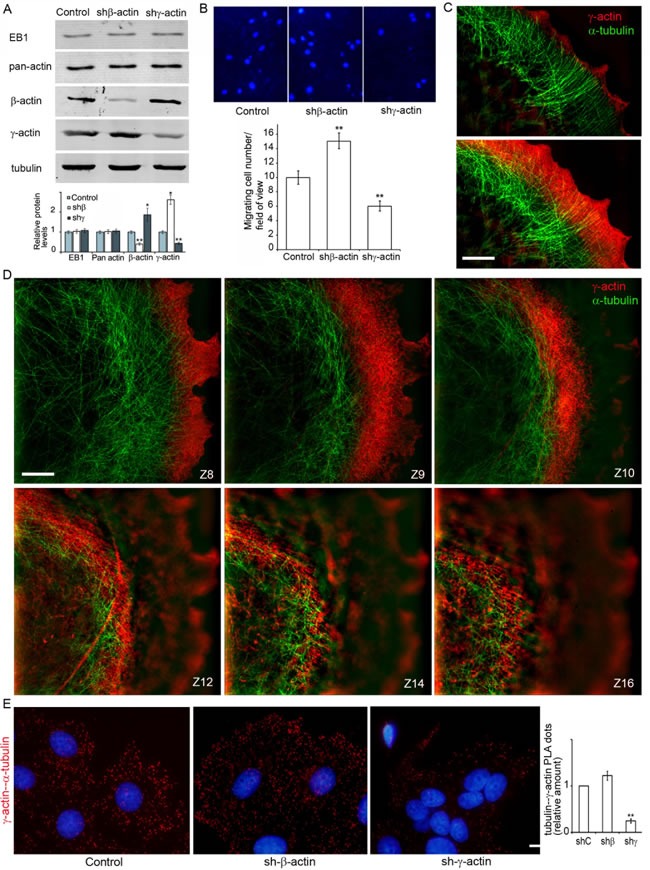
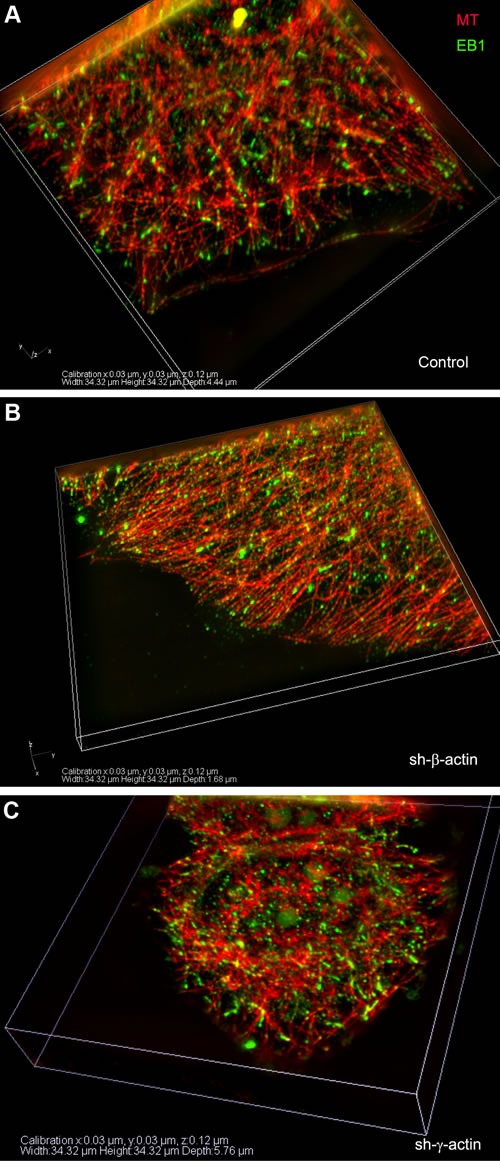
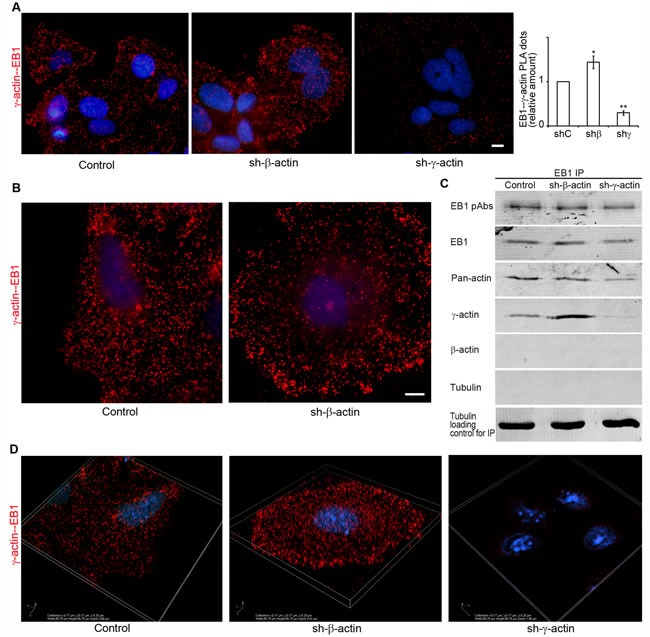
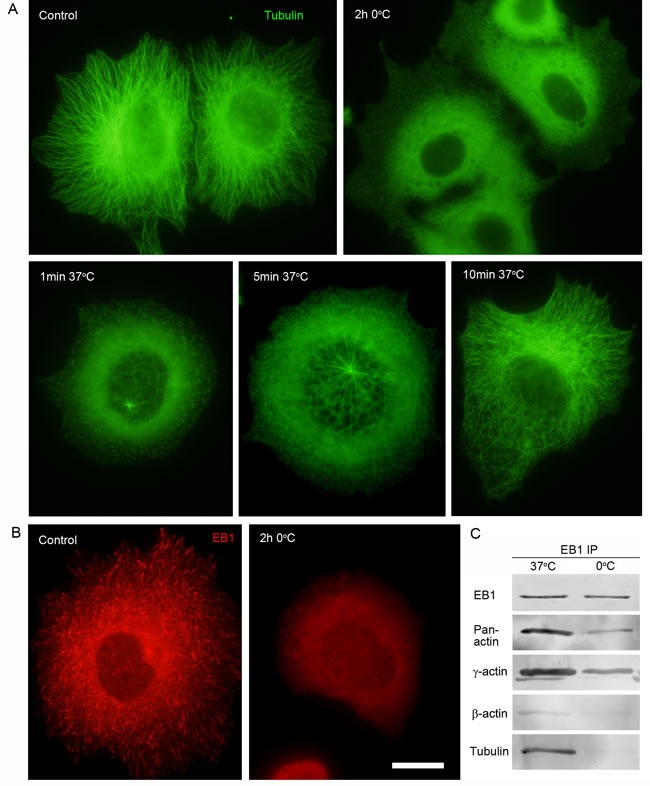
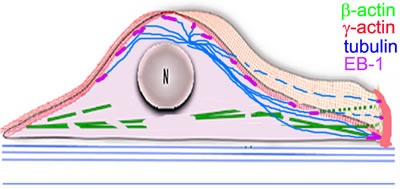
Actin microfilaments and microtubules are both highly dynamic cytoskeleton components implicated in a wide range of intracellular processes as well as cell-cell and cell-substrate interactions. The interactions of actin filaments with the microtubule system play an important role in the assembly and maintenance of 3D cell structure. Here we demonstrate that cytoplasmic actins are differentially distributed in relation to the microtubule system. LSM, 3D-SIM, proximity ligation assay (PLA) and co-immunoprecipitation methods applied in combination with selective depletion of β- or γ-cytoplasmic actins revealed a selective interaction between microtubules and γ-, but not β-cytoplasmic actin via the microtubule +TIPs protein EB1. EB1-positive comet distribution analysis and quantification have shown more effective microtubule growth in the absence of β-actin. Our data represent the first demonstration that microtubule +TIPs protein EB1 interacts mainly with γ-cytoplasmic actin in epithelial cells.

Keywords: +TIPs; EB1; actin isoforms; microtubules; β-actin; γ-actin.


Conflict of interest statement

CONFLICTS OF INTERESTS

Authors do not have any conflicts of interests.

Figures

Figure 1
Figure 1. Subcellular localization of cytoplasmic actins and microtubules in spreading epithelial cells
HaCaT A.-D. or MCF-7 (E) cells were plated for either 6 (A, B, C) or 16 hours (D, E) and stained for β-actin, γ-actin and α-tubulin. Images represent single X/Y sections (A, C, D) and Z section (D, bottom image). Panel B and E represent galleries of optical sections taken with 0.5 μm (B) or 0.3 μm E. step from the ventral (close to the substrate, first image) to the dorsal (last image) side of the HaCaT (B) cell shown in Fig 1A or MCF7 cell (E). Microtubules are distributed in close proximity to the γ-actin network, but not codistributed with the β-actin bundles. Bars, 5 μm (C) and 10 μm.
Figure 2
Figure 2. Codistribution of cytoplasmic actins with microtubules at the leading edge of MCF7 cells
A. The β-actin bundles located at the basal level of the cell, closer to the substrate, and the cortical γ-actin network at the upper cell levels. B. Distribution of β-actin (basal level) and microtubules (upper level). C. Microtubules and γ-actin network codistribution. Microtubule tips are in close proximity to the γ-actin network. All panels represent galleries of optical sections taken with 0.12 μm step from the ventral (close to the substrate, first image) to the dorsal (last image) side of the lamella, SIM. Bars, 5 μm.
Figure 3
Figure 3. Codistribution of γ-actin with microtubules at the leading edge of MCF7 cells
3D-SIM. A. The β-actin basal bundles and the microtubule system, maximum intensity projection. B. The γ-actin cortical network and the microtubule system, maximum intensity projection. C., D. The γ-actin cortical network and the microtubule system, average intensity projection. View from the bottom (C) or from the top (D) of the cell.
Figure 5
Figure 5. EB1-positive comet distribution and quantification
A. EB1 is located at the terminal parts of radial microtubules. Triple IF staining of tubulin, EB1 and γ-actin, 3-color SIM/STORM imaging. B., D., F. Two-color SIM imaging of EB1 and γ-actin in control (B), shβ-actin (D) and shγ-actin cells (F). C., E., G., J. Comet length quantification. H. Microtubule distribution at the leading edge of control (left) and shβ-actin (right) cells. Bars, 5 μm.
Figure 4
Figure 4. γ-actin-microtubule interaction after actin isoform down-regulation
A. Down-regulation of cytoplasmic actins in MCF7 cells. WB analysis. B. Migratory activity of MCF7 cells with down-regulated β- or γ-actins. DAPI staining (upper panel) and quantification (Mean ± SEM; lower panel) of migrating cells. C., D. Close distribution of microtubules and the γ-actin network at the leading edge (C, D) and in the cortex (D). All panels represent galleries of optical sections taken with 0.12 μm step from the ventral to the dorsal side of the lamella (C) or of the cell (D), SIM. Bars, 5 μm. E. γ-actin/α-tubulin PLA analysis of MCF7 cells with down-regulated β- or γ-actins. Graph represents relative amounts of PLA dots (Mean ± SEM). Bar 10 μm.
Figure 6
Figure 6. EB1-positive comet distribution in MCF7 cells with down-regulated β- or γ-actin
3D-SIM. A-C. Control, shβ-actin and shγ-actin cells.
Figure 7
Figure 7. Selective interaction of EB1 with the cytoplasmic γ-actin isoform
A. γ-actin/EB-1 PLA analysis of MCF7 cells with down-regulated β- or γ-actins. Graph represents relative amounts of PLA dots (Mean ± SEM). B. γ-actin/EB-1 PLA analysis of MCF7 cells, control cell (left) and cell with down-regulated β-actin (right), basal optical level after deconvolution. Bars, 10 μm. C. Co-immunoprecipitation (Co-IP) analysis with antibodies to EB1 after β- or γ-actin down-regulation. D. γ-actin/EB-1 PLA dots in MCF7 cells with down-regulated β- or γ-actins, 3D-SIM.
Figure 8
Figure 8. Interaction of EB1 with microtubules and the cytoplasmic γ-actin isoform in different conditions of tubulin polymerization
A. Radial microtubule system at 37°C, diffuse tubulin after 2h incubation at O°C. Microtubule re-assembly in 1 min, 5 min and 10 min at 37°C after cold-induced de-polymerization. B. EB1 distribution pattern at 37°C and after 2h incubation at O°C. C. Co-IP analysis with antibodies to EB1 at 37°C and O°C. Bar 10 μm.
Figure 9
Figure 9. The radial 3D microtubule array in combination with the cytoplasmic actin
Scheme

References

    1. Amann KJ, Pollard TD. Cellular regulation of actin network assembly. Curr. Biol. 2000;10:728–730. - PubMed
    1. Mitchison T, Kirschner M. Dynamic instability of microtubule growth. Nature. 1984a;312:237–242. - PubMed
    1. Mitchison T, Kirschner M. Microtubule assembly nucleated by isolated centrosomes. Nature. 1984b;312:232–237. - PubMed
    1. Vorobjev I, Malikov V, Rodionov V. Self-organization of a radial microtubule array by dynein dependent nucleation of microtubules. Proc Nat Acad Sci USA. 2001;98:10160–10165. - PMC - PubMed
    1. Vorobjev I A, Rodionov V I, Maly I V, Borisy GG. Contribution of plus and minus end pathways to microtubule turnover. J Cell Sci. 1999;112:2277–2289. - PubMed

LinkOut - more resources