. 2017 Feb 1;74(2):221-228.
doi: 10.1097/QAI.0000000000001187.

Quantification of the Latent HIV-1 Reservoir Using Ultra Deep Sequencing and Primer ID in a Viral Outgrowth Assay

Affiliations

Quantification of the Latent HIV-1 Reservoir Using Ultra Deep Sequencing and Primer ID in a Viral Outgrowth Assay

Sook-Kyung Lee et al. J Acquir Immune Defic Syndr. .

Abstract

Background: In this study, we measured the latent HIV-1 reservoir harboring replication-competent HIV-1 in resting CD4 T cells in participants on highly active antiretroviral therapy, quantitating the frequency of latent infection through the use of a Primer ID-based Ultra Deep Sequencing Assay (UDSA), in comparison to the readout of the quantitative viral outgrowth assay (QVOA).

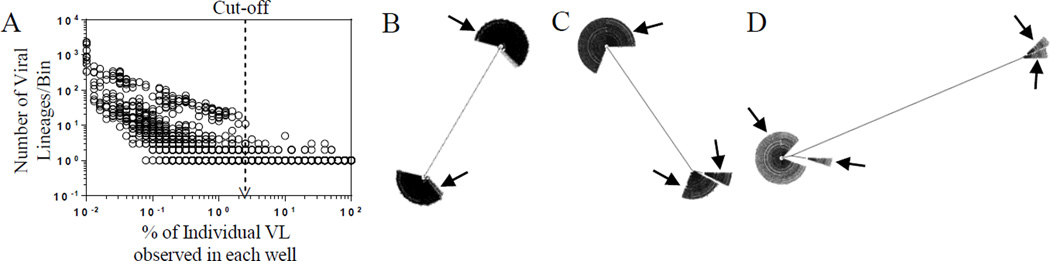
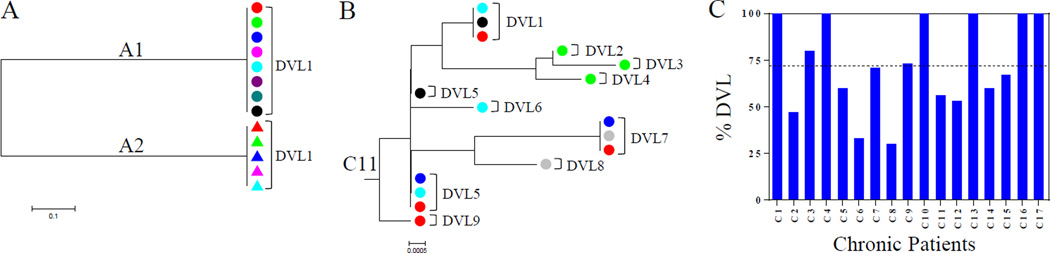
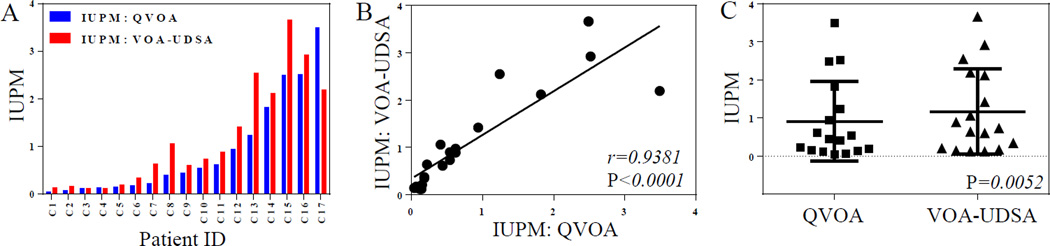
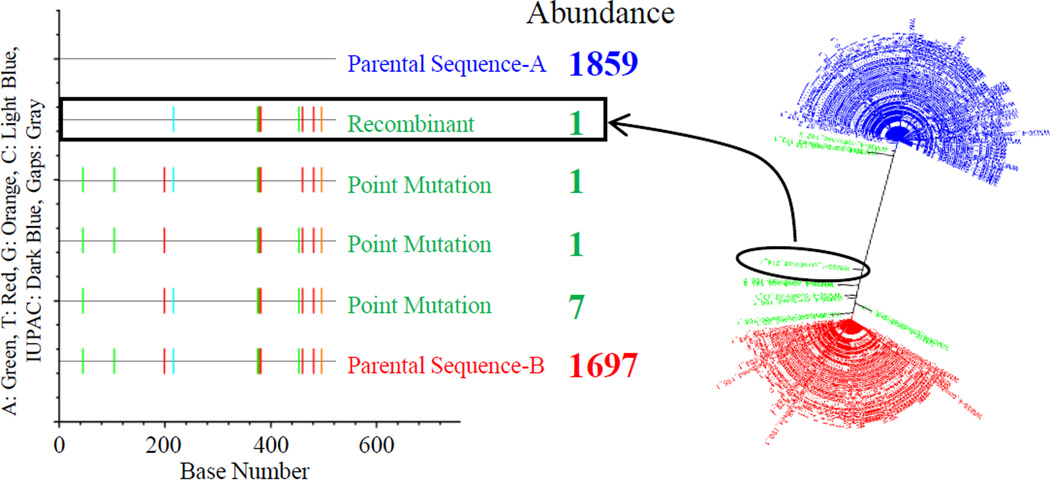
Methods: Viral RNA derived from culture wells of QVOA that scored as HIV-1 p24 capsid antigen positive were tagged with a specific barcode during cDNA synthesis, and the sequences within the V1-V3 region of the HIV-1 env gene were analyzed for diversity using the Primer ID-based paired-end MiSeq platform. We analyzed samples from a total of 19 participants, 2 initially treated with highly active antiretroviral therapy in acute infection and 17 treated during chronic infection. Phylogenetic trees were generated with all viral lineages detected from culture wells derived from each participant to determine the number of distinct viral lineages growing out in each well, thus capturing another level of information beyond the well being positive for viral antigen. The infectious units per million (IUPM) cell values estimated using a maximum likelihood approach, based on the number of distinct viral lineages detected (VOA-UDSA), were compared with those obtained from QVOA measured using limiting dilution.

Results: IUPM estimates determined by VOA-UDSA ranged from 0.14 to 3.66 and strongly correlated with the IUPM estimates determined by QVOA (r = 0.94; P < 0.0001).

Conclusions: VOA-UDSA may be an alternative readout for that currently used for QVOA.


Conflict of interest statement

The other authors have no other conflicts of interest to disclose.

Figures

Figure 1
Figure 1
A, Arbitrary abundance cut-off for the minimum abundance of individual consensus sequences. The arbitrary cut-off value, 2.5%, for the minimum abundance of individual consensus sequences is shown in dotted line with an arrowhead. B, C, and D, Viral Lineages detected in a single well. Phylogenetic trees showing examples of 2, 3, and 4 viral lineages detected in a single well are shown in B, C, and D, respectively. Trees were generated using MUSCLE (v3.8.1). Arrows indicate distinct viral lineages detected in each well.
Figure 2
Figure 2
Representative neighbor-joining phylogenetic trees of viral lineages to determine DVLs. A, The phylogenetic tree shows viral lineages detected in wells (n=8 for A1, n=5 for A2) derived from two participants in acute infection, A1 and A2. Individual wells are color coded. The tree was generated using MEGA 5.10. B, The phylogenetic tree shows viral lineages detected in wells (n=6) derived from a chronically infected participant, C11. Individual DVLs identified are indicated. Different wells are color coded and the tree was generated using MEGA 5.10. C, % DVL observed in each chronically infected participant. The horizontal dotted line indicates average % DVL.
Figure 3
Figure 3
Correlation between VOA-UDSA and QVOA. A, The IUPM estimates of 17 chronically infected participants obtained independently by VOA-UDSA and QVOA are shown. B, The IUPM estimates obtained from VOA-UDSA strongly correlate with the IUPM estimates obtained from QVOA. The statistics were obtained from the Spearman rank correlation test and linear regression analysis was used to form the best-fitting straight line. C, The IUPM estimates obtained from the two assays, VOA-UDSA and QVOA were compared by the Wilcoxon matched-pairs test.
Figure 4
Figure 4
Simulation of VOA-UDSA introduced recombination events. A representative highlighter plot and phylogenetic tree reveal the low frequency of method-introduced recombination events. Method-introduced recombination events was simulated by mixing two different RNA samples for cDNA reaction. Abundance, the number of consensus sequences, of parental sequence A and B is shown in blue and red, respectively. The number of consensus sequences of offspring generated by either recombination or point mutation is shown in green. The recombinant sequence shown in the highlighter plot and the phylogenetic tree is indicated with a box and a circle, respectively.

References

    1. Carter CC, Onafuwa-Nuga A, McNamara LA, et al. HIV-1 infects multipotent progenitor cells causing cell death and establishing latent cellular reservoirs. Nat Med. 2010;16(4):446–451. - PMC - PubMed
    1. Orenstein JM, Fox C, Wahl SM. Macrophages as a source of HIV during opportunistic infections. Science. 1997;276(5320):1857–1861. - PubMed
    1. Wightman F, Solomon A, Khoury G, et al. Both CD31(+) and CD31(−) naive CD4(+) T cells are persistent HIV type 1-infected reservoirs in individuals receiving antiretroviral therapy. J Infect Dis. 2010;202(11):1738–1748. - PubMed
    1. Chun TW, Carruth L, Finzi D, et al. Quantification of latent tissue reservoirs and total body viral load in HIV-1 infection. Nature. 1997;387(6629):183–188. - PubMed
    1. Chun TW, Engel D, Berrey MM, Shea T, Corey L, Fauci AS. Early establishment of a pool of latently infected, resting CD4(+) T cells during primary HIV-1 infection. Proc Natl Acad Sci U S A. 1998;95(15):8869–8873. - PMC - PubMed