

Spatial Characterization of Bioenergetics and Metabolism of Primordial to Preovulatory Follicles in Whole Ex Vivo Murine Ovary
- PMID: 27683265
- PMCID: PMC5315427
- DOI: 10.1095/biolreprod.116.142141
Spatial Characterization of Bioenergetics and Metabolism of Primordial to Preovulatory Follicles in Whole Ex Vivo Murine Ovary
Abstract
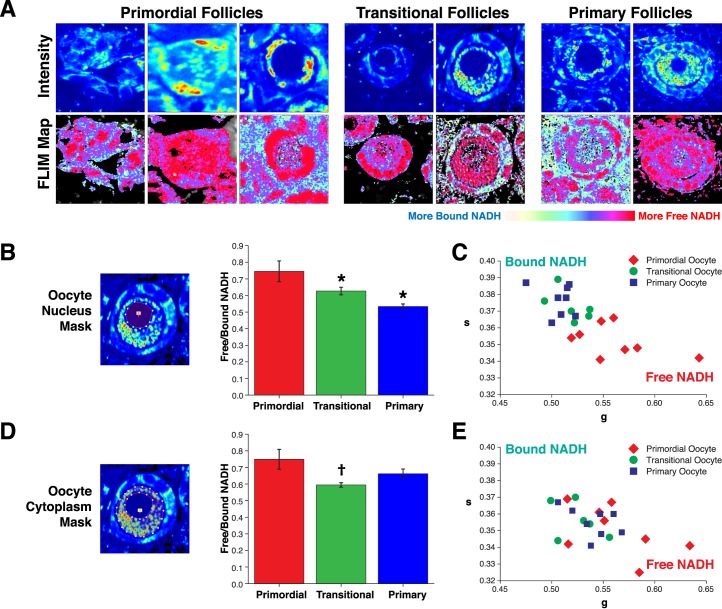
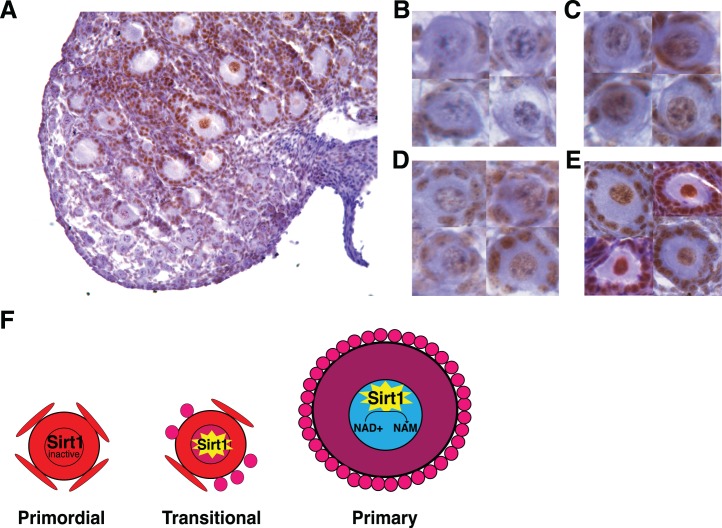
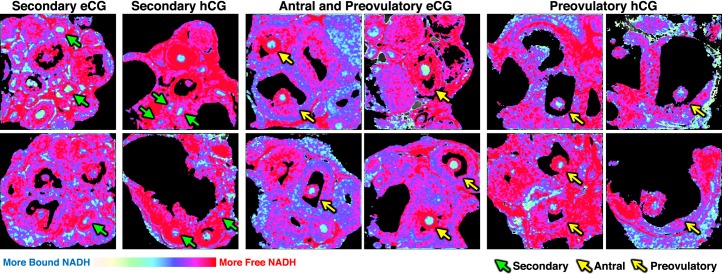
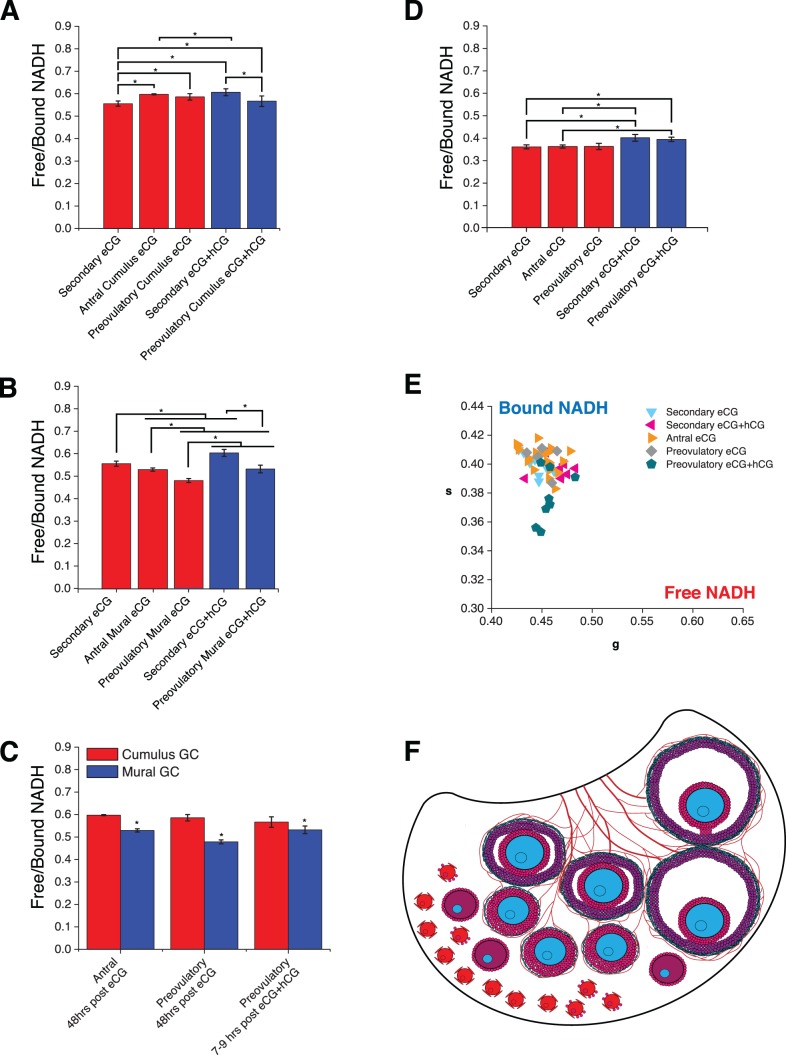
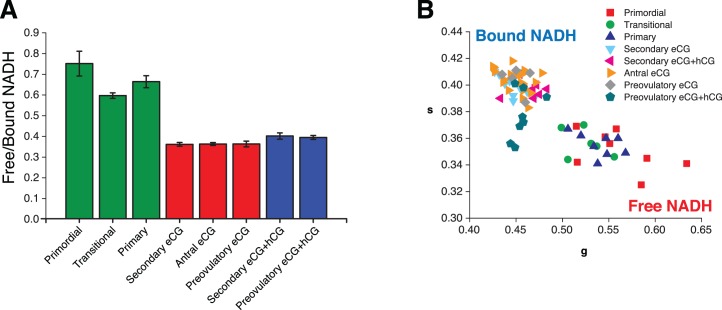
Previous work characterizing ovarian bioenergetics has defined follicular metabolism by measuring metabolic by-products in culture media. However, culture conditions perturb the native state of the follicle, and these methods do not distinguish between metabolism occurring within oocytes or granulosa cells. We applied the phasor approach to fluorescence lifetime imaging microscopy (phasor FLIM) at 740-nm two-photon excitation to examine the spatial distribution of free and protein-bound nicotinamide adenine dinucleotide hydride (NADH) during primordial through preovulatory stages of follicular development in fresh ex vivo murine neonatal and gonadotropin stimulated prepubertal ovaries. We obtained subcellular resolution phasor FLIM images of primordial through primary follicles and quantified the free/bound NADH ratio (relative NADH/NAD+) separately for oocyte nucleus and oocyte cytoplasm. We found that dynamic changes in oocyte nucleus free/bound NADH paralleled the developmental maturation of primordial to primary follicles. Immunohistochemistry of NAD+-dependent deacetylase SIRTUIN 1 (SIRT1) in neonatal ovary revealed that increasing SIRT1 expression in oocyte nuclei was inversely related to decreasing free/bound NADH during the primordial to primary follicle transition. We characterized oocyte metabolism at these early stages to be NADH producing (glycolysis/Krebs). We extended the results of prior studies to show that cumulus and mural granulosa cell metabolism in secondary through preovulatory follicles is mainly NADH producing (glycolysis/Krebs cycle), while oocyte metabolism is mainly NADH consuming (oxidative phosphorylation). Taken together, our data characterize dynamic changes in free/bound NADH and SIRT1 expression during early follicular development and confirm results from previous studies defining antral and preovulatory follicle metabolism in culture.
Keywords: FLIM; Krebs cycle; NADH; cumulus cells; folliculogenesis; glycolysis; granulosa cells; oocyte; oxidative phosphorylation; phasor approach to fluorescence lifetime imaging microscopy; sirtuin 1.
© 2016 by the Society for the Study of Reproduction, Inc.
Figures

Comment in
-
A New Window into Ovarian Follicle Development.Biol Reprod. 2016 Dec;95(6):136. doi: 10.1095/biolreprod.116.146647. Epub 2016 Nov 9. Biol Reprod. 2016. PMID: 28007696 No abstract available.
Similar articles
-
Developmental regulation of histone H3 methylation at lysine 4 in the porcine ovary.Reproduction. 2008 Jun;135(6):829-38. doi: 10.1530/REP-07-0448. Reproduction. 2008. PMID: 18502896
-
Cell type- and stage-specific changes in HOXA7 protein expression in human ovarian folliculogenesis: possible role of GDF-9.Differentiation. 2006 Feb;74(1):1-10. doi: 10.1111/j.1432-0436.2006.00053.x. Differentiation. 2006. PMID: 16466395
-
Regulation of ovarian primordial follicle assembly and development by estrogen and progesterone: endocrine model of follicle assembly.Endocrinology. 2003 Aug;144(8):3329-37. doi: 10.1210/en.2002-0131. Endocrinology. 2003. PMID: 12865310
-
[Reconsidering the roles of female germ cells in ovarian development and folliculogenesis].Biol Aujourdhui. 2011;205(4):223-33. doi: 10.1051/jbio/2011022. Epub 2012 Jan 19. Biol Aujourdhui. 2011. PMID: 22251857 Review. French.
-
Ovarian follicular and luteal physiology.Int Rev Physiol. 1980;22:117-201. Int Rev Physiol. 1980. PMID: 6248477 Review.
Cited by
-
Pair Correlation Analysis Maps the Dynamic Two-Dimensional Organization of Natural Killer Cell Receptors at the Synapse.ACS Nano. 2019 Dec 24;13(12):14274-14282. doi: 10.1021/acsnano.9b07486. Epub 2019 Dec 9. ACS Nano. 2019. PMID: 31747251 Free PMC article.
-
Dynamic genome-scale cell-specific metabolic models reveal novel inter-cellular and intra-cellular metabolic communications during ovarian follicle development.BMC Bioinformatics. 2019 Jun 10;20(1):307. doi: 10.1186/s12859-019-2825-2. BMC Bioinformatics. 2019. PMID: 31182013 Free PMC article.
-
Ovarian aging: energy metabolism of oocytes.J Ovarian Res. 2024 May 31;17(1):118. doi: 10.1186/s13048-024-01427-y. J Ovarian Res. 2024. PMID: 38822408 Free PMC article. Review.
-
Metabolic imaging of human cumulus cells reveals associations among metabolic profiles of cumulus cells, patient clinical factors, and oocyte maturity.Fertil Steril. 2021 Dec;116(6):1651-1662. doi: 10.1016/j.fertnstert.2021.07.1204. Epub 2021 Sep 2. Fertil Steril. 2021. PMID: 34481639 Free PMC article.
-
The impact of offspring and maternal obesogenic diets on adult offspring oocyte mitochondrial morphology in primordial and preantral follicles.PLoS One. 2024 Jun 27;19(6):e0305912. doi: 10.1371/journal.pone.0305912. eCollection 2024. PLoS One. 2024. PMID: 38935642 Free PMC article.
References
-
- Sugiura K, Pendola FL, Eppig JJ. Oocyte control of metabolic cooperativity between oocytes and companion granulosa cells: energy metabolism. Dev Biol. 2005;279:20–30. - PubMed
-
- Harris SE, Adriaens I, Leese HJ, Gosden RG, Picton HM. Carbohydrate metabolism by murine ovarian follicles and oocytes grown in vitro. Reproduction. 2007;134:415–424. - PubMed
-
- Collado-Fernandez E, Picton HM, Dumollard R. Metabolism throughout follicle and oocyte development in mammals. Int J Dev Biol. 2012;56:799–808. - PubMed
Publication types
MeSH terms
Substances
Grants and funding
LinkOut - more resources
Full Text Sources
Other Literature Sources
Molecular Biology Databases
