. 2016 Sep;6(3):313-21.
doi: 10.1086/688516.

Hemodynamic evidence of vascular remodeling in combined post- and precapillary pulmonary hypertension

Affiliations

Hemodynamic evidence of vascular remodeling in combined post- and precapillary pulmonary hypertension

Tufik R Assad et al. Pulm Circ. 2016 Sep.

Abstract

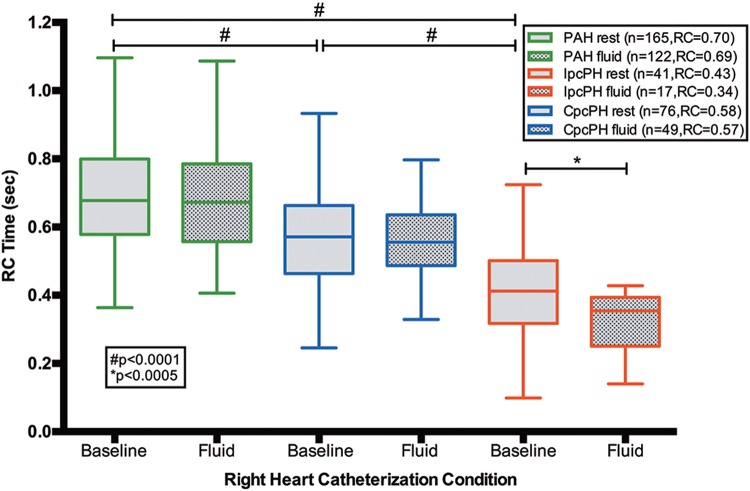
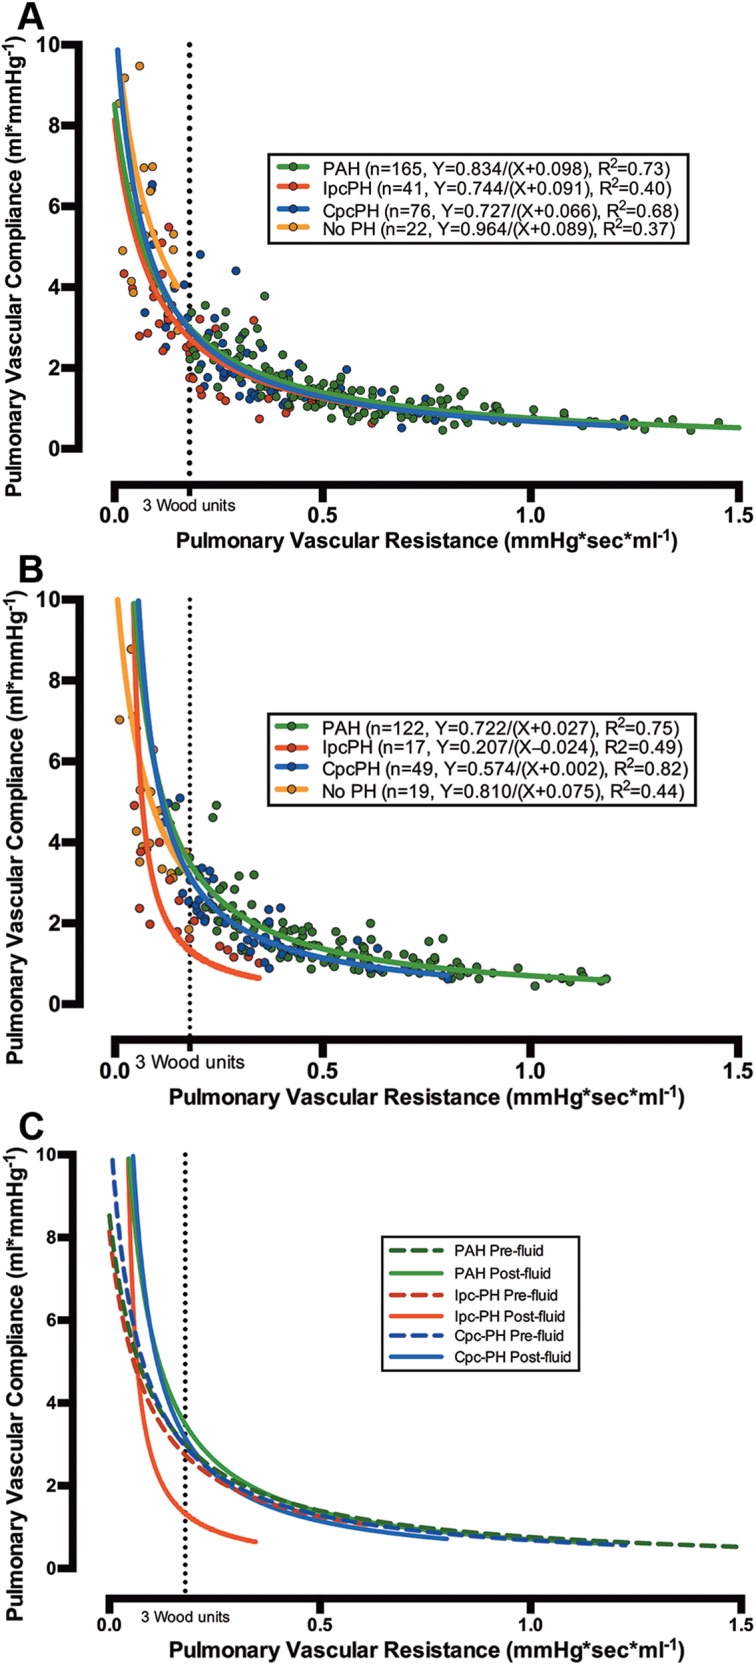
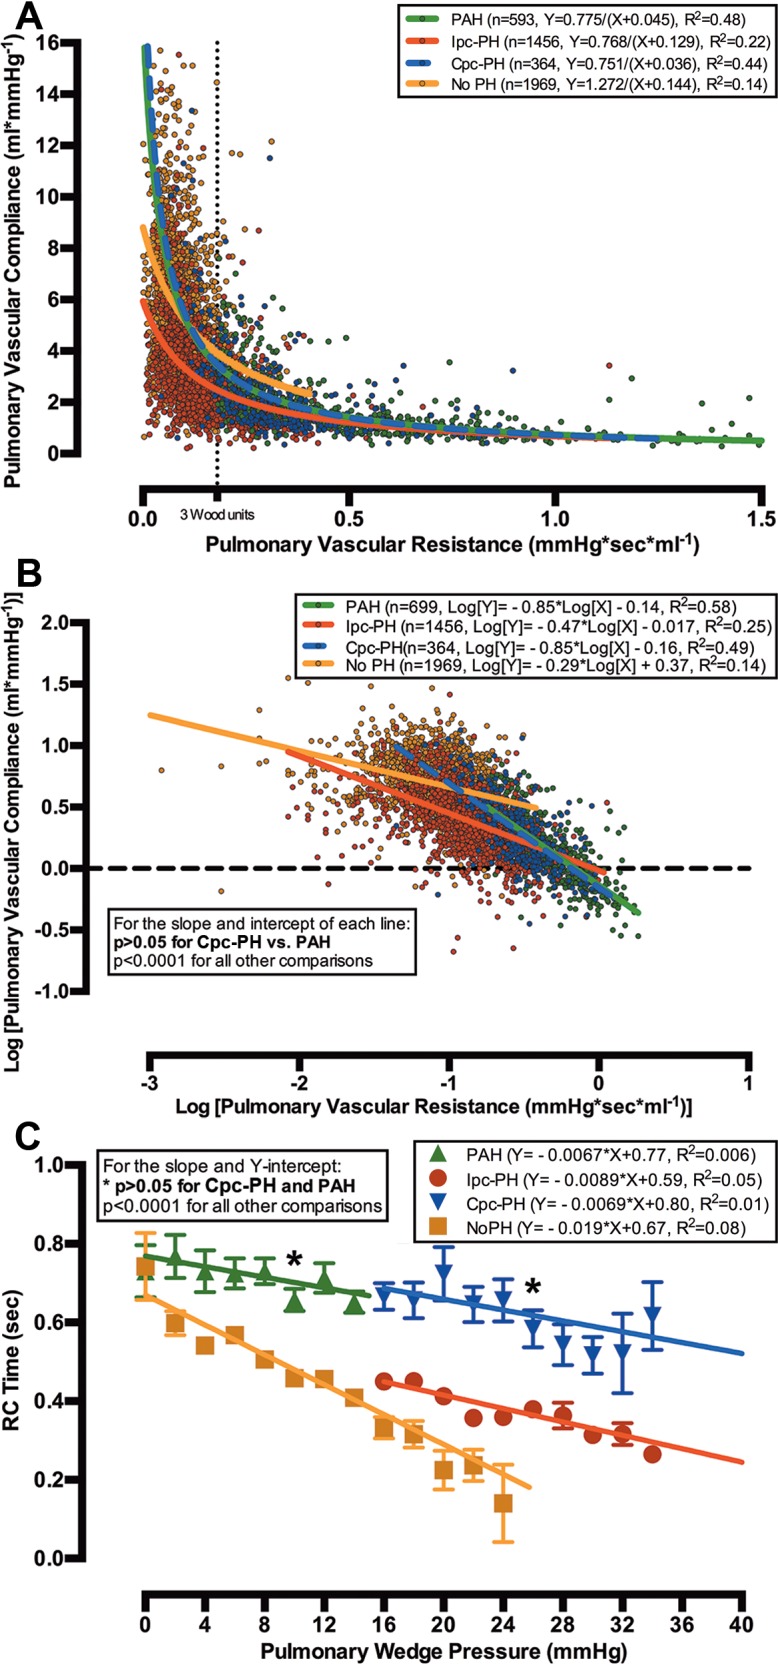
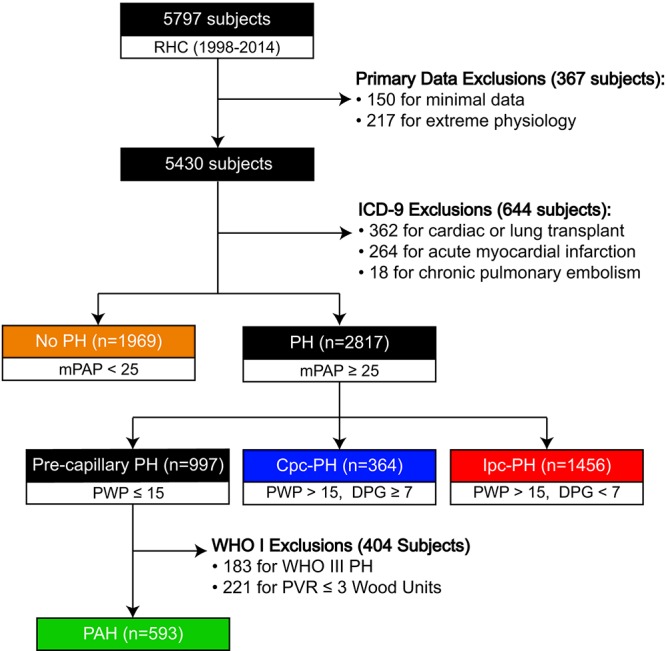
Although commonly encountered, patients with combined postcapillary and precapillary pulmonary hypertension (Cpc-PH) have poorly understood pulmonary vascular properties. The product of pulmonary vascular resistance and compliance, resistance-compliance (RC) time, is a measure of pulmonary vascular physiology. While RC time is lower in postcapillary PH than in precapillary PH, the RC time in Cpc-PH and the effect of pulmonary wedge pressure (PWP) on RC time are unknown. We tested the hypothesis that Cpc-PH has an RC time that resembles that in pulmonary arterial hypertension (PAH) more than that in isolated postcapillary PH (Ipc-PH). We analyzed the hemodynamics of 282 consecutive patients with PH referred for right heart catheterization (RHC) with a fluid challenge from 2004 to 2013 (cohort A) and 4,382 patients who underwent RHC between 1998 and 2014 for validation (cohort B). Baseline RC time in Cpc-PH was higher than that in Ipc-PH and lower than that in PAH in both cohorts (P < 0.001). In cohort A, RC time decreased after fluid challenge in patients with Ipc-PH but not in those with PAH or Cpc-PH (P < 0.001). In cohort B, the inverse relationship of pulmonary vascular compliance and resistance, as well as that of RC time and PWP, in Cpc-PH was similar to that in PAH and distinct from that in Ipc-PH. Our findings demonstrate that patients with Cpc-PH have pulmonary vascular physiology that resembles that of patients with PAH more than that of Ipc-PH patients. Further study is warranted to identify determinants of vascular remodeling and assess therapeutic response in this subset of PH.

Keywords: postcapillary; precapillary; pulmonary hypertension; pulmonary vascular compliance; pulmonary vascular resistance; resistance-compliance time.


Figures

Figure 1
Figure 1
Resistance-compliance (RC) time remains fixed in combined postcapillary and precapillary pulmonary hypertension (CpcPH) and pulmonary arterial hypertension (PAH) after fluid challenge in cohort A. In cohort A, baseline RC times are different between PAH, CpcPH, and isolated postcapillary pulmonary hypertension (IpcPH; all P < 0.0001). After fluid challenge, RC time remains fixed in patients with PAH or CpcPH (P > 0.05) but is significantly reduced in patients with IpcPH (P < 0.0005). Data presented as a Tukey box plot.
Figure 2
Figure 2
Relationship of pulmonary vascular resistance (PVR) and compliance (PVC) in combined postcapillary and precapillary pulmonary hypertension (CpcPH) and pulmonary arterial hypertension (PAH), as distinct from isolated postcapillary pulmonary hypertension (IpcPH), following fluid challenge in cohort A. The X-Y scatter plots of PVC versus PVR for patients in cohort A at rest (303 patients; A) and after fluid challenge (207 patients; B) are shown (colored circles). The data were modeled with a nonlinear inverse regression with offset (bold lines in all plots). The curve for patients with IpcPH was displaced to the left after fluid challenge and did not change for patients with PAH and CpcPH (B, C). The dotted line represents 3 Wood units.
Figure 3
Figure 3
Relationships of pulmonary vascular resistance (PVR) and compliance (PVC) and of resistance-compliance (RC) time and pulmonary wedge pressure (PWP) in combined postcapillary and precapillary pulmonary hypertension (Cpc-PH) and pulmonary arterial hypertension (PAH) are similar in cohort B. The X-Y scatter plot of PVC versus PVR for all 4,382 patients in cohort B (colored circles) is modeled with a nonlinear inverse regression with offset (bold lines; A). When PVR and PVC were logarithmically transformed (colored circles), the slope and Y-intercept of the linear regression (bold lines) for patients with Cpc-PH and PAH were similar (P > 0.05), and they were different from those of patients with isolated postcapillary pulmonary hypertension (Ipc-PH) or without pulmonary hypertension (No PH; B). The relationship of RC time to PWP for Cpc-PH was identical to that for PAH (P > 0.05) and distinct from that for Ipc-PH at every PWP (P < 0.0001; C).
Figure S1
Figure S1
Flow diagram for cohort B. This schematic represents the initial data set and subsequent exclusions that led to our categorization of cohort B. The disease classification is based on the 2013 Nice World Health Symposium on Pulmonary Hypertension. All units are mmHg, unless stated otherwise. Cpc-PH: combined postcapillary and precapillary pulmonary hypertension; DPG: diastolic pulmonary artery–to–pulmonary wedge pressure gradient; ICD-9: International Classification of Diseases, Ninth Revision; Ipc-PH: isolated postcapillary pulmonary hypertension; mPAP: mean pulmonary artery pressure; PAH: pulmonary arterial hypertension; PH: pulmonary hypertension; PVR: pulmonary vascular resistance; PWP: pulmonary wedge pressure; RHC: right heart catheterization; WHO III PH: World Health Organization group III–V PH.
Figure S2
Figure S2
Different methods of estimating pulmonary wedge pressure (PWP) yield similar results. With Bland-Altman analysis, the manual and computer-generated mean (CGM) PWPs from 116 patients in cohort A demonstrated excellent agreement, with a slight underestimation of the CGM relative to the manual at baseline (−2.1 ± 2.6 mmHg; A) and after fluid challenge (−2.7 ± 3.3 mmHg; B).

References

    1. Robbins IM, Hemnes AR, Pugh ME, Brittain EL, Zhao DX, Piana RN, Fong PP, Newman JH. High prevalence of occult pulmonary venous hypertension revealed by fluid challenge in pulmonary hypertension. Circ Heart Fail 2014;7(1):116–122. - PMC - PubMed
    1. Fox BD, Shimony A, Langleben D, Hirsch A, Rudski L, Schlesinger R, Eisenberg MJ, et al. High prevalence of occult left heart disease in scleroderma-pulmonary hypertension. Eur Respir J 2013;42(4):1083–1091. - PubMed
    1. Fujimoto N, Borlaug BA, Lewis GD, Hastings JL, Shafer KM, Bhella PS, Carrick-Ranson G, Levine BD. Hemodynamic responses to rapid saline loading: the impact of age, sex, and heart failure. Circulation 2013;127(1):55–62. - PMC - PubMed
    1. Andersen MJ, Olson TP, Melenovsky V, Kane GC, Borlaug BA. Differential hemodynamic effects of exercise and volume expansion in people with and without heart failure. Circ Heart Fail 2015;8(1):41–48. - PubMed
    1. Naeije R, Vachiéry JL, Yerly P, Vanderpool R. The transpulmonary pressure gradient for the diagnosis of pulmonary vascular disease. Eur Respir J 2013;41(1):217–223. - PubMed

LinkOut - more resources