. 2016 Nov 1;197(9):3650-3661.
doi: 10.4049/jimmunol.1600820. Epub 2016 Sep 28.

Adipose Tissue Dendritic Cells Are Independent Contributors to Obesity-Induced Inflammation and Insulin Resistance

Affiliations

Adipose Tissue Dendritic Cells Are Independent Contributors to Obesity-Induced Inflammation and Insulin Resistance

Kae Won Cho et al. J Immunol. .

Abstract

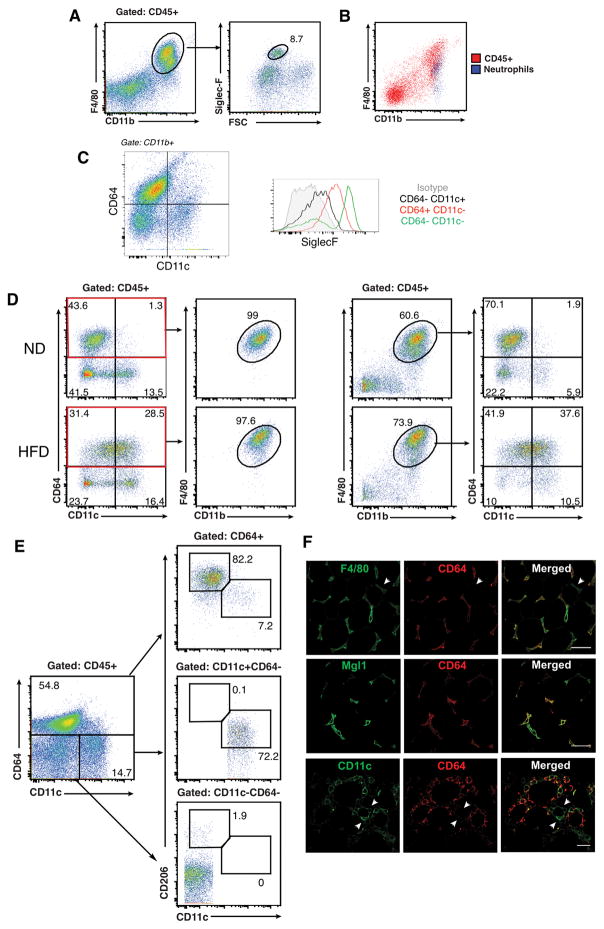
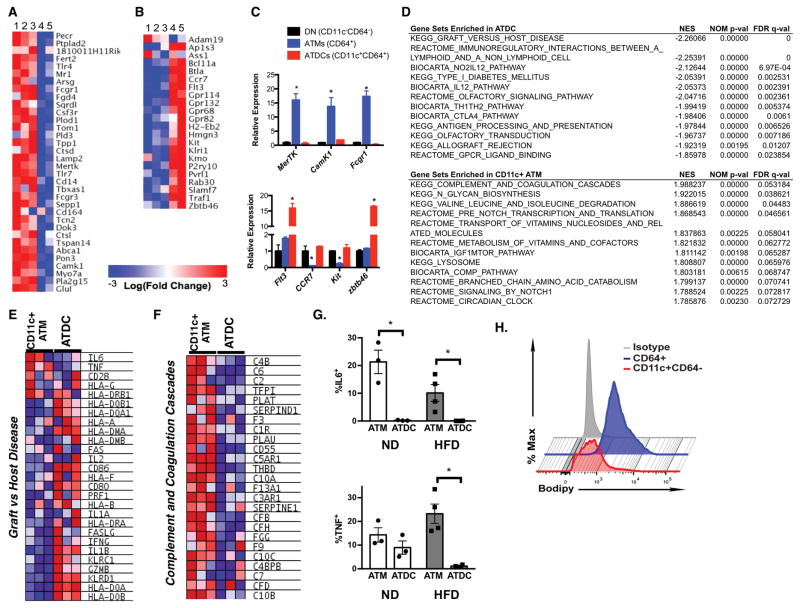
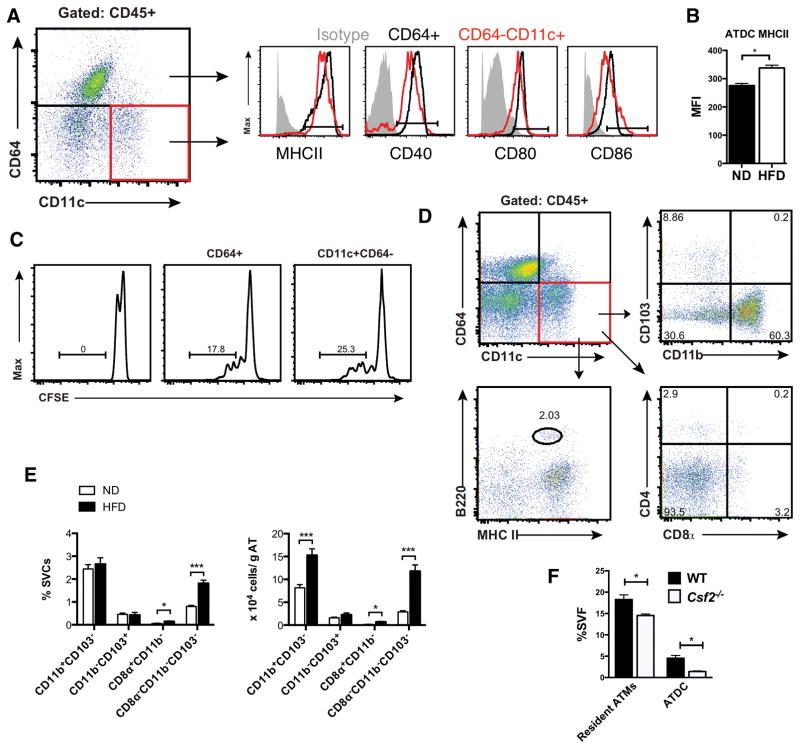
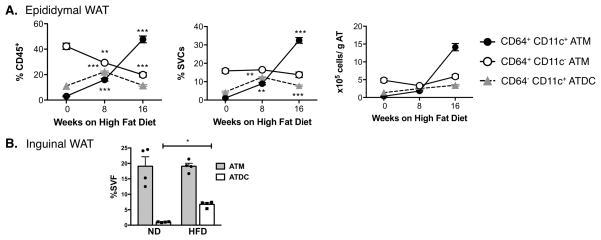
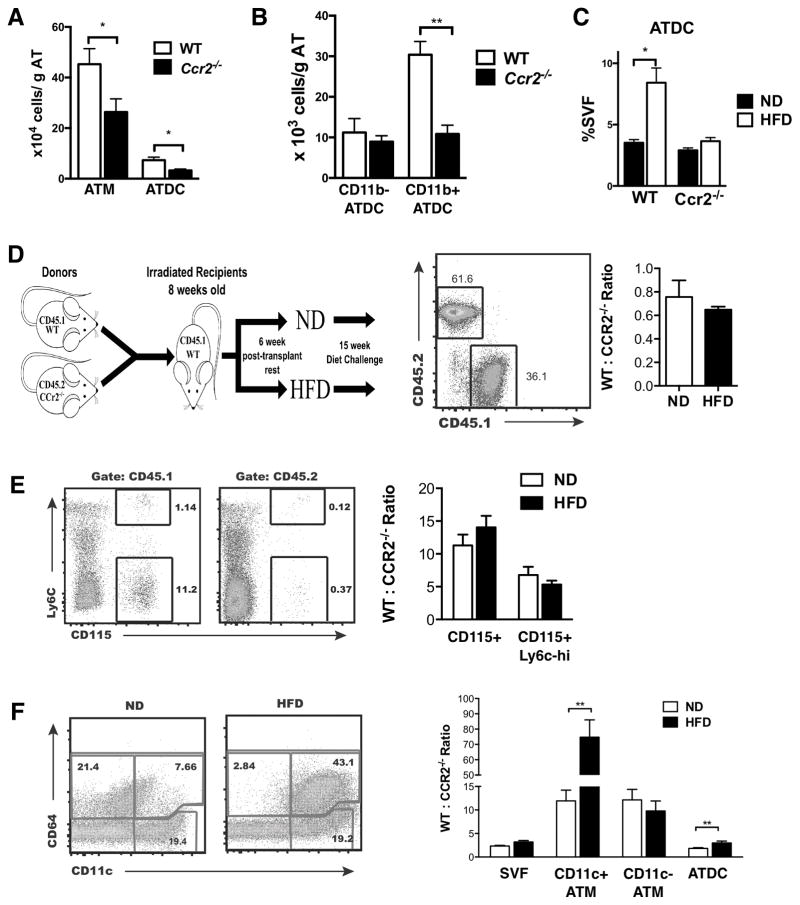
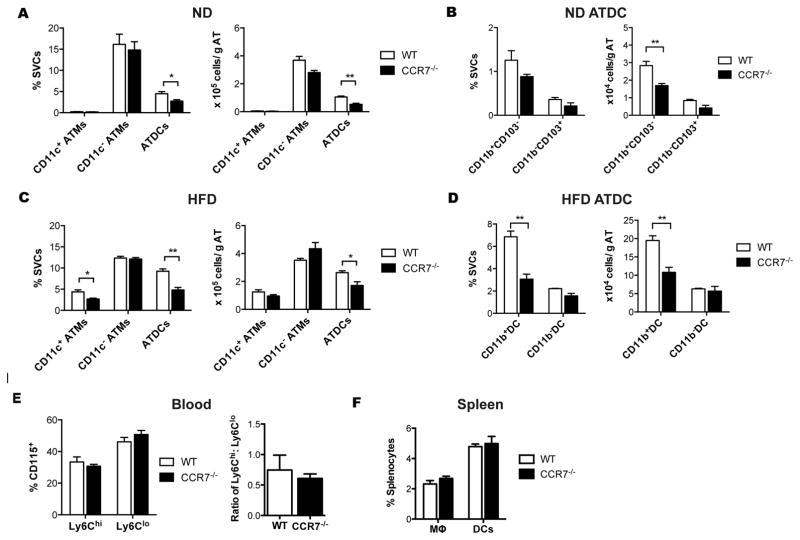
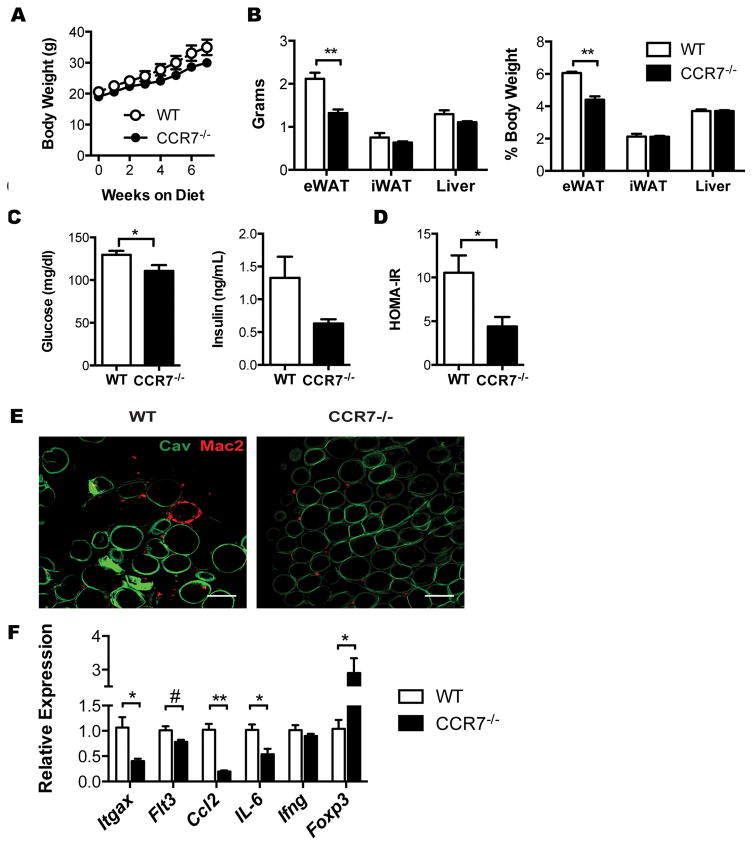
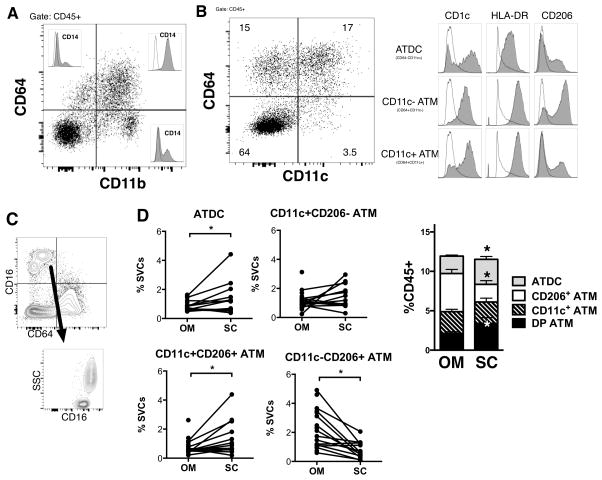
Dynamic changes of adipose tissue leukocytes, including adipose tissue macrophage (ATM) and adipose tissue dendritic cells (ATDCs), contribute to obesity-induced inflammation and metabolic disease. However, clear discrimination between ATDC and ATM in adipose tissue has limited progress in the field of immunometabolism. In this study, we use CD64 to distinguish ATM and ATDC, and investigated the temporal and functional changes in these myeloid populations during obesity. Flow cytometry and immunostaining demonstrated that the definition of ATM as F4/80+CD11b+ cells overlaps with other leukocytes and that CD45+CD64+ is specific for ATM. The expression of core dendritic cell genes was enriched in CD11c+CD64- cells (ATDC), whereas core macrophage genes were enriched in CD45+CD64+ cells (ATM). CD11c+CD64- ATDCs expressed MHC class II and costimulatory receptors, and had similar capacity to stimulate CD4+ T cell proliferation as ATMs. ATDCs were predominantly CD11b+ conventional dendritic cells and made up the bulk of CD11c+ cells in adipose tissue with moderate high-fat diet exposure. Mixed chimeric experiments with Ccr2-/- mice demonstrated that high-fat diet-induced ATM accumulation from monocytes was dependent on CCR2, whereas ATDC accumulation was less CCR2 dependent. ATDC accumulation during obesity was attenuated in Ccr7-/- mice and was associated with decreased adipose tissue inflammation and insulin resistance. CD45+CD64+ ATM and CD45+CD64-CD11c+ ATDCs were identified in human obese adipose tissue and ATDCs were increased in s.c. adipose tissue compared with omental adipose tissue. These results support a revised strategy for unambiguous delineation of ATM and ATDC, and suggest that ATDCs are independent contributors to adipose tissue inflammation during obesity.


Figures

Figure 1
Figure 1. CD64 is a specific adipose tissue macrophage (ATM) marker in lean and obese mice
Analysis of SVF from eWAT in C57BL/6 mice were fed with ND of HFD for 20 weeks. (A) Flow cytometry analysis of eosinophils (siglec-F+ and high side scatter) on CD11b+F480+ cells after gating CD45+ SVFs from lean mice. (B) Overlap between F480+ CD45+ SVF cells (red) and neutrophils (blue) from obese mice. (C) Analysis of Siglec-F expression in CD64 stratified SVF cells. (D) Comparison of CD64 and F4/80 staining in SVF from ND and HFD fed mice. (E) Flow analysis of CD11c and CD206 expression in CD64+ (top), CD11c+CD64(middle) and CD11cCD64 (bottom) SVF cells from lean mice. (F) Immunofluorescence analysis of CD64+ (red) cells in eWAT from HFD-fed mice. Scale bar = 100 μm. Data are representative of at least three independent experiments with three mice per group.
Figure 2
Figure 2. Gene expression profiling of ATM and ATDCs
Microarray analysis heat map of ImmGen (A) macrophage core signature genes and (B) dendritic cell core signature genes from adipose tissue myeloid cells. 1, lean ATM CD11cCD64+; 2, obese ATM CD11cCD64+; 3, obese ATM CD11c+CD64+; 4, lean ATDC CD11c+CD64; 5, obese ATDC CD11c+CD64. (C) qPCR analysis of macrophage specific genes (upper panel) and DC specific genes (lower panel) in CD11cCD64(DN), CD64+(ATM), and CD11c+CD64 (ATDC) cells from eWAT of obese mice. (D) GSEA pathways enriched in ATDC and CD11c+ ATMs. Heat maps shown for differentially expresssed genes for (E) Graft_versus_host disease and (F) Complement_and_Coagulation_Cascade. (G) Intracellular cytokine staining for ATM and ATDCs from ND and HFD fed mice EWAT. (H) Flow cytometry analysis of intracellular lipid content in CD64+ ATM and CD11c+CD64 ATDC from obese mice. Data are from 2 independent experiments with three mice per group. * p<0.05.
Figure 3
Figure 3. Myeloid DCs predominate in adipose tissue
(A) Flow cytometry analysis of MHCII and costimulatory molecules in CD64+ ATM (blue) and CD11c+CD64 ATDC (red) from eWAT. (B) MHCII expression in ATDC in ND and HFD mice. (C) OTII- CD4+ T cell proliferation after incubation with OVA pulsed CD64+ ATM (middle) and CD11c+CD64 ATDC (right). One representative experiment from three independent replicates is shown. (D) ATDC subsets based on CD103, CD11b, CD4, CD8α, B220 and MHCII. (E) Quantitation of ATDC subsets in eWAT from ND and HFD fed C57 mice. (F) Quantitation of ATM and ATDC in lean WT and Csf2−/− mice *, p<0.05; ***, p<0.001.
Figure 4
Figure 4. Time course of ATM and ATDC accumulation in adipose tissue with HFD induced obesity
C57BL/6 male mice were fed high-fat diet (HFD) for various time periods (0, 8, and 16 weeks). (A) eWAT SVFs quantified for CD11c+ ATM, CD11c ATM and ATDC by flow cytometry normalized for adipose tissue mass. (B) Quantitation of ATM and ATDC in inguinal WAT (iWAT) at 16 weeks of HFD. **, p<0.05; ***, p<0.001.
Figure 5
Figure 5. CCR2 is required for obesity-induced CD11c+ ATM and ATDC migration into adipose tissue
(A) Quantitation of CD11c+ ATM, CD11c ATM and ATDC in eWAT from WT and Ccr2−/− mice. (B) Quantitation of CD11b+ and CD11b ATDC subsets in eWAT from WT and Ccr2−/− mice. (C) ATM and ATDC content in WT and Ccr2−/− mice after 2 weeks of ND or HFD feeding. (D) Diagram of mixed chimera experiment design. Ccr2−/− (CD45.2) and WT (CD45.1) BM mixed in a 1:1 ratio prior to injection in irradiated recipients. Chimerism analysis of blood leukocytes shown. (E) Frequency and ratio of CD45.1 (WT) and CD45.2 (Ccr2−/−) in blood monocytes from lean and obese (15 week HFD) chimeric mice. (F) Frequency and CD45.1: CD45.2 ratio in CD11c+ ATM, CD11c ATM and ATDC in eWAT. **, p<0.01 vs ND.
Figure 6
Figure 6. CCR7 is required for ATDC accumulation during diet-induced obesity
(A) Quantitation of ATM and ATDC in eWAT from chow fed WT and Ccr7−/− mice. (B) Quantitation of CD11b+CD103 and CD11b CD103+ ATDC subsets in eWAT from WT and Ccr7−/− mice. (C) Quantitation of CD11c+ ATM, CD11c ATM and ATDC in eWAT from WT and Ccr7−/− mice fed HFD for 8 weeks. (D) Quantitation of CD11b+ and CD11b ATDC subsets in eWAT from WT and Ccr7−/− HFD fed mice. (E) Frequency of Ly6hi and Ly6lo blood monocytes from WT and Ccr7−/− mice. (F) Frequency of macrophages and dendritic cells in spleen from WT and Ccr7−/−. *, p<0.05; **,p<0.01.
Figure 7
Figure 7. CCR7-deficient mice are protected from HFD-induced insulin resistance and adipose tissue inflammation
(A) Body weights of WT and Ccr7−/− mice during 8 weeks HFD feeding. (B) Organ weights at the end of HFD exposure. (C) Fasting blood glucose and plasma insulin levels. (D) HOMA-IR in WT and Ccr7−/−mice fed and HFD for 8 weeks. (E) Immunofluorescence imaging of Mac2+ ATM (red) and caveolin+ adipocytes (green) in eWAT. Scale bar = 100μm. (F) Expression of inflammatory genes in eWAT from HFD-fed WT and Ccr7−/− mice. *, p<0.05; **,p<0.01; #=0.06.
Figure 8
Figure 8. CD64 CD11c+ ATDC are enriched in subcutaneous adipose tissue in obese humans
(A) SVFs were isolated from human omental (OM) and subcutaneous (SC) adipose tissue and analyzed by flow cytometry. Analysis of CD64 expressing cells and overlap with CD14 in OM. A representative plot of three independent experiments is shown. (B) Marker expression of CD64 CD11c+ ATDC, CD64+ CD11c ATM and CD64+ CD11c+ ATM in OM. (C) Contour plot showing CD16 and CD64. (D) Frequency of ATDC, CD11c+CD206 ATM, CD11c+CD206+ ATM and CD11cCD206+ ATM in paired OM and SC adipose tissue from obese patients. (n=10~14). *, p<0.05 vs OM

References

    1. Mathis D. Immunological goings-on in visceral adipose tissue. Cell Metab. 2013;17:851–859. - PMC - PubMed
    1. Lumeng CN, Saltiel AR. Inflammatory links between obesity and metabolic disease. J Clin Invest. 2011;121:2111–2117. - PMC - PubMed
    1. Lumeng CN. Innate immune activation in obesity. Mol Aspects Med. 2013;34:12–29. - PMC - PubMed
    1. Skinner AC, Steiner MJ, Henderson FW, Perrin EM. Multiple markers of inflammation and weight status: cross-sectional analyses throughout childhood. Pediatrics. 2010;125:e801–809. - PMC - PubMed
    1. Poitou C, Dalmas E, Renovato M, Benhamo V, Hajduch F, Abdennour M, Kahn JF, Veyrie N, Rizkalla S, Fridman WH, Sautes-Fridman C, Clement K, Cremer I. CD14dimCD16+ and CD14+CD16+ monocytes in obesity and during weight loss: relationships with fat mass and subclinical atherosclerosis. Arterioscler Thromb Vac Biol. 2011;31:2322–2330. - PubMed

Publication types