. 2016 Dec 1;116(6):2869-2881.
doi: 10.1152/jn.00104.2016. Epub 2016 Sep 28.

Effects of high-frequency stimulation of the internal pallidal segment on neuronal activity in the thalamus in parkinsonian monkeys

Affiliations

Effects of high-frequency stimulation of the internal pallidal segment on neuronal activity in the thalamus in parkinsonian monkeys

Stefan Kammermeier et al. J Neurophysiol. .

Abstract

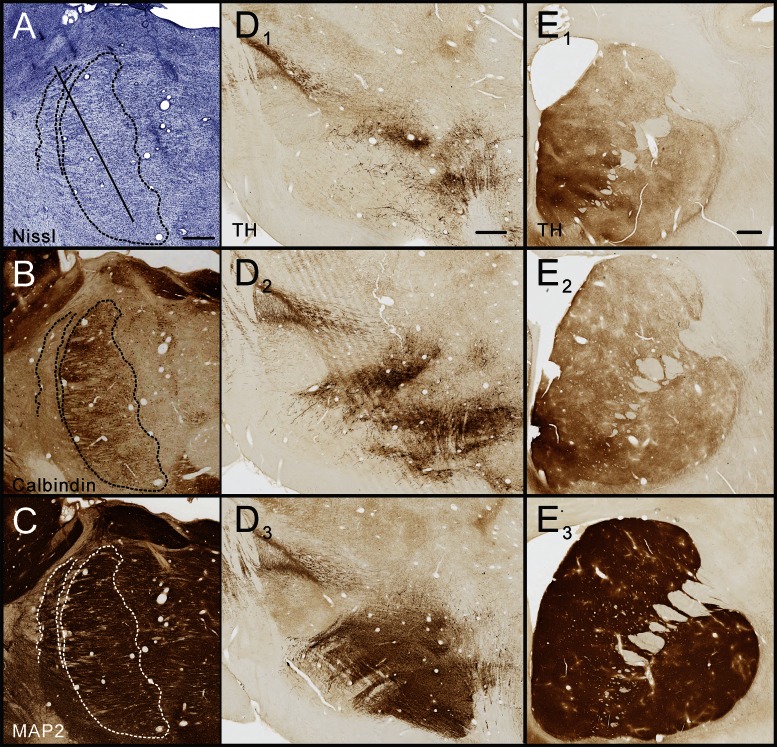
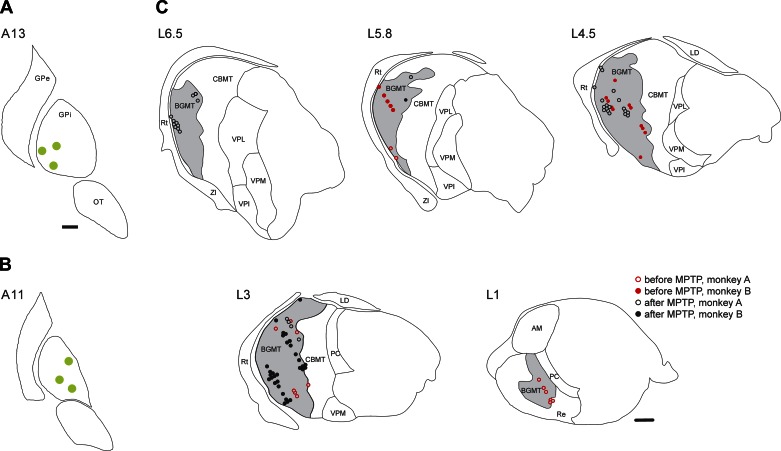
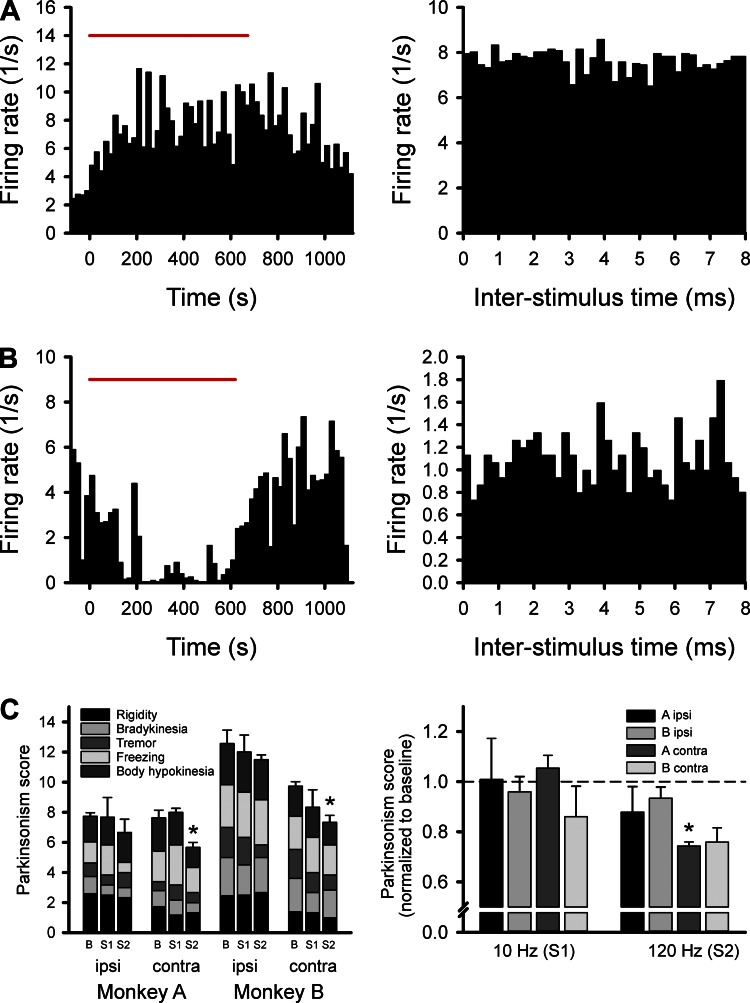
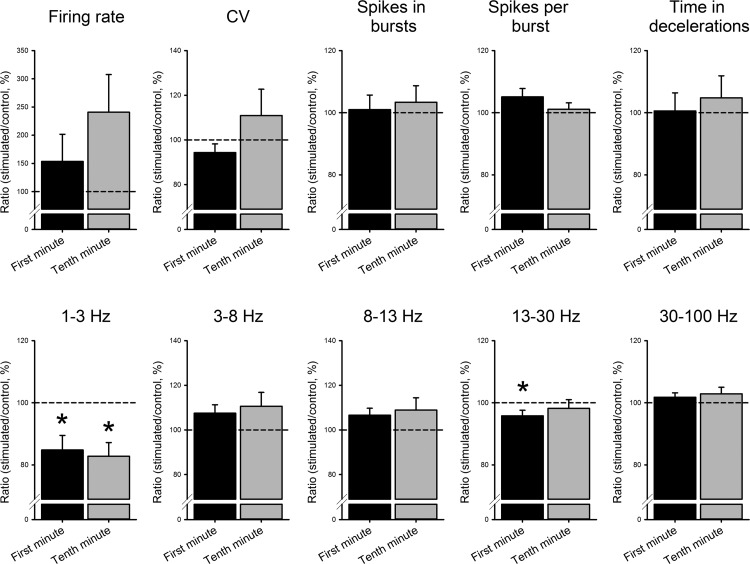
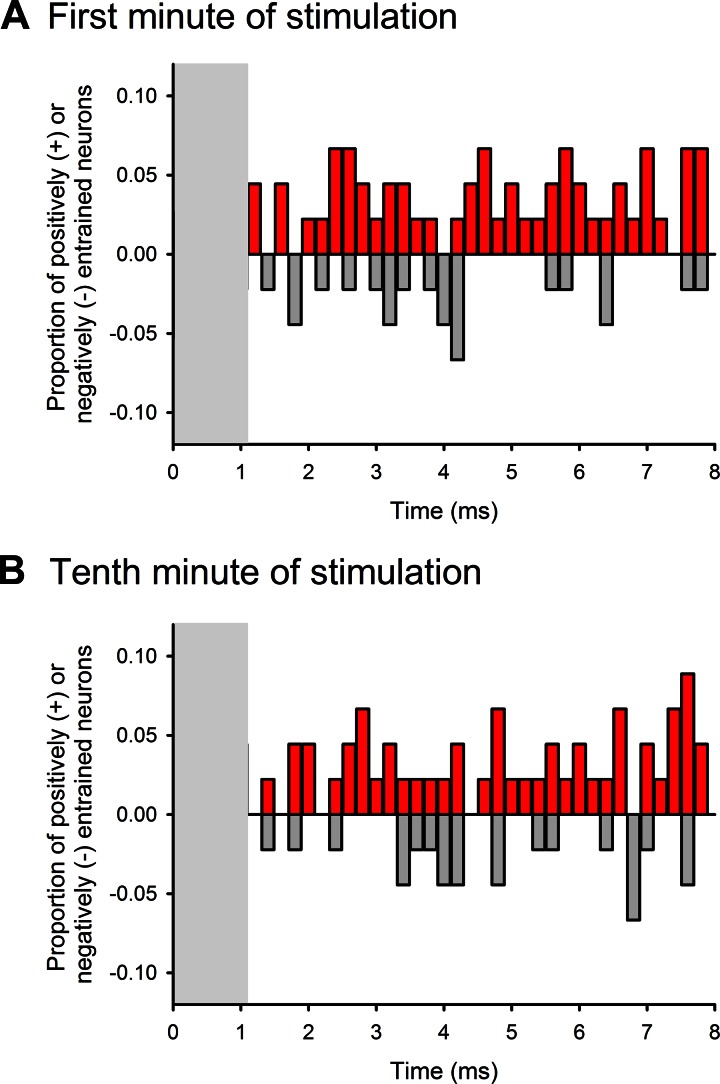
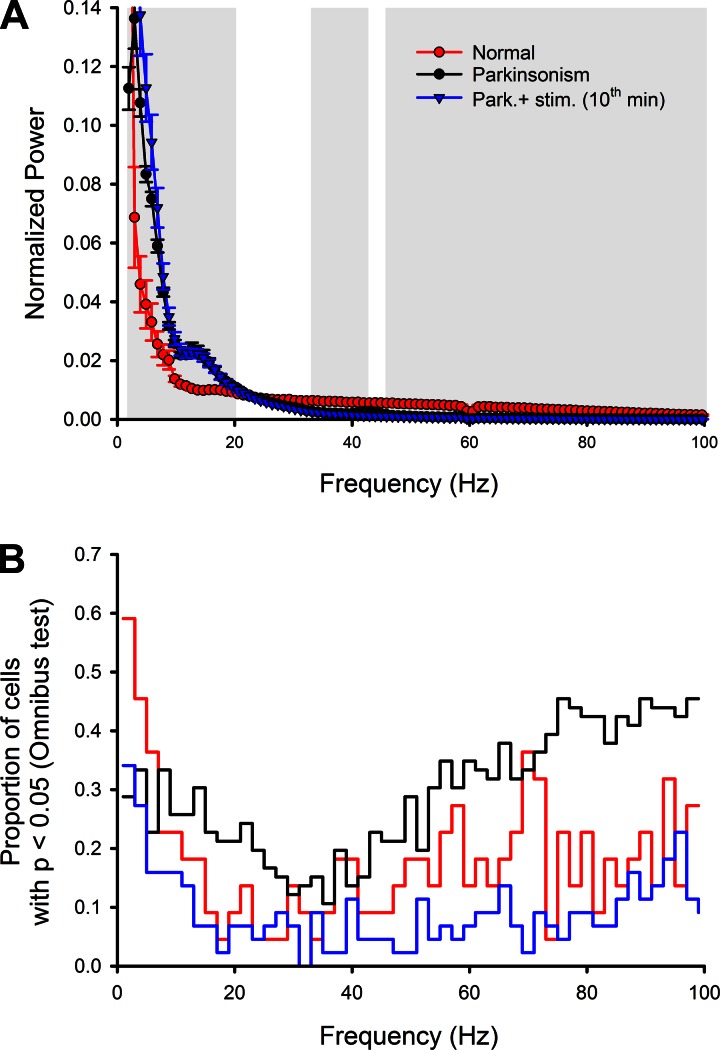
Deep brain stimulation of the internal globus pallidus (GPi) is a major treatment for advanced Parkinson's disease. The effects of this intervention on electrical activity patterns in targets of GPi output, specifically in the thalamus, are poorly understood. The experiments described here examined these effects using electrophysiological recordings in two Rhesus monkeys rendered moderately parkinsonian through treatment with 1-methyl-4-phenyl-1,2,3,6-tetrahydropyridine (MPTP), after sampling control data in the same animals. Analysis of spontaneous spiking activity of neurons in the basal ganglia-receiving areas of the ventral thalamus showed that MPTP-induced parkinsonism is associated with a reduction of firing rates of segments of the data that contained neither bursts nor decelerations, and with increased burst firing. Spectral analyses revealed an increase of power in the 3- to 13-Hz band and a reduction in the γ-range in the spiking activity of these neurons. Electrical stimulation of the ventrolateral motor territory of GPi with macroelectrodes, mimicking deep brain stimulation in parkinsonian patients (bipolar electrodes, 0.5 mm intercontact distance, biphasic stimuli, 120 Hz, 100 μs/phase, 200 μA), had antiparkinsonian effects. The stimulation markedly reduced oscillations in thalamic firing in the 13- to 30-Hz range and uncoupled the spiking activity of recorded neurons from simultaneously recorded local field potential (LFP) activity. These results confirm that oscillatory and nonoscillatory characteristics of spontaneous activity in the basal ganglia receiving ventral thalamus are altered in MPTP-induced parkinsonism. Electrical stimulation of GPi did not entrain thalamic activity but changed oscillatory activity in the ventral thalamus and altered the relationship between spikes and simultaneously recorded LFPs.

Keywords: deep brain stimulation; monkey; parkinsonism.


Figures

Fig. 1.
Fig. 1.
Histological identification of recording sites and documentation of dopamine depletion. The images in A–C show examples of adjacent sagittal sections through the anterior thalamus stained for Nissl substance (A), calbindin (B), and microtubule-associated protein 2 (MAP2, C), documenting how the basal ganglia motor thalamus (BGMT) was delineated and how tissue damage from repeated electrode penetrations was assessed. A representative electrode penetration is shown by the diagnonal line in A to show the stereotaxic approach to the thalamus. D and E show tyrosine hydroxylase (TH) stains of the midbrain (including the substantia nigra pars compacta, D) and coronal sections of the striatum (E). D1, D2, E1, and E2 are sections from the monkeys used in this study while D3 and E3 are sections from a normal control monkey, shown here for comparison. All scale bars are 1 mm in length. The scale bar in A applies to images AC, the scale bar in D1 applies to D1D3, and the scale bar in E1 applies to E1E3.
Fig. 2.
Fig. 2.
Stimulation sites in the internal globus pallidus (GPi, A and B) and microelectrode recording sites in the BGMT (C). The drawings in A and B are in coronal planes, showing the stimulation electrode tip sites (green circles) in monkeys A and B, respectively. The drawing of recording sites in C is based on histological reconstructions of parasagittal Nissl-, calbindin-, and MAP2-stained slides. Data from both monkeys are combined. The nuclear boundaries in A and B are based on the nuclear outlines in the atlas by Paxinos et al. (Paxinos et al. 2000), and those in C are drawn using the macaque brain atlas by Lanciego et al. (Lanciego and Vazquez 2012). In C, neurons recorded before 1-methyl-4-phenyl-1,2,3,6-tetrahydropyridine (MPTP) treatment are shown as red symbols, neurons recorded after MPTP treatment are shown in black. Cells that were very closely spaced are shown next to each other. Open symbols represent recordings in monkey A, filled symbols are from monkey B. AM, anterior medial nucleus of the thalamus; CBMT, cerebellar receiving territory of the motor thalamus; GPe, external pallidal segment; LD, laterodorsal nucleus of the thalamus; OT, optic tract; PC, paracentral nucleus of the thalamus; Re, reuniens nucleus of the thalamus; Rt, reticular nucleus of the thalamus; VPI, ventral posterior inferior nucleus of the thalamus; VPL, ventral posterior lateral nucleus of the thalamus; VPM, ventral posterior medial nucleus of the thalamus; ZI, zona incerta. Scale bars, 1 mm. The scale bar in A also applies to B.
Fig. 3.
Fig. 3.
Response to stimulation. The plots in A and B show results from two different BGMT cells, showing an increase (A) and a reduction (B), respectively, in firing in response to deep brain stimulation (DBS)-like 120-Hz stimulation in the GPi. The plots on the left show firing rate readouts, binned in 20-s intervals before, during, or after GPi stimulation (applied during the time indicated by the red bar). The plots on the right show poststimulus histograms for the same cells. The bar graphs in C show the behavioral responses to GPi stimulation at 10 or 120 Hz. The graph on the left shows the parkinsonism scores from each monkey, with gray scale depiction of the average subscores for rigidity, bradykinesia, tremor, freezing, and hypokinesia. Error bars and asterisks refer to the average overall score. The behavioral data were generated in three separate experimental days in each monkey. The graph on the right shows baseline-normalized overall parkinsonism scores from the sides ipsi- or contralateral to the stimulation, in monkeys A and B. *P < 0.05, difference from baseline. B, baseline; S1, 10-Hz stimulation; S2, 120-Hz stimulation.
Fig. 4.
Fig. 4.
Effects of GPi stimulation on parameters describing nonoscillatory and oscillatory properties of neuronal firing in the BGMT neurons. For each cell, data from the stimulated portion of the cell's record were normalized to the recording of the cell's baseline activity before the stimulation. *P < 0.05.
Fig. 5.
Fig. 5.
Analysis of GPi stimulation-related activity changes of BGMT cells at specific interstimulus times. Response profiles are shown for the 1st and 10th min of stimulation, summarized across all cells (see methods and results for details of analysis). Increases in the probability of firing are shown as red (upward), whereas decreases are shown in gray (downward). In some cells, the first ms of the interstimulus interval was affected by the stimulation artifact. These intervals are therefore not shown (gray rectangles).
Fig. 6.
Fig. 6.
Analysis of the relationship between local field potential (LFP) activity and spiking activity of thalamic neurons. A shows the average (normalized) power spectra of LFP signals in the normal (red) and parkinsonian (black/blue) states. The black and blue curves and symbols depict data from the same recording sites before (black) and during (blue) stimulation. Portions of the spectra that differed significantly between the normal and parkinsonian states (P < 0.05) are indicated by the gray background. The analysis in B shows the proportion of neurons in which a specific relationship between narrow-band filtered LFP activity (2-Hz bandwidth) and spiking was detected (Omnibus test, P < 0.05). Data from the parkinsonian state with ongoing GPi stimulation (10th min) are shown as blue lines.

References

    1. Agnesi F, Muralidharan A, Baker KB, Vitek JL, Johnson MD. Fidelity of frequency and phase entrainment of circuit-level spike activity during DBS. J Neurophysiol 114: 825–834, 2015. - PMC - PubMed
    1. Aldridge JW, Gilman S. The temporal structure of spike trains in the primate basal ganglia: afferent regulation of bursting demonstrated with precentral cerebral cortical ablation. Brain Res 543: 123–138, 1991. - PubMed
    1. Alexander GM, Fisher TL, Godwin DW. Differential response dynamics of corticothalamic glutamatergic synapses in the lateral geniculate nucleus and thalamic reticular nucleus. Neuroscience 137: 367–372, 2006. - PubMed
    1. Anderson ME, Postupna N, Ruffo M. Effects of high-frequency stimulation in the internal globus pallidus on the activity of thalamic neurons in the awake monkey. J Neurophys 89: 1150–1160, 2003. - PubMed
    1. Angeli A, Akram H, Zacharia A, Limousin P, Hariz M, Zrinzo L, Foltynie T. Varying time-course of effects of high frequency stimulation of sub-regions of the globus pallidus in patients with parkinson's disease. Parkinsonism Relat Disord 21: 597–602, 2015. - PubMed

Publication types

MeSH terms

Substances

LinkOut - more resources