. 2016 Dec 1;116(6):2739-2751.
doi: 10.1152/jn.00519.2016. Epub 2016 Sep 28.

Learning the trajectory of a moving visual target and evolution of its tracking in the monkey

Affiliations

Learning the trajectory of a moving visual target and evolution of its tracking in the monkey

Clara Bourrelly et al. J Neurophysiol. .

Abstract

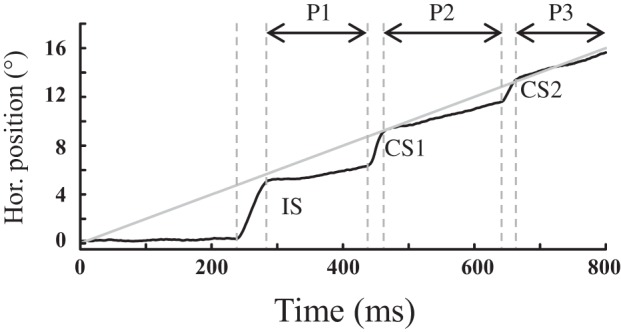
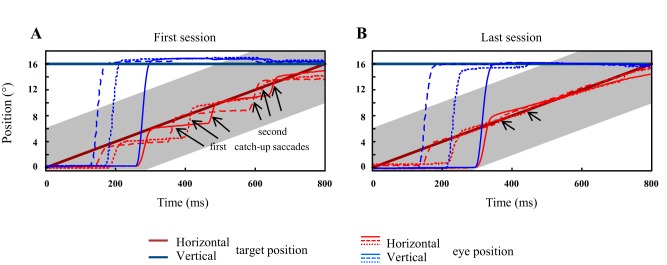
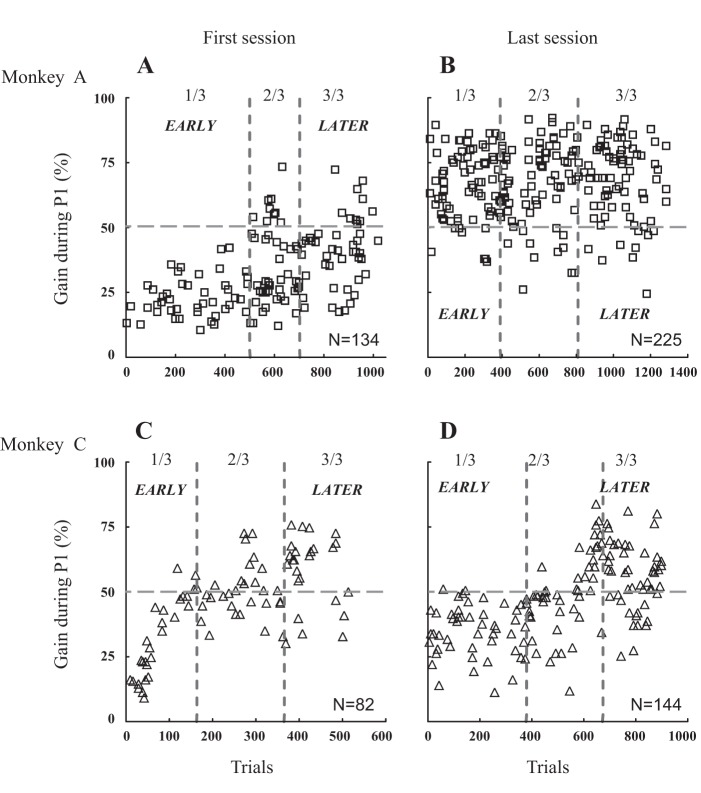
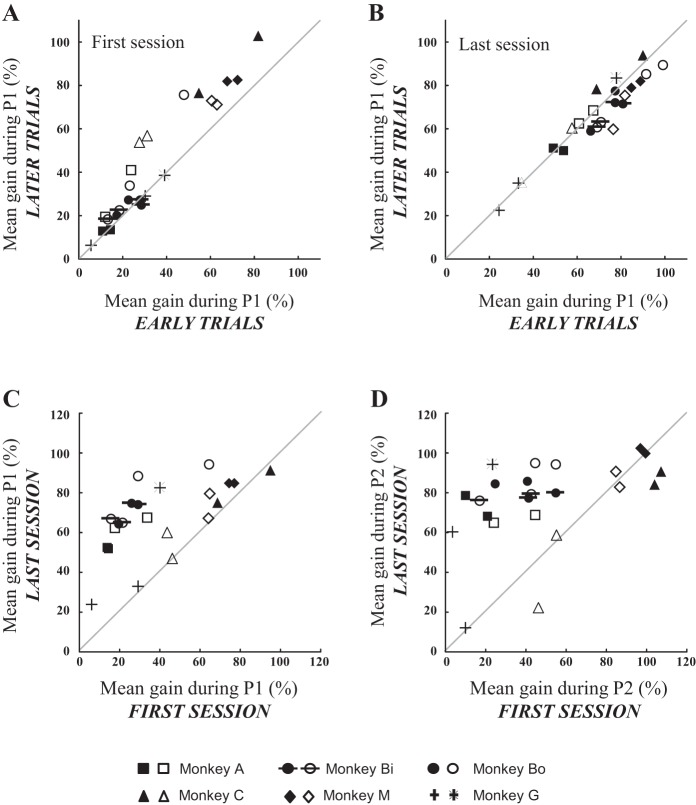
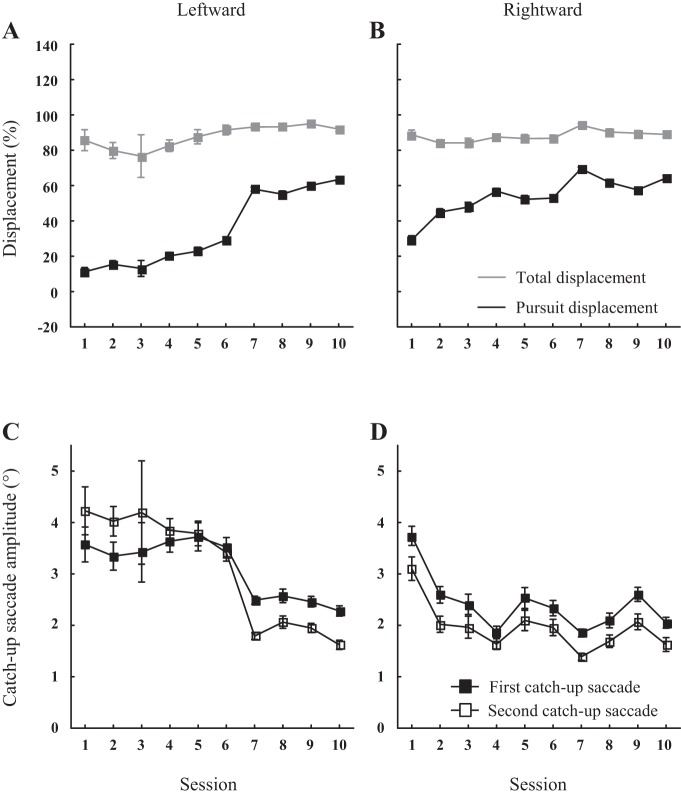
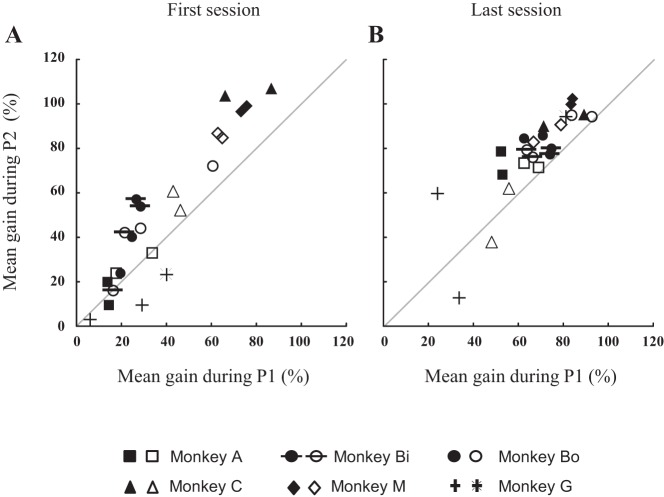
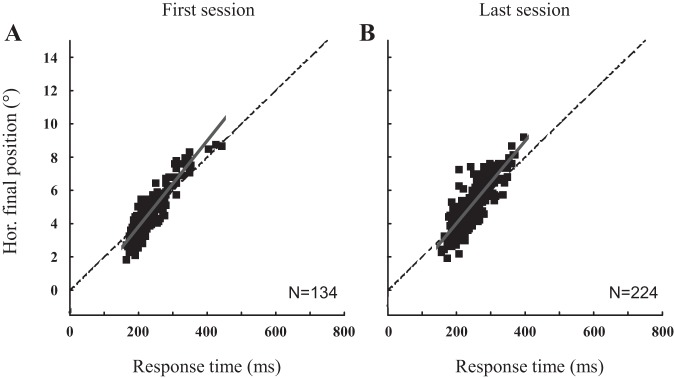
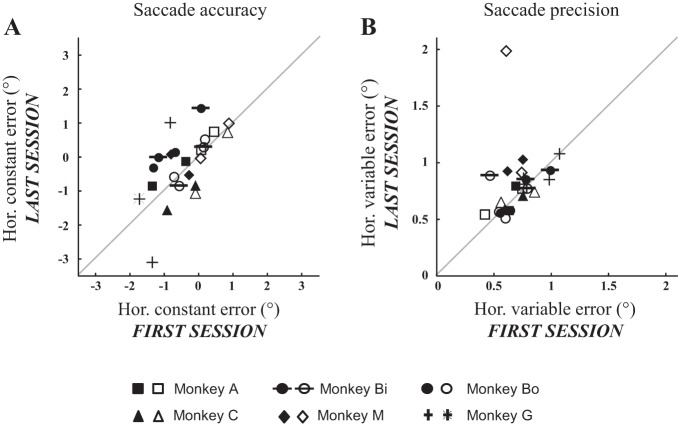
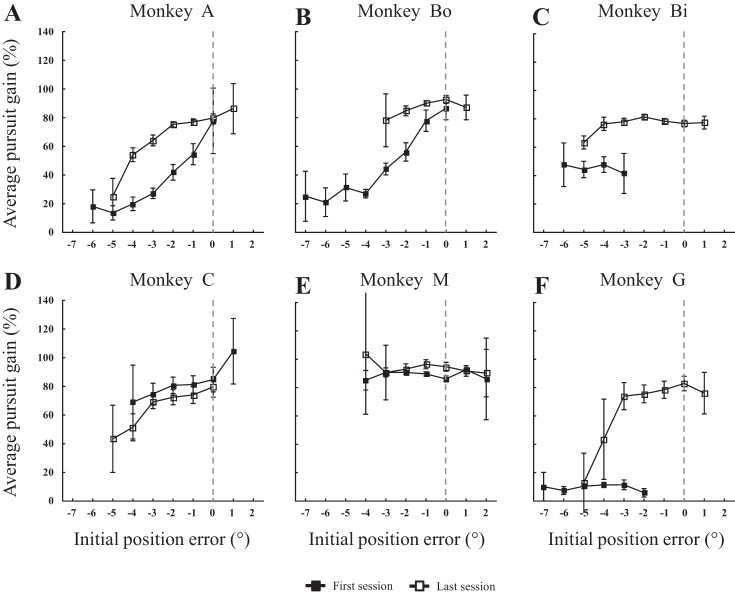
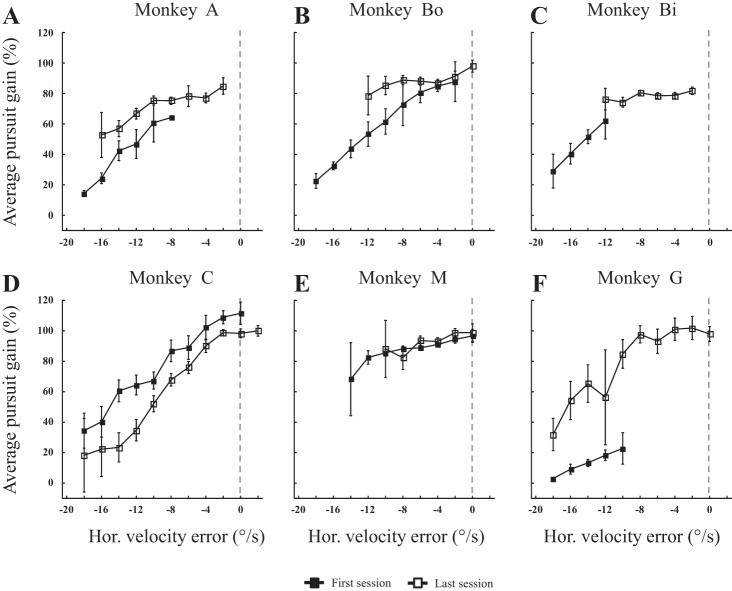
An object moving in the visual field triggers a saccade that brings its image onto the fovea. It is followed by a combination of slow eye movements and catch-up saccades that try to keep the target image on the fovea as long as possible. The accuracy of this ability to track the "here-and-now" location of a visual target contrasts with the spatiotemporally distributed nature of its encoding in the brain. We show in six experimentally naive monkeys how this performance is acquired and gradually evolves during successive daily sessions. During the early exposure, the tracking is mostly saltatory, made of relatively large saccades separated by low eye velocity episodes, demonstrating that accurate (here and now) pursuit is not spontaneous and that gaze direction lags behind its location most of the time. Over the sessions, while the pursuit velocity is enhanced, the gaze is more frequently directed toward the current target location as a consequence of a 25% reduction in the number of catch-up saccades and a 37% reduction in size (for the first saccade). This smoothing is observed at several scales: during the course of single trials, across the set of trials within a session, and over successive sessions. We explain the neurophysiological processes responsible for this combined evolution of saccades and pursuit in the absence of stringent training constraints. More generally, our study shows that the oculomotor system can be used to discover the neural mechanisms underlying the ability to synchronize a motor effector with a dynamic external event.

Keywords: prediction; pursuit; saccade; synchronism; tracking.


Figures

Fig. 1.
Fig. 1.
Definition of the different periods of oculomotor tracking after the onset of the motion of the target in the peripheral visual field. After the interceptive saccade (IS), a succession of catch-up saccades (CS1, CS2, etc.) are made to foveate the moving target (gray trace). During the intersaccadic intervals (P1, P2, P3, etc.), the eye pursues the target with a velocity which more or less matches with the target speed.
Fig. 2.
Fig. 2.
Typical oculomotor behavior of a monkey tracking a moving visual target. The eye position (horizontal: red; vertical: blue) is plotted as a function of time after the target motion onset for three trials recorded during the first (A) and last training sessions (B). The time course of target position is illustrated by the thick lines (horizontal: red; vertical: blue). The selected trials were recorded in monkey A when it tracked a target moving in the upper right quadrant. The shaded zone illustrates the width of the window within which the gaze had to remain to avoid the interruption of the trial. The arrows indicate the catch-up saccades.
Fig. 3.
Fig. 3.
Evolution of pursuit velocity after the interceptive saccade across trials and during the first (A and C) and last sessions (B and D). The pursuit velocity gain was measured during the first intersaccadic interval, i.e., after the interceptive saccade when the target moved in the upper right field during the first and last session recorded in monkey A (A and B) and monkey C (C and D). Dashed lines segregate the data set into three equal parts. The early part corresponds to the first one-third of the total number of trials; the late trials, the last one-third. A: during the first session, the gains of monkey A ranged from 11 to 43% (mean ± SD = 23 ± 8%) during the early trials and from 18 to 73% (42 ± 13%) during the later trials. C: in monkey C, they ranged from 9 to 59% (31 ± 15%) during the early trials and from 30 to 76% (57 ± 14%) during the later trials. B and D: during the last session, the gains did not consistently change between the early and later trials (from 67 ± 13% to 69 ± 15% in monkey A and from 35 ± 10% to 56 ± 13% in monkey C).
Fig. 4.
Fig. 4.
Change of pursuit velocity after the interceptive saccade during and between the first and the last training sessions. A and B: the graphs compare the average pursuit gains between the early (first one-third of trials) and the later (last one-third) trials, for the first (A) and the last (B) training sessions. The gains were measured during the first intersaccadic interval (P1, see Fig. 1). C and D: the average gains during the first (C) and second (D) intersaccadic intervals (P1 and P2, respectively) were calculated for the total number of trials. Solid (or crosses) and open (or stars) symbols correspond to the leftward and rightward target motion, respectively. Different symbols correspond to different monkeys.
Fig. 5.
Fig. 5.
Evolution of visual tracking behavior over successive sessions. A and B: the evolution of the total (gray lines) and pursuit (black lines) eye displacements is illustrated for monkey A. The kinetics is documented separately for leftward (A) and rightward (B) target motion direction because they involve different neuronal populations. Error bars correspond to confidence intervals. C and D: for the same monkey, the evolution of the amplitude of the first (■) and second (□) catch-up saccades is also illustrated. The kinetics are also documented separately for leftward (C) and rightward (D). Again, error bars correspond to confidence intervals.
Fig. 6.
Fig. 6.
Evolution of pursuit velocity during the course of the trial. The average pursuit velocity gains were measured during the first (P1) and second (P2) intersaccadic intervals (see Fig. 1). This figure shows the gain change between the first and the second intersaccadic intervals for the first (A) and the last (B) sessions. Solid (or crosses) and open (or stars) symbols correspond to the leftward and rightward target motion, respectively. Different symbols correspond to different monkeys.
Fig. 7.
Fig. 7.
Landing positions of interceptive saccades. For one monkey (monkey A), the horizontal final eye positions are plotted as a function of the response time (saccade landing time) of interceptive saccades made in response to a target moving in the upper right visual field for the first (A) and the last (B) session. The target position is illustrated by the dashed line. The gray line segment corresponds to the regression line fitting the data. The slope values are 25.8°/s and 24.7°/s for the first and last session, respectively.
Fig. 8.
Fig. 8.
Accuracy and precision of interceptive saccades. The average constant (A) and variable (B) errors are compared between the first and the last training sessions (see text for details). Solid (or crosses) and open (or stars) symbols correspond to the leftward and rightward target motion, respectively. Different symbols correspond to different monkeys.
Fig. 9.
Fig. 9.
Influence of horizontal target eccentricity at the onset of catch-up saccade on postsaccadic pursuit. AF: for our six monkeys (monkeys A, Bo, Bi, C, M, and G, respectively), the average pursuit gain during the second intersaccadic intervals are plotted as a function of horizontal target eccentricity (called initial position error) at the onset of the first catch-up saccades. The relation is documented for the first (■) and last (□) sessions. Zero value of target eccentricity means that the horizontal eye and target position match at the onset of the catch-up saccade (dashed line). Negative values correspond to the fact that the horizontal eye position lags behind the target; positive values, when it leads ahead. The means were not calculated when any category contained less than four values.
Fig. 10.
Fig. 10.
Influence of target retinal slip before the first catch-up saccade on the postsaccadic pursuit. AF: for our six monkeys (monkeys A, Bo, Bi, C, M, and G, respectively), the average pursuit velocity gain during the second intersaccadic interval is plotted as a function of retinal slip (called horizontal velocity error) before the first catch-up saccade. The relation is documented for the first (■) and last (□) sessions. Zero value of target retinal slip means that the mean eye velocity during the first intersaccadic interval is equal to the target speed (dashed line). Conversely, a target-related retinal slip equal to −20°/s corresponds to the case where the eye does not move. The mean values were not calculated when less than four values were obtained for a given category.

Similar articles

Cited by

References

    1. Accardo AP, Pensiero S, Pozzo SDA, Perissutti P. Characteristics of horizontal smooth pursuit eye movements to sinusoidal stimulation in children of primary school age. Vision Res 35: 539–548, 1995. - PubMed
    1. Bahill AT. Modeling the smooth-pursuit eye-movement system. Automedica 19: 1–17, 2000.
    1. Bahill AT, Iandolo MJ, Troost BT. Smooth pursuit eye movements in response to unpredictable target waveforms. Vision Res 20: 923–931, 1980. - PubMed
    1. Barnes GR. Cognitive processes involved in smooth pursuit eye movements. Brain Cogn 68: 309–326, 2008. - PubMed
    1. Barnes GR, Collins S. Influence of predictability on control of extra-retinal components of smooth pursuit during prolonged 2D tracking. Exp Brain Res 233: 885–897, 2015. - PubMed

Publication types

LinkOut - more resources