

Shared Neural Mechanisms for the Evaluation of Intense Sensory Stimulation and Economic Reward, Dependent on Stimulation-Seeking Behavior
- PMID: 27683900
- PMCID: PMC5039253
- DOI: 10.1523/JNEUROSCI.1048-16.2016
Shared Neural Mechanisms for the Evaluation of Intense Sensory Stimulation and Economic Reward, Dependent on Stimulation-Seeking Behavior
Abstract
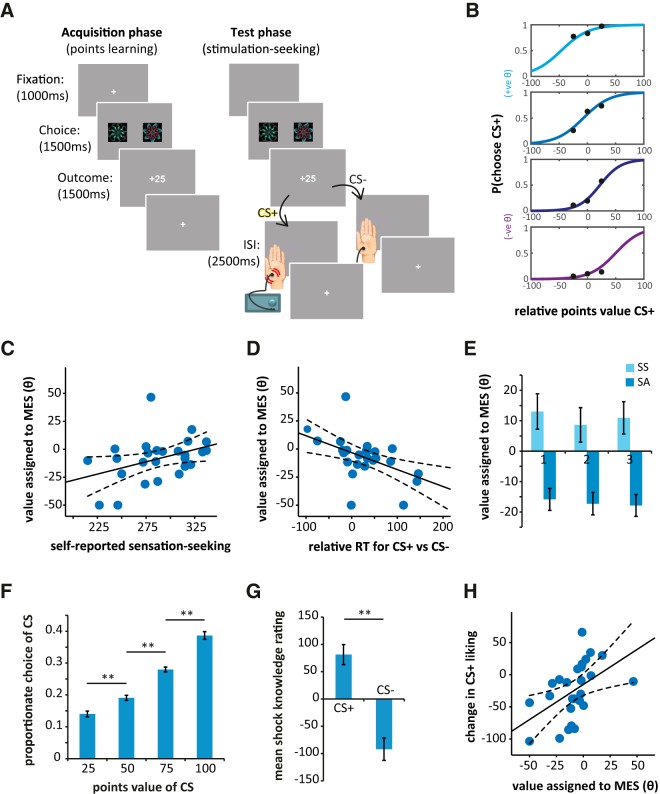
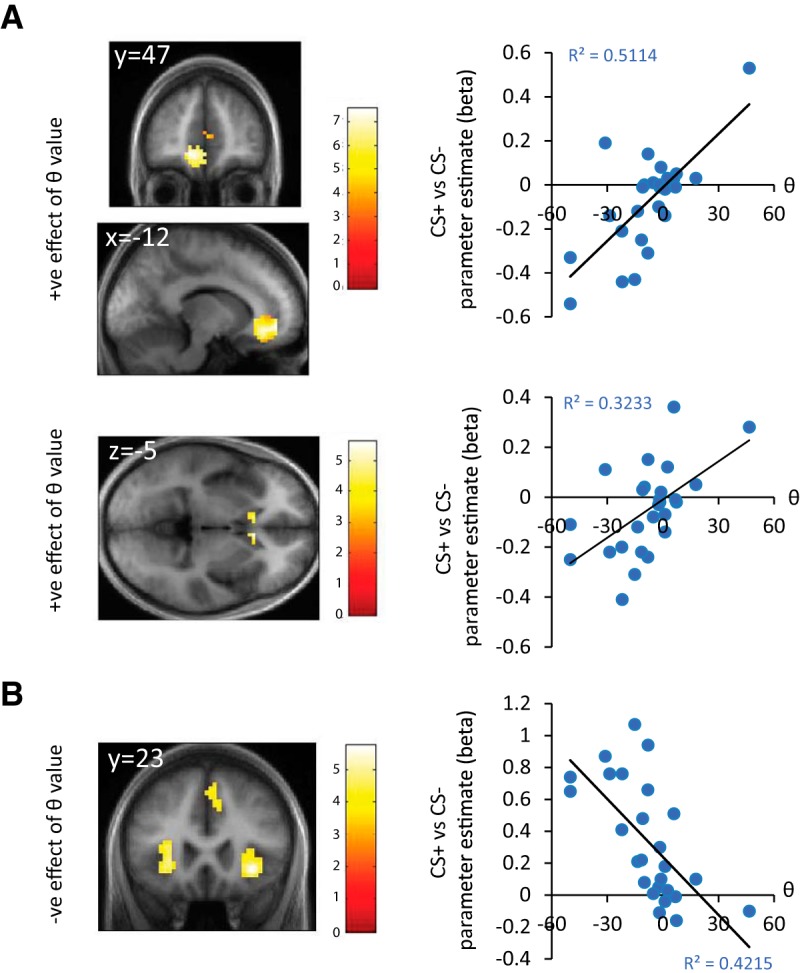
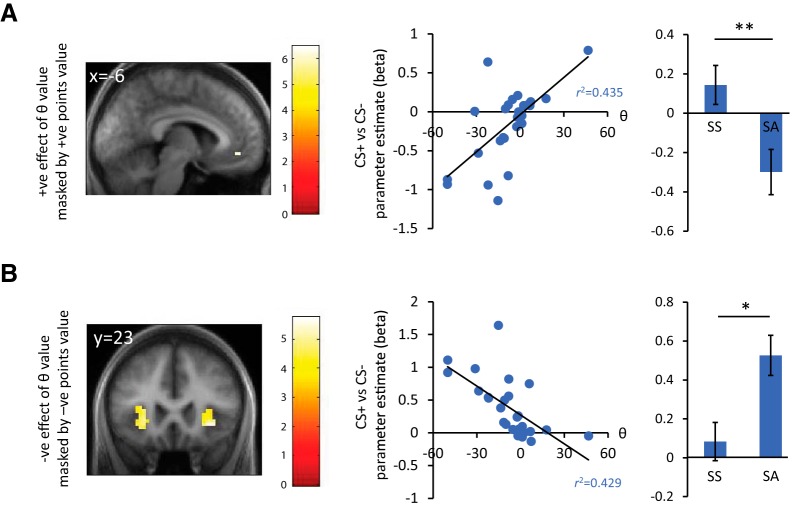
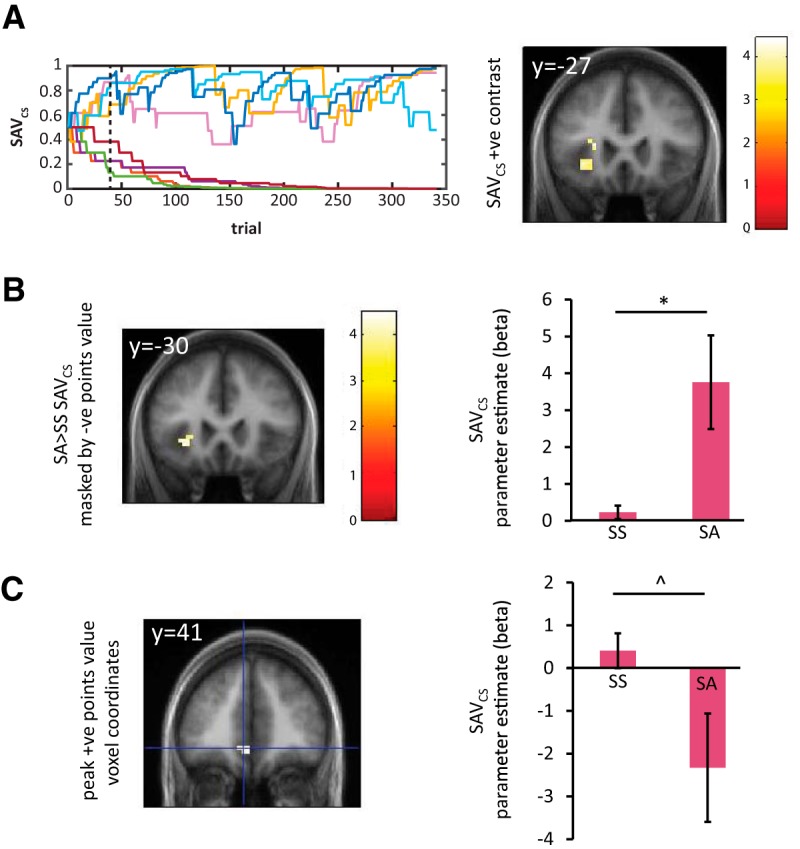
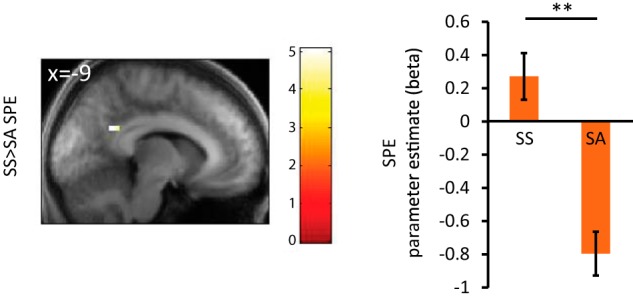
Why are some people strongly motivated by intense sensory experiences? Here we investigated how people encode the value of an intense sensory experience compared with economic reward, and how this varies according to stimulation-seeking preference. Specifically, we used a novel behavioral task in combination with computational modeling to derive the value individuals assigned to the opportunity to experience an intense tactile stimulus (mild electric shock). We then examined functional imaging data recorded during task performance to see how the opportunity to experience the sensory stimulus was encoded in stimulation-seekers versus stimulation-avoiders. We found that for individuals who positively sought out this kind of sensory stimulation, there was common encoding of anticipated economic and sensory rewards in the ventromedial prefrontal cortex. Conversely, there was robust encoding of the modeled probability of receiving such stimulation in the insula only in stimulation-avoidant individuals. Finally, we found preliminary evidence that sensory prediction error signals may be positively signed for stimulation-seekers, but negatively signed for stimulation-avoiders, in the posterior cingulate cortex. These findings may help explain why high intensity sensory experiences are appetitive for some individuals, but not for others, and may have relevance for the increased vulnerability for some psychopathologies, but perhaps increased resilience for others, in high sensation-seeking individuals.
Significance statement: People vary in their preference for intense sensory experiences. Here, we investigated how different individuals evaluate the prospect of an unusual sensory experience (electric shock), compared with the opportunity to gain a more traditional reward (money). We found that in a subset of individuals who sought out such unusual sensory stimulation, anticipation of the sensory outcome was encoded in the same way as that of monetary gain, in the ventromedial prefrontal cortex. Further understanding of stimulation-seeking behavior may shed light on the etiology of psychopathologies such as addiction, for which high or low sensation-seeking personality has been identified as a risk factor.
Keywords: addiction; decision-making; impulsivity; individual differences; sensation-seeking; value.
Copyright © 2016 Norbury et al.
Figures
Similar articles
-
Dopamine Regulates Approach-Avoidance in Human Sensation-Seeking.Int J Neuropsychopharmacol. 2015 Apr 9;18(10):pyv041. doi: 10.1093/ijnp/pyv041. Int J Neuropsychopharmacol. 2015. PMID: 25857822 Free PMC article.
-
A pathway linking reward circuitry, impulsive sensation-seeking and risky decision-making in young adults: identifying neural markers for new interventions.Transl Psychiatry. 2017 Apr 18;7(4):e1096. doi: 10.1038/tp.2017.60. Transl Psychiatry. 2017. PMID: 28418404 Free PMC article.
-
Neural Signatures of Value Comparison in Human Cingulate Cortex during Decisions Requiring an Effort-Reward Trade-off.J Neurosci. 2016 Sep 28;36(39):10002-15. doi: 10.1523/JNEUROSCI.0292-16.2016. Epub 2016 Sep 28. J Neurosci. 2016. PMID: 27683898 Free PMC article.
-
Sensation-seeking: Dopaminergic modulation and risk for psychopathology.Behav Brain Res. 2015 Jul 15;288:79-93. doi: 10.1016/j.bbr.2015.04.015. Epub 2015 Apr 20. Behav Brain Res. 2015. PMID: 25907745 Review.
-
Reward-dependent learning in neuronal networks for planning and decision making.Prog Brain Res. 2000;126:217-29. doi: 10.1016/S0079-6123(00)26016-0. Prog Brain Res. 2000. PMID: 11105649 Review.
Cited by
-
Systems genetics of sensation seeking.Genes Brain Behav. 2019 Mar;18(3):e12519. doi: 10.1111/gbb.12519. Epub 2018 Oct 8. Genes Brain Behav. 2019. PMID: 30221471 Free PMC article.
-
Sensation seeking correlates with increased white matter integrity of structures associated with visuospatial processing in healthy adults.Front Neurosci. 2023 Oct 26;17:1267700. doi: 10.3389/fnins.2023.1267700. eCollection 2023. Front Neurosci. 2023. PMID: 37954876 Free PMC article.
-
Tracking Deceased-Related Thinking with Neural Pattern Decoding of a Cortical-Basal Ganglia Circuit.Biol Psychiatry Cogn Neurosci Neuroimaging. 2017 Jul;2(5):421-429. doi: 10.1016/j.bpsc.2017.02.004. Biol Psychiatry Cogn Neurosci Neuroimaging. 2017. PMID: 28730182 Free PMC article.
-
Effects of isolation housing stress and mouse strain on intravenous cocaine self-administration, sensory stimulus self-administration, and reward preference.Sci Rep. 2023 Feb 16;13(1):2810. doi: 10.1038/s41598-023-29579-9. Sci Rep. 2023. PMID: 36797314 Free PMC article.
References
-
- Brett M, Anton J-L, Valabregue R, Poline J-B. Region of interest analysis using an SPM toolbox. Neuroimage 16. Paper presented at the 8th Internationnal Conference on Functional Mapping of the Human Brain; June; Sendai, Japan. 2002.
-
- Camerer C, Ho T-H. Experience-weighted attraction learning in normal form games. Econometrica. 1999;67:827–874. doi: 10.1111/1468-0262.00054. - DOI
Publication types
MeSH terms
Grants and funding
LinkOut - more resources
Full Text Sources
Other Literature Sources