. 2016 Nov;11(11):2054-65.
doi: 10.1038/nprot.2016.124. Epub 2016 Sep 29.

Resolving macromolecular structures from electron cryo-tomography data using subtomogram averaging in RELION

Affiliations

Resolving macromolecular structures from electron cryo-tomography data using subtomogram averaging in RELION

Tanmay A M Bharat et al. Nat Protoc. 2016 Nov.

Abstract

Electron cryo-tomography (cryo-ET) is a technique that is used to produce 3D pictures (tomograms) of complex objects such as asymmetric viruses, cellular organelles or whole cells from a series of tilted electron cryo-microscopy (cryo-EM) images. Averaging of macromolecular complexes found within tomograms is known as subtomogram averaging, and this technique allows structure determination of macromolecular complexes in situ. Subtomogram averaging is also gaining in popularity for the calculation of initial models for single-particle analysis. We describe herein a protocol for subtomogram averaging from cryo-ET data using the RELION software (http://www2.mrc-lmb.cam.ac.uk/relion). RELION was originally developed for cryo-EM single-particle analysis, and the subtomogram averaging approach presented in this protocol has been implemented in the existing workflow for single-particle analysis so that users may conveniently tap into existing capabilities of the RELION software. We describe how to calculate 3D models for the contrast transfer function (CTF) that describe the transfer of information in the imaging process, and we illustrate the results of classification and subtomogram averaging refinement for cryo-ET data of purified hepatitis B capsid particles and Saccharomyces cerevisiae 80S ribosomes. Using the steps described in this protocol, along with the troubleshooting and optimization guidelines, high-resolution maps can be obtained in which secondary structure elements are resolved subtomogram.


Conflict of interest statement

The authors declare that they have no competing financial interests.

Figures
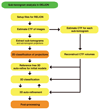
Figure 1
Figure 1. Workflow of the image processing protocol.
A schematic representation of the recommended workflow for sub-tomogram analysis using RELION presented in this protocol. The main difference between single-particle analysis and subtomogram analysis in RELION is related to CTF estimation and the new 3D CTF model. This 3D CTF model also compensates for the missing wedge, and is used in both 3D classification as well as 3D auto-refinement. Steps highlighted in orange are unchanged from the single-particle analysis workflow.
Figure 2
Figure 2. CTF estimation for the 3D CTF model.
(A) The unweighted 3D CTF model used in RELION. This model is constructed by placing the 2D CTFs of each image in the tilt series into a 3D volume in Fourier-space, with the correct orientation depending on the tilt angle. Therefore this model also compensates for the missing wedge. (B) The weighted 3D CTF model used in RELION. The weighted model accounts for increase in noise at high tilts, and for radiation-induced damage. The volume is coloured from red at low resolution to dark blue at the highest obtainable (Nyquist) resolution. (C) A diagnostic output file of CTFFIND3 from a low-tilt tilt series image. There is no visible radiation-induced motion, and many Thon rings are visible making CTF estimation accurate. (D) Corresponding diagnostic file from a high-tilt image. Fewer Thon rings are visible due to increased specimen thickness. CTF estimation in this case is adequate but not as accurate as C. (E) A diagnostic file from a high-tilt image where no Thon rings are visible. CTF estimation is not possible from this image, and it should either be removed from the tilt series or the data collection strategy should be modified to include the recording of additional images for CTF estimation on either side of the target region .
Figure 3
Figure 3. The RELION-1.4 graphical user interface.
After CTF parameters have been estimated for each particle in each image of the tilt series and 3D CTF models have been reconstructed, the actual tasks of sub-tomogram analysis may all be performed using the RELION graphical user interface. The 3D auto-refine page of this user interface is shown. The white column on the left shows different 'job-types', which are ordered according to the natural workflow from top to bottom. On the main panel, the '3D auto-refine' job-type is shown. This job-type has tabs for “I/O”, “Reference”, “CTF”, “Optimization”, “Auto-sampling”, “Movies”, and “Running” where users should enter the input parameters as described in the main text. The “Display”, “Print command” and “Run!” buttons are used to view images, commands and launch jobs, respectively.
Figure 4
Figure 4. 2D Classification and initial model generation.
(A) 2D classification of projected sub-tomograms of the HBV capsid particles. Particles were selected from a template matching procedure and 2D classification helped in removing bad particles, for example ones that correspond to 10 nm gold fiducials. Good classes that were selected for further processing are marked with blue dots. (B) 2D classification of projected sub-tomograms of S. cerevisiae 80S ribosomes. These data were picked manually in IMOD. Classes of ribosomes selected for refinement are marked with blue dots. (C) Reference-free refinement of the HBV capsid data set. Sub-tomograms were assigned random Euler angles initially (in iteration 0) and then refinement was commenced. (D) Reference-free refinement of the S. cerevisiae 80S ribosome particles, again starting from random orientations. Initial models described in panels (C-D) may then be used to begin 3D refinements within RELION.
Figure 5
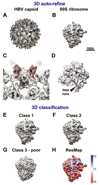
Figure 5. 3D auto-refinement and classification using the regularized-likelihood algorithm in RELION.
(A) Output of the 3D auto-refinement procedure from RELION for the HBV capsid dataset. (B) Output of 3D auto-refinement for the 80S ribosome data set (This map has been deposited at the EMDB under the accession number EMD-3228). The scale bar shown applies to panels A-B and E-H. (C) Secondary structure features (α-helices) are resolved in the HBV capsid map. Fitted atomic co-ordinates into the sub-tomogram average highlight the positions of the helices. (D) RNA helices resolved in the 80S ribosome map. The atomic co-ordinates have been fitted into this map as rigid bodies for visualization. (E-G) 3D classification of the ribosome data set (with the combined 3D missing wedge and CTF model applied) into three classes reveals a subset of particles (~15% of the data set) in G that show a poor sub-tomogram average. (H) Removing these particles in a second 3D auto-refinement leads to a cleaner map. The result of ResMap is plotted onto the final density showing somewhat lower resolution in the small subunit of the ribosome. The colour map is defined from blue (10 Å) to red (18 Å).
Figure 6
Figure 6. Sub-tomogram analysis of particles at different Z-heights.
(A) The S. cerevisiae 80S ribosomes particles were found to localize at either the air-water or the carbon-water interface. This panel shows a small population of ribosomes at a Z-slice corresponding to the air – water interface. The scale bar applies to all the panels in the figure. (B) A tomographic slice at the carbon-water interface showing a surface packed with ribosomes. (C) Same slice as panel A is shown (with a transparency) overlaid with a plot of the centres of all ribosomes in the tomogram. A green cone is placed at the centre of a ribosome that is sorted into a good class (see Figure 4B) and a red cone is placed at the centre of a ribosome sorted into a bad class. This figure shows that in most tilt series images, the signal from ribosomes in the top layer is superimposed with the signal from ribosomes in the bottom layer, therefore tomography and sub-tomogram analysis is ideal for studying this sample. (D) The same picture as panel C rotated to show the 3D arrangement of the sample. (E) A view of the tomogram along the XY plane with the plot of the centres of all ribosomes shown as in panels C-D. The edges of the tomogram have been demarcated with a solid black line.

References

    1. Bai XC, McMullan G, Scheres SH. How cryo-EM is revolutionizing structural biology. Trends Biochem Sci. 2015;40:49–57. - PubMed
    1. Cheng Y. Single-Particle Cryo-EM at Crystallographic Resolution. Cell. 2015;161:450–457. - PMC - PubMed
    1. Baumeister W. Electron tomography: towards visualizing the molecular organization of the cytoplasm. Curr Opin Struct Biol. 2002;12:679–684. - PubMed
    1. Briggs JA. Structural biology in situ--the potential of subtomogram averaging. Curr Opin Struct Biol. 2013;23:261–267. - PubMed
    1. Beck M, Lucić V, Förster F, Baumeister W, Medalia O. Snapshots of nuclear pore complexes in action captured by cryo-electron tomography. Nature. 2007;449:611–615. - PubMed

MeSH terms

Substances