. 2016 Sep 29;11(9):e0163744.
doi: 10.1371/journal.pone.0163744. eCollection 2016.

Long Term Ex Vivo Culture and Live Imaging of Drosophila Larval Imaginal Discs

Affiliations

Long Term Ex Vivo Culture and Live Imaging of Drosophila Larval Imaginal Discs

Chia-Kang Tsao et al. PLoS One. .

Abstract

Continuous imaging of live tissues provides clear temporal sequence of biological events. The Drosophila imaginal discs have been popular experimental subjects for the study of a wide variety of biological phenomena, but long term culture that allows normal development has not been satisfactory. Here we report a culture method that can sustain normal development for 18 hours and allows live imaging. The method is validated in multiple discs and for cell proliferation, differentiation and migration. However, it does not support disc growth and cannot support cell proliferation for more than 7 to 12 hr. We monitored the cellular behavior of retinal basal glia in the developing eye disc and found that distinct glia type has distinct properties of proliferation and migration. The live imaging provided direct proof that wrapping glia differentiated from existing glia after migrating to the anterior front, and unexpectedly found that they undergo endoreplication before wrapping axons, and their nuclei migrate up and down along the axons. UV-induced specific labeling of a single carpet glia also showed that the two carpet glia membrane do not overlap and suggests a tiling or repulsion mechanism between the two cells. These findings demonstrated the usefulness of an ex vivo culture method and live imaging.


Conflict of interest statement

The authors have declared that no competing interests exist.

Figures
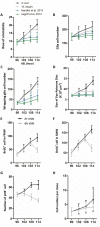
Fig 1
Fig 1. An improved medium for long-term ex vivo culture of eye-antenna disc.
(A-D) Mid-third instar (96 hr AEL) MZ97>RFP eye-antennal discs were cultured ex vivo for 6, 12, and 18 hr (102, 108 and 114 hr AEL, respectively), and compared with discs dissected from larva (in vivo) at these time points. The discs were cultured in 1X insulin medium (this study) and the medium of Handke et al. (2014) and Legoff et al. (2013) (see S1 Table) respectively, for comparison. (A) The number of rows of ommatidia, marked by anti-HRP. (B) The number of retinal basal glia (marked by anti-Repo). (C) The number of wrapping glia, marked by MZ97>RFP. (D) The size of eye-antenna disc. (E-G) Mid-third instar (96 hr AEL) w1118 eye-antennal discs were cultured ex vivo for 6, 12 and 18 hr (102, 108 and 114 hr AEL, respectively), and compared with discs dissected from larva (in vivo) at these time points. (E) The number of BrdU+ cells in the first mitotic wave (FMW). (F) The number of BrdU+ cells in the second mitotic wave (SMW). (G) The number of phosphor-histone 3 (pH3+) cells in the entire disc. For all experiments, N = 10. (H) Neutral clones marked by nuclear GFP were induced at 72h AEL and the discs were dissected out at 96h AEL and cultured for 6, 12 and 18 hr (102, 108 and 114 hr AEL, respectively) and compared with clones in in freshly dissected disc. The number of cells in each clone were compared. N = 20.
Fig 2
Fig 2. Long-term ex vivo culture of wing disc.
Wing disc dissected from 84 h AEL larva (mid-L3) was cultured ex vivo for 12, 24 and 36 hr, respectively, and compared to disc directly dissected from larva (in vivo) at the corresponding time points. The discs were stained for BrdU incorporation and DAPI. (A) The number of BrdU+ cells gradually reduced in ex vivo cultured disc. N = 10. The percentage of S phase cells is consistent with previous report [46]. (B) The number of mitotic cells (pH3+) cells maintained at a low level throughout the 36 hr culture period. N = 10. (C) The number of cell divisions within each hour is monitored over 16 hr culture period of His2Av-GFP wing disc. N = 6 discs. Total cells = 2389. (D) The disc size (area) showed only slight growth over the 36 hr culture period.
Fig 3
Fig 3. Cell proliferation and DV boundary formation in cultured wing discs.
(A) Frames from S1 Movie of mid-L2 wing disc cultured ex vivo at 25°C for 16.5 hr (equals to early-mid-L3) compared with in vivo disc at the same age. Sqh-mCherry is Spaghetti squash (Sqh), a non-muscle myosin light chain, fused with mCherry [47]. Sqh-mCherry (green) showed the actomyosin cable at the DV boundary (arrow) at 16.5 hr. ap-Gal4 driven nuclear GFP (ap>GFP.nls) (white) marked the dorsal compartment. The expression intensity gradually increased with time. N = 4 discs for ex vivo, N = 6 for in vivo. The Sqh-mCherry intensity in the dorsal (ap-GAL4 expressing domain) and ventral domain are not significantly different (ratio = 1.13±0.12, N = 6). The lack of nuclear signal in the left side of the image is due to disc curvature. (B-D) Frames and analyses based on S2 Movie of mid-L3 His2Av-GFP wing disc cultured for 16 hr. N = 4 discs. (B) XZ sections from S2 Movie, with apical surface on top. The dividing nuclei is marked by red asterisk. (C) The orientation of each cell division over the 7 hr period is marked by a line connecting the two daughter cells. (D) The orientation of cell divisions (based on C) showed a bias for divisions along the DV axis and against along the AP axis. (E, F) Frames and analysis based on S3 Movie. An early-L3 ubi>Fucci eye-antennal disc was cultured and monitored at 25°C for 14.5 hr. The fluorescent marker GFP-E2F11–230 (green) labels G2, M, and G1 phase, and mRFP1-CycB1–266 (magenta) labels the S, G2 and M phase. Their combination allows clear distinction of G1 (GFP only; green), S (RFP only; magenta), and G2 (GFP and RFP; white) phases. (E) A cell undergoes cell division, going from G2 (GFP and RFP) to two G1 (GFP) cells. (F) The proportion of different cell cycle phase at the start and end of the culture period are compared. N = 3 discs. In this and subsequent figures, the scale bar is 30 μm, except in (D, E) is 10 μm. This and subsequent analyses based on live imaging are based on at least three independent movies. The results were similar.
Fig 4
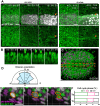
Fig 4. Ommatidial development in cultured eye-antennal disc.
(A, B) Frames were taken from S4 Movie. A mid-L3 elav>H2B-RFP eye-antennal disc was cultured and monitored at 25°C for 15.75 hr. The RFP+ (Red) photoreceptor neurons appear posterior to the morphogenetic furrow (MF) and forms 8-cell ommatidial clusters. There are 6 rows of ommatidia in the beginning (A) and 11 rows at the end (B). N = 3 disc. The scale bar is 30 μm.
Fig 5
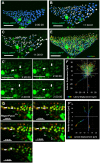
Fig 5. Proliferation and migration of retinal basal glia in cultured eye disc.
Data were taken from S6 Movie. A mid-L3 repo-RFP.nls eye-antennal disc was cultured and monitored at 25°C for 11.5 hr, Nuclear RFP (green) marks the RBG nuclei. The Repo+ nuclei present at time 0 (A) are artificially marked in blue. The new Repo+ nuclei were marked in white (B). (C, C’) Division in two cells are shown (arrows). The two daughter cells of a division event are linked by a line. The sites of their divisions are marked by blue dots. (D) In repo>Fucci ex vivo cultured eye disc, a cell can undergo a full cell cycle (arrowhead showing progression from red (S phase) to no signal (mitosis phase) to two green (G1 phase) daughter cells). A cell can undergo endoreplication (arrows showing progression from yellow (G2 phase) to green (G1 phase) without undergoing mitosis). (E) The track of each Repo+ nucleus was recorded and color coded, with blue representing the start and red representing the end of movement. The two large Repo+ nuclei are the carpet glia. They do not undergo extensive movement. (F) The migration tracks are presented as displacements from their origin. (F’) The track of a few cells are presented. N = 3. The scale bar is 30 μm.
Fig 6
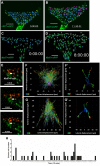
Fig 6. Proliferation and migration of surface glia and wrapping glia in cultured eye disc.
(A, B, F) A C527>H2B-RFP mid-L3 eye disc was cultured and imaged for 11.5 hr (S7 Movie). (A) 152 C527+ nuclei were observed at the beginning. (B) 183 C527+ nuclei were observed at the end of 11.5 hr. Of the initial 152 cells, 110 did not divide (blue dots in A and B), 23 divided and both daughter cells are C527+ (purple dots), and 9 divided but only one daughter cell is C527+ (white dots). 14 C527+ nuclei (yellow dots in A) disappeared during this period. (C, D) A mid-L3 MZ97>H2B-RFP eye-antennal disc was cultured and monitored at 25°C for 20 hr (S8 Movie). (C) The MZ97+ nuclei present at time 0 are marked in blue. (D) The new MZ97+ nuclei are marked in white. No division was observed in MZ97+ nuclei. (E) MZ97>Fucci (S9 Movie) showed that the anterior MZ97+ cells (arrow) can progress from S phase (magenta) to G1 (green) without undergoing mitosis (magenta plus green). Only one round of endoreplication was observed for a WG during the observation period. (F, G) The migration tracks of C527+ (F) and MZ97+ (G) nuclei are presented as displacements from their origin, with blue representing the start and red representing the end of movement. (F’, G’) The isolated track of a few cells are shown as examples of the different behaviors. (H) Mitotic event in every 10 minutes in C527>H2B-RFP mid-L3 eye disc cultured for 11.5 hr (S7 Movie). The scale bar is 30 μm.
Fig 7
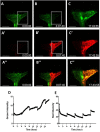
Fig 7. Selectively labeling of single carpet glia.
(A-C) The KAEDE fluorescent protein was expressed in the carpet glia by the C135-Gal4 driver. One of the two CGs was selectively illuminated by 514 nm laser in the boxed area. The KAEDE was photoconverted from green to red and the signal spread to the entire cell very rapidly. (D) The green signal showed nearly complete conversion to red and slowly recovered due to new protein synthesis. (E) The red signal decayed slowly, probably due to protein degradation. Subsequent boosts at lower laser power was at every 4 hr to maintain the red signal. N = 3. The scale bar is 50 μm.

Similar articles

Cited by

References

    1. Bosveld F, Bonnet I, Guirao B, Tlili S, Wang ZM, Petitalot A, et al. Mechanical Control of Morphogenesis by Fat/Dachsous/Four-Jointed Planar Cell Polarity Pathway. Science. 2012;336(6082):724–7. 10.1126/science.1221071. WOS:000303872300051. - DOI - PubMed
    1. Ghannad-Rezaie M, Wang X, Mishra B, Collins C, Chronis N. Microfluidic Chips for In Vivo Imaging of Cellular Responses to Neural Injury in Drosophila Larvae. Plos One. 2012;7(1). ARTN e29869 10.1371/journal.pone.0029869. WOS:000301570600007. - DOI - PMC - PubMed
    1. Heemskerk I, Lecuit T, LeGoff L. Dynamic clonal analysis based on chronic in vivo imaging allows multiscale quantification of growth in the Drosophila wing disc. Development. 2014;141(11):2339–48. Epub 2014/05/29. 10.1242/dev.109264 . - DOI - PubMed
    1. Taylor J, Adler PN. Cell rearrangement and cell division during the tissue level morphogenesis of evaginating Drosophila imaginal discs. Developmental biology. 2008;313(2):739–51. Epub 2007/12/18. 10.1016/j.ydbio.2007.11.009 - DOI - PMC - PubMed
    1. Ward RE, Reid P, Bashirullah A, D’Avino PP, Thummel CS. GFP in living animals reveals dynamic developmental responses to ecdysone during drosophila metamorphosis. Developmental biology. 2003;256(2):389–402. 10.1016/s0012-1606(02)00100-8 - DOI - PubMed

LinkOut - more resources