. 2016 Sep 29;7(9):e2378.
doi: 10.1038/cddis.2016.284.

Posttranslational arginylation enzyme Ate1 affects DNA mutagenesis by regulating stress response

Affiliations

Posttranslational arginylation enzyme Ate1 affects DNA mutagenesis by regulating stress response

Akhilesh Kumar et al. Cell Death Dis. .

Abstract

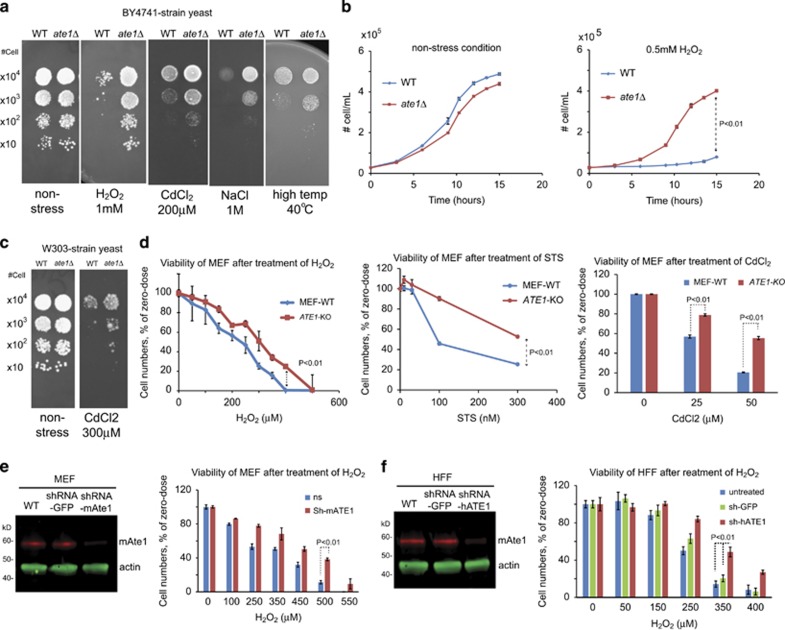
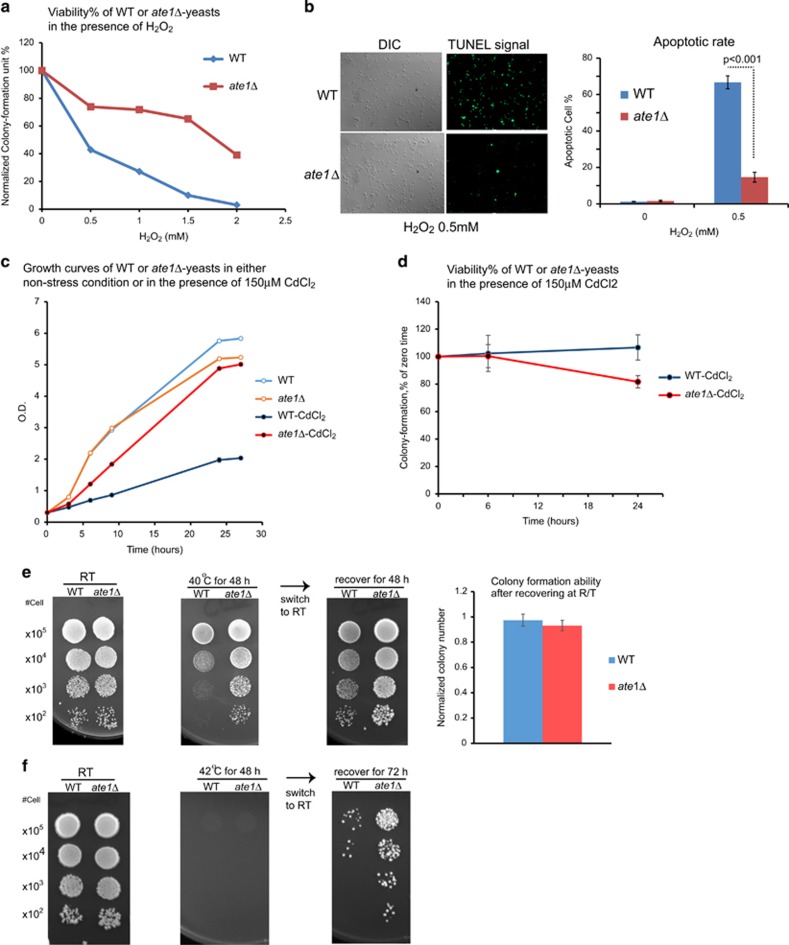
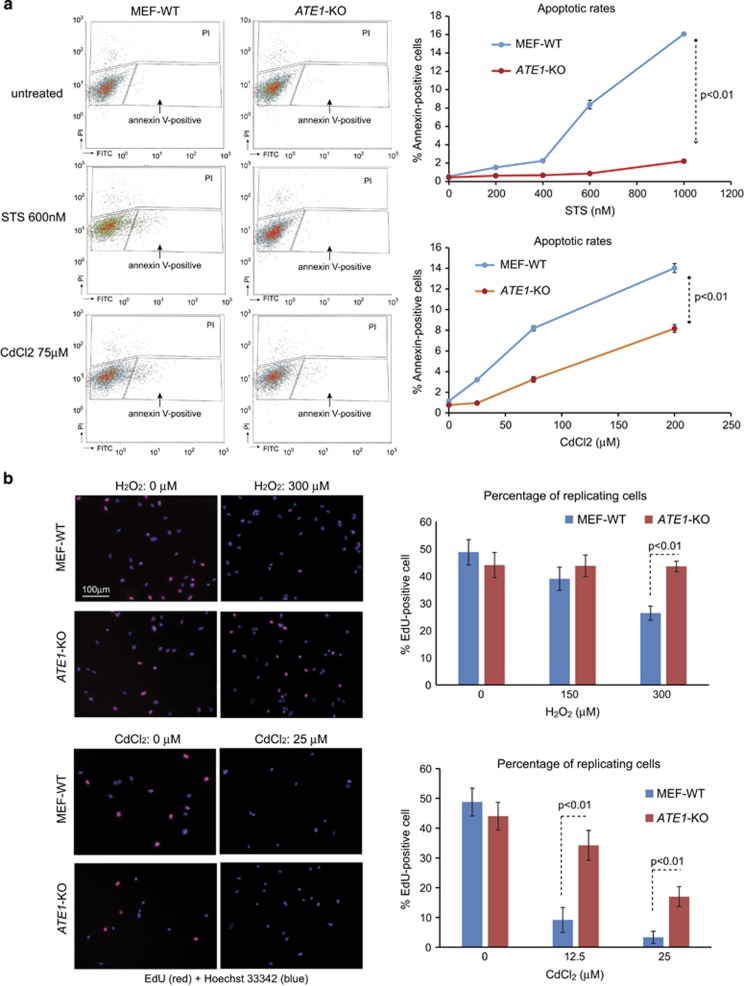
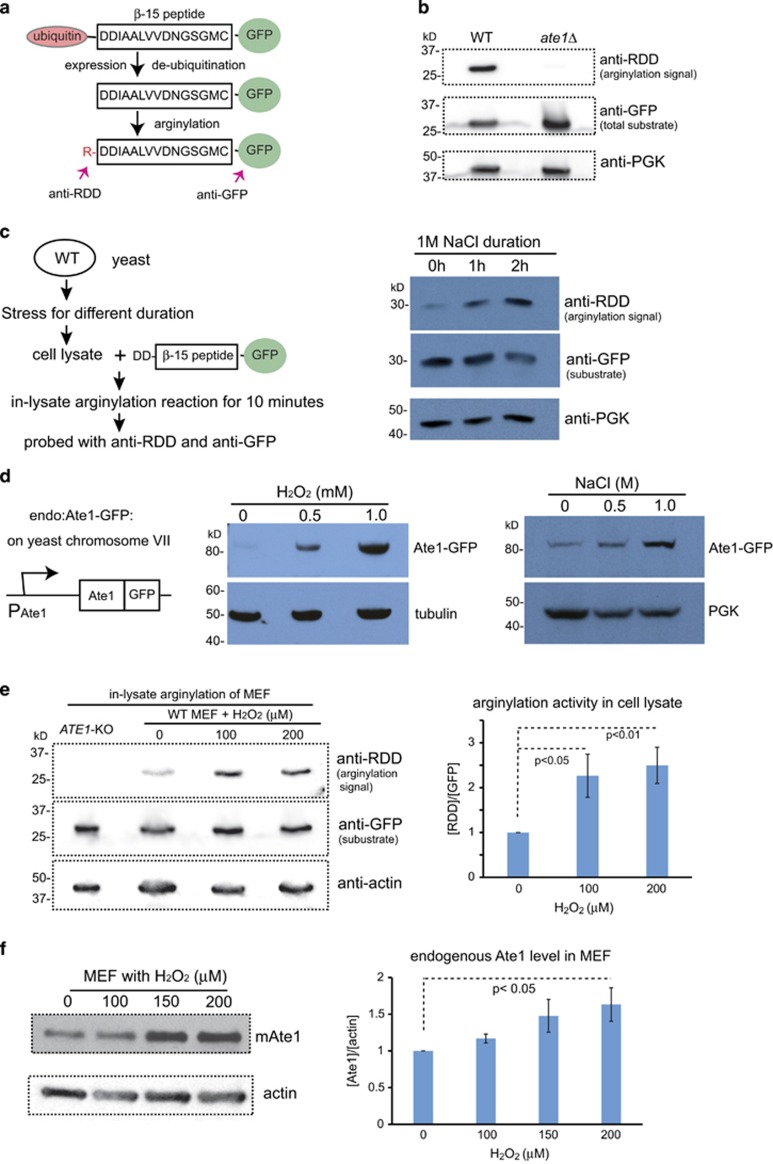
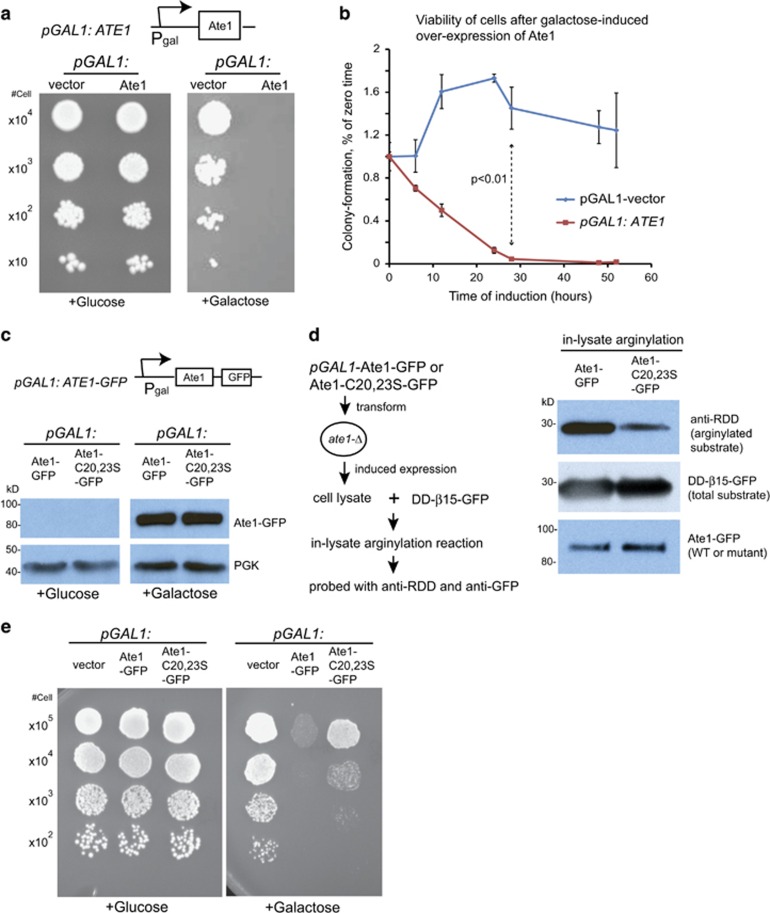
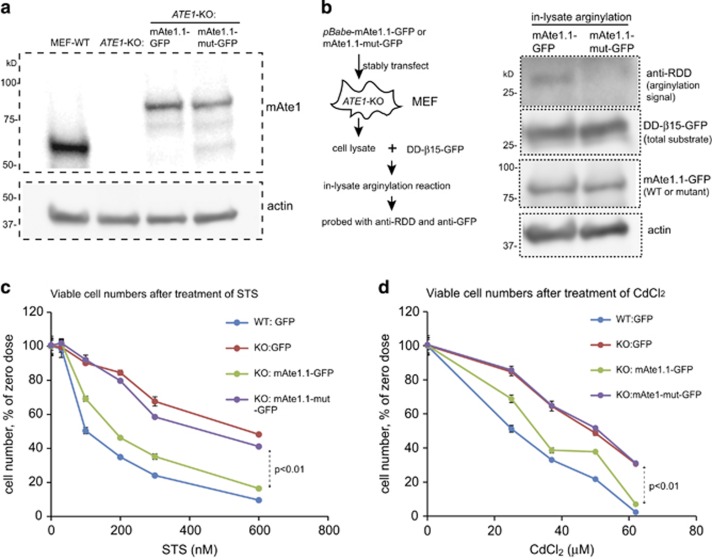
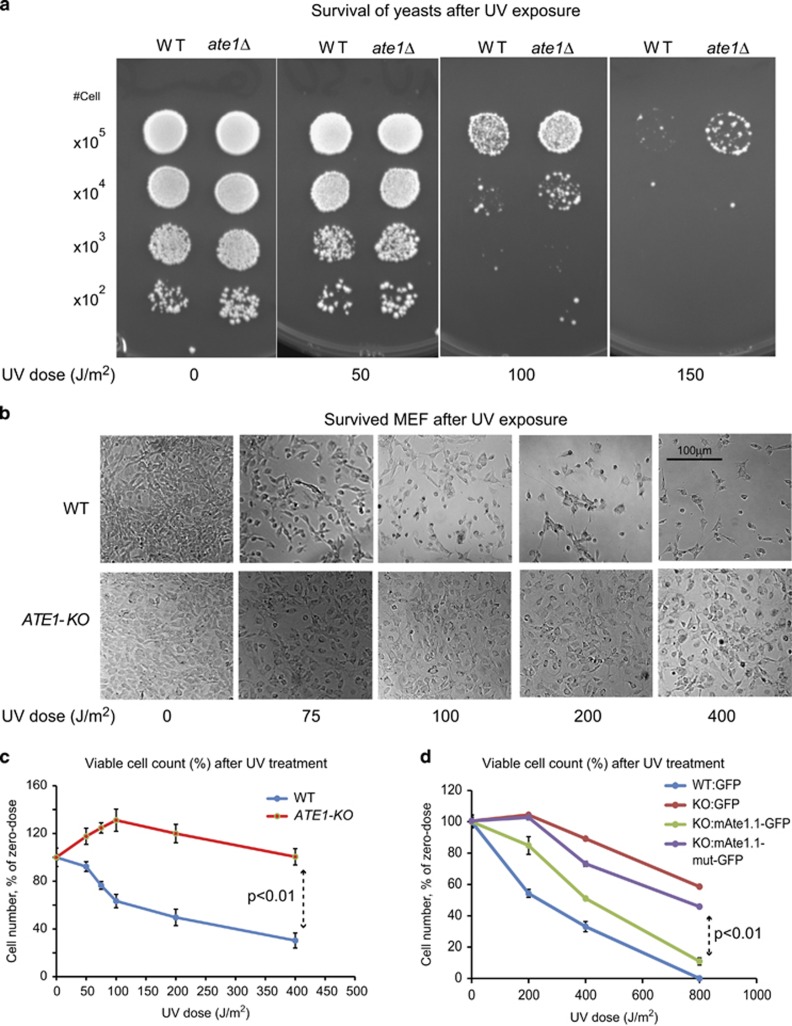
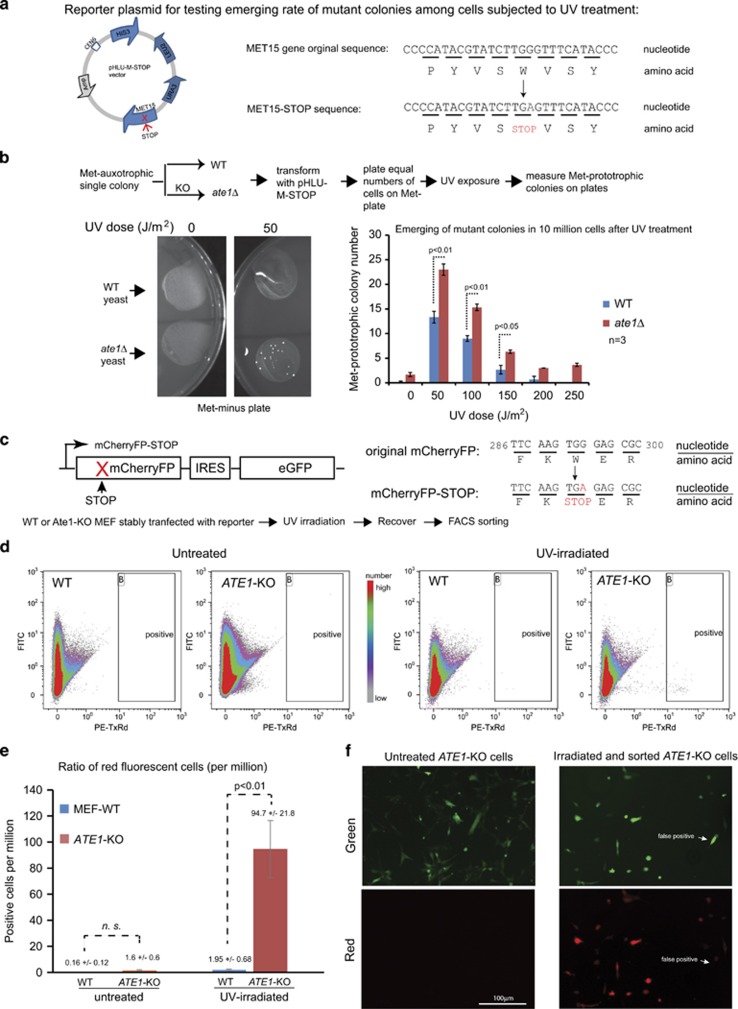
Arginyltransferase 1 (Ate1) mediates protein arginylation, a poorly understood protein posttranslational modification (PTM) in eukaryotic cells. Previous evidence suggest a potential involvement of arginylation in stress response and this PTM was traditionally considered anti-apoptotic based on the studies of individual substrates. However, here we found that arginylation promotes cell death and/or growth arrest, depending on the nature and intensity of the stressing factor. Specifically, in yeast, mouse and human cells, deletion or downregulation of the ATE1 gene disrupts typical stress responses by bypassing growth arrest and suppressing cell death events in the presence of disease-related stressing factors, including oxidative, heat, and osmotic stresses, as well as the exposure to heavy metals or radiation. Conversely, in wild-type cells responding to stress, there is an increase of cellular Ate1 protein level and arginylation activity. Furthermore, the increase of Ate1 protein directly promotes cell death in a manner dependent on its arginylation activity. Finally, we found Ate1 to be required to suppress mutation frequency in yeast and mammalian cells during DNA-damaging conditions such as ultraviolet irradiation. Our study clarifies the role of Ate1/arginylation in stress response and provides a new mechanism to explain the link between Ate1 and a variety of diseases including cancer. This is also the first example that the modulation of the global level of a PTM is capable of affecting DNA mutagenesis.


Figures

Figure 1
Figure 1
Knockout or knockdown of ATE1 decreases cellular sensitivity towards stressing conditions. (a) Growth test using serial dilutions of wild-type (WT) and ate1Δ yeast (S. cerevisae, BY4741 strain, unless otherwise mentioned) in non-stressing condition or in the presence of one of the following stressors: common cellular oxidant (H2O2, 1 mM), heavy metal (CdCl2, 200 μM), high salt (NaCl, 1 M) or high temperature (40 °C). For H2O2 treatment, cells were plated on SD plates with glucose. For the other treatments and the non-stressing controls, cells were plated on YPD plates. (b) Growth curves of WT and ate1Δ yeast cultured in liquid media, in the presence or absence of the oxidative stressor H2O2. Error bars represent S.D., n=3. (c) Growth test using WT or ate1Δ yeast (strain W303) in non-stressed conditions or in the presence of the heavy metal CdCl2 (300 μM). (d) Viabilities of WT or ATE1-KO mouse embryonic fibroblasts (MEFs) after 12 h treatments with increasing concentrations of cellular oxidant H2O2, bacterial toxin STS or heavy metal CdCl2. The number of viable cells after H2O2 treatment was measured by Calcein AM, a cellular dye that emits fluorescence only in live cells. The number of viable cells after STS and CdCl2 treatments was directly counted with an automated cell counter (TC-20 from Bio-Rad) with the cross-staining of Trypan blue, which stains dead cell but not live cells. In each type of cell, one sample of cells with control treatment (DMSO only) was used as normalization for other samples, for WT or ATE1-KO, respectively. Error bar represents S.E.M. of multiple repeats (n=4 for H2O2 and STS, and n=3 for Cdcl2). (e) Immunoblot analysis of the steady-state levels of mammalian Ate1 (mAte1) in MEF transfected with either shRNA specific against mouse ATE1 (sh-mATE1) or shRNA against GFP (used as a non-targeting control). The band of mAte1 was probed with a monoclonal antibody (Millipore, clone #6F11) recognizing all four major splicing variants of Ate1 in mammalian cells, which are almost identical in molecular sizes and poorly understood in functional differences. Actin was used as a loading control. The right panel graph shows the quantification of viability of MEFs transfected with Ate1 knockdown or non-targeting control, after the treatment with H2O2 for 12 h, as measured by the cellular viability indicator Calcein AM. Error bars represent S.E.M. (n=4). (f) Similar to e, except that human foreskin fibroblast (HFF) and shRNA against human ATE1 (sh-hATE1) were used. Error bars represent SEM (n=4). Throughout this study, the P-value was calculated by two-tailed Student's t-test between specific data points, unless otherwise indicated
Figure 2
Figure 2
Knockout of ATE1 in yeast relieves growth arrest and suppresses cell death during stress response. (a) Viability of wild-type (WT) or ate1Δ yeast after 3 h treatments with the indicated concentrations of the oxidative stressor H2O2, measured by the colony-forming unit assay and normalized to non-stressed conditions. (b) On the left are representative microscopic images showing the results of the TUNEL assay, which specifically detects DNA fragments generated during late stage of apoptosis. The WT and ate1Δ yeast treated with H2O2 0.5 mM. DIC images show the number of cells while the fluorescent images show cells with positive apoptosis signals (fluorescein). The graph in the right panel represents the percentage of apoptotic cells determined by TUNEL assay in WT and ate1Δ yeast treated with increased concentrations of H2O2. (c) Growth curves of WT and ate1Δ yeast cultured in liquid media, in the presence or absence of the heavy metal stressor CdCl2 of 150 μM. Error bars represent S.E.M. (n=3). (d) Viability of WT or ate1Δ yeast after indicated hours of treatments with 150 μM CdCl2, measured by the colony-forming unit assay and normalized to cells at time 0 (before the application of stressor). Error bars represent S.E.M. (n=3). (e) Growth test using serial dilutions of WT and ate1Δ yeast, either in non-stressing room temperature (RT) or in high temperature (40 °C) for 48 h followed by recovery at RT for another 48 h. After recovery at RT, the numbers of colonies emerged in the lowest dilution (× 102) were quantified. The corresponding numbers for yeast constantly cultured at RT was used for normalization for WT and ate1Δ yeast separately. Error bars represent S.E.M. (n=4 for WT, n=3 for ate1Δ). (f) Growth test using serial dilutions of WT and ate1Δ yeast, either in non-stressing RT or in high-temperature (42 °C) for 48 h followed by recovery at RT for another 72 h
Figure 3
Figure 3
Knockout of ATE1 in MEFs results in attenuated apoptosis and growth arrest during stress response. (a) Annexin-V-Alexa Fluor 488 (Thermo Fisher) was used to detect phosphatidylserine inversion on the peripheral membrane in an early stage of apoptosis. WT or ATE1-KO MEFs were treated with STS or CdCl2 of different concentrations for 5 h. Propidium iodide (PI) was used to label necrotic and late apoptotic fractions. The cell population is analyzed by FACS. On the left panel representative FACS charts are shown. The gate settings for Annexin-V and PI detection are indicated. Quantification of data from three independent repeats (n=3) are shown in graphs presented on the right side. ATE1-KO cells have a much lower apoptotic rate than WT cells. No obvious difference in PI staining was found in the conditions we tested. (b) On the left panel are the representative microscopic images showing WT and ATE1-KO MEFs treated with H2O2 0.5 mM. EdU (red fluorescently labeled), which is incorporated into newly synthesized DNA during the S phase of cell cycle, was used as a marker for cell proliferation. Hoechst 33342 (blue) was used to show the number and morphology of nucleus. Only cells with normal nuclear morphology and no sign of apoptotic bodies were included for quantification. At least 10 randomly chosen images in each group were used to generate the graphs shown on the right side for quantification of active replicating cells with EdU incorporated into their nucleus, in the presence of stressors H2O2 and CdCl2. Error bars represent S.E.M.
Figure 4
Figure 4
The levels of Ate1 protein and global arginylation activity are upregulated during stress. (a) A scheme illustrating how DD-β15-GFP is used as the reporter of arginylation activity. The fusion protein containing a stretch of 15 amino acids starting with two aspartic acids (D) derived from the N terminus of mammalian β-actin, a known substrate of arginylation. This peptide is fused with an N-terminal ubiquitin, which is cleaved co-translationally by endogenous de-ubiquitylation enzymes in eukaryotic system and leaves the aspartic acids as the new N terminus. The arginylation state of this reporter can be probed with an anti-RDD antibody, which only reacts with the arginylated form of the reporter protein. A C-terminal GFP tag is used to facilitate the detection of steady-state level of the reporter protein by immunoblotting with anti-GFP antibody. (b) The arginylation level of DD-β15-GFP expressed in either WT or ate1Δ yeast was examined with anti-RDD antibody, which only shows a visible signal in the WT cells. An antibody for GFP was used to probe the total protein level of the DD-β15-GFP. PGK was used as a loading control for total yeast cellular proteins. (c) Illustrative scheme (left panel) and representative immunoblots (right panel) showing the arginylation activity in cell lysates prepared from yeast exposed to 1 M NaCl stress for increasing times. The lysates were then mixed with the recombinant protein DD-β15-GFP prepared from ate1Δ yeast for an in-lysate arginylation reaction for 10 min at RT. The arginylation level of the reporter protein was detected by immunoblotting with anti-RDD antibody. The steady-state level of the reporter protein was probed with anti-GFP. An anti-3-phosphoglycerate kinase (PGK) antibody was also used as a loading control. (d) On the left, a scheme illustrating the domain structure of the ‘in locus' GFP-fused Ate1, which is driven be the endogenous ATE1 promoter at the native chromosome locus (Chromosome VII) in the yeast (termed ‘endo: Ate1-GFP'). The right panels present immunoblots showing the steady-state levels of ‘endo: Ate1-GFP' in yeast treated with increasing concentrations of different stressors: H2O2 (left) or NaCl (right). Tubulin or PGK was used as loading controls. (e) WT MEFs were exposed to increased concentrations of H2O2 for 30 h. The lysates from all these cells, as well as untreated ATE1-KO MEFs (as a control), were then mixed with the recombinant protein DD-β15-GFP purified from ate1Δ yeast for an in-lysate arginylation reaction for 45 min at RT. The arginylation level of the reporter protein was detected by immunoblotting with anti-RDD antibody. The steady-state level of the reporter protein was probed with anti-GFP. Actin antibody was used as a loading control. The graph on the right side shows quantification from four independent repeats. (f) Left: representative immunoblots showing the levels of endogenous Ate1 proteins in MEFs treated with increasing concentrations of H2O2 for 30 h, detected by a specific antibody for mouse Ate1 (Millipore, clone 6F11) recognizing all four major Ate1-splicing variants. Actin was used as loading controls. Right: quantification of the endogenous Ate1 level in MEFs treated with H2O2 from three independent repeats. The Ate1 level was calculated by normalization with actin loading control, and then further normalized to the level at non-stressing condition (0 μM H2O2). In all above figures, error bars represent S.E.M. and statistical significance was calculated by Student's t-test
Figure 5
Figure 5
The increase of Ate1 triggers cell death in yeast in a manner that is dependent on its arginylation activity. (a) The scheme in the top panel shows the domain structure of plasmid pGAL1: ATE1, in which the coding sequence of recombinant protein is preceded by the inducible GAL1 promoter. The picture in the bottom panel shows the growth of ate1Δ yeast cells carrying either the empty expression vector or pGAL1: ATE1 by a serial dilution growth assay on either plate containing glucose (suppressing) or galactose (inducing). (b) Graph showing the viabilities of ate1Δ yeast cells carrying either the empty expression vector or pGAL1: ATE1 in different time points following the initiation of galactose-induced expression, as measured by the numbers of colony-forming cells per OD unit (CFU) that were normalized to starting data point time 0, for Ate1 or vector control separately. Error bar represents S.E.M. (n⩾3). (c) The top scheme shows the domain structure of a recombinant Ate1 fused with a linker and a C-terminal GFP, driven by the pGAL1 promoter, termed ‘pGAL: Ate1-GFP'. Immunoblot analysis of the steady-state levels of wild-type and C20,23S mutant Ate1 after 9-h culture in the presence of non-inducing (glucose) or inducing (galactose) carbon sources. PGK was used as loading controls. Anti-GFP was used to probe the steady-state levels of the recombinant ‘pGAL: Ate1-GFP' (WT or mutant). (d) Left panel showing the procedure of using an in-lysate arginylation assay to measure the activities of recombinant Ate1-GFP, either the WT version or the C20,23S mutant, which were expressed for 9 h in ate1Δ yeast (see c for the steady-state levels of expressed proteins). Anti-RDD was used to indicate the level of arginylated reporter. Anti-GFP was used to show the total amount of reporter protein (DD-β15-GFP) in each sample, as well as the total amount of Ate1-GFP (either WT or mutant) present in each sample. These two bands were distinguished by their difference in molecular weight (27 kDa versus 92 kDa). (e) Representative pictures of growth test using serial dilutions of ate1Δ yeast carrying either the empty expression vector or pGAL1-Ate1-GFP, or pGAL1-Ate1-C20,23S-GFP, in media containing non-inducing (glucose) or inducing (galactose) carbon sources
Figure 6
Figure 6
Mammalian Ate1 is required for cellular sensitivity to stressors in a manner dependent on its arginylation activity. (a) Representative immunoblots showing the levels of Ate1 protein detected by a specific mouse Ate1 antibody (Millipore, clone 6F11) as either endogenous Ate1 in WT MEF or the recombinant mouse Ate1-isofrom 1 (WT or C23-26S mutant) fused with a C-terminal GFP stably transfected in ATE1-KO cells. Actin was used as a loading control. (b) Left panel showing the procedure of using an in-lysate arginylation assay to measure the activities of either the WT version of mAte1.1-GFP or the mutant with cysteine 23 and 26 to serine replacement (referred as mAte1.1-mut-GFP in this study) expressed in stably transformed ATE1-KO MEF. The arginylation reporter protein, DD-β15-GFP, as described in Figure 4, was expressed and purified from ate1Δ yeast. On the right panel, anti-RDD was used to probe the level of arginylation on the reporter protein. Anti-GFP was used to show the total amount of reporter protein (DD-β15-GFP) added in each sample. Mammalian Ate1 antibody (Millipore, clone# 6F11) was used to detect the level of mAte1.1-GFP (either WT or mutant) present in each sample. Actin was used as a loading control for cell lysates. (c) Graph showing the quantification of cell viability after treatment of different concentrations of STS for 12 h, for WT and ATE1-KO cells stably expressing either GFP (as transfection and expression control), GFP-fused recombinant mouse Ate1.1 or enzymatically impaired mutant mouse Ate1.1. The viable cells were counted by cell counter and using Trypan blue to exclude dead cells. For each group, the data were normalized to a sample under non-stressing condition. Error bars represent S.E.M. (n=3). (d) Similar to (c), except that a treatment of CdCl2 was used. Error bars represent S.E.M. (n=3)
Figure 7
Figure 7
Knockout of ATE1 increases cell viability upon UV irradiation. (a) Representative images of WT and ate1Δ yeast grown for 3 days after exposure to different doses of UV irradiation and recovery in the dark. (b) Representative images showing WT or ATE1-KO MEFs after exposure to increasing doses of UV irradiation and recovery for 24 h. (c) Quantification of viable cells at 12 h after UV treatment. Live cells were quantified with cell viability dye Calcein AM and the numbers were normalized to matching samples not irradiated (0 J/m2). Error bar represents S.E.M. (n=3). (d) Comparison of cell viabilities at 12 h after UV treatment for WT or ATE1-KO cells stably expressing either GFP (as transfection and expression control), mAte1.1-GFP or the catalytically impaired mAte1.1-mut-GFP. The number of viable cells was directly counted by cell counter and using Trypan blue to exclude dead cells
Figure 8
Figure 8
Knockout of ATE1 increases mutagenesis upon UV irradiation. (a) Scheme showing the construction of a mutagenesis reporter plasmid. On the left is the vector map of the pHLUM-stop plasmid, which contains three auxotrophic marker genes: HIS3, LEU2, URA3 and a mutated MET15 gene with a stop codon in the middle of its coding sequence. The scheme on the right shows a portion of the coding sequences and corresponding amino acids in the original MET15 gene and the mutated Met15 stop gene, where a TGG codon, coding for tryptophan (W), is converted to a TGA stop codon. (b) The top panel shows a flow chart describing the procedure followed to create isogenic pairs of WT and ate1Δ yeast and for testing emergence of Met-prototrophic mutant colonies on Met-minus plates starting with the same number of cells for UV irradiation. The bottom left panel has representative images showing the auxotrophic colonies emerged from 20 million yeast (in each spreading) without or with a low dose of UV exposure (50 J/m2). The graph on the bottom right is the quantification of the experiment on the left for all tested doses of UV irradiations. Error bar represents S.E.M. (n=3, except for the control non-irradiated groups where n=6). (c) Scheme showing the construction of a mammalian mutagenesis reporter, mCherryFP–STOP–IRES–GFP, which was modified from the pQC-XIG retroviral vector suitable for stable transfection. A STOP codon is inserted in the N-terminal region of the mCherryFP-coding region so that this protein cannot be expressed as full-length, unless an acquired mutation reverts it to a sense codon (revertant). The scheme on the right shows a portion of the coding sequences and corresponding amino acids in the original mCherryFP gene and the mutated mCherryFP–STOP gene, where a TGG codon, coding for tryptophan (W), is converted to a TGA stop codon. (d) Representative FACS charts showing the distribution of cell populations by their green and red fluorescence, for WT or ATE1-KO MEF, in untreated condition or treated with low-dose UV irradiations that are not expected to lead to significant cell death (two pulses of 20 J/m2 irradiations over 48 h, followed by 24 h recovery). The windows marked ‘B' were the gate setting used to quantify and sort red fluorescence-positive cells. (e) Quantification of mutated cells showing a red fluorescent signal in FACS in untreated or UV-irradiated cells from four independent repeats (n=4). In untreated condition, both WT and ATE1-KO cells have negligible numbers of revertants with no significant (NS, P>0.05) difference. After UV irradiations, although the WT cells have a moderate increase of revertants (~10 times), the increase in ATE1-KO is much larger (~100 times), resulting in a significant difference between the WT and KO cells. Error bar represents S.E.M. As mentioned before, the P-value was calculated by Student's t-test. (f) Representative fluorescent images of ATE1-KO MEFs stably expressing the reporter genes, either untreated or treated with UV irradiation and enriched for red fluorescent cells by FACS for culturing of up to 1 week. In untreated cells, no red fluorescence presented in any examined cells. In UV-irradiated and sorted cells, the vast majority of the examined cells have prominent red fluorescence, in addition to the green fluorescence from the internal expression marker GFP on the reporter construct, indicating that they are true revertants. The white arrow in the image points to a false-positive cell, which only has green fluorescence and not red fluorescence. Overall, <5% of false positive was found in the examined cells

Similar articles

Cited by

References

    1. Kaji H, Novelli GD, Kaji A. A soluble amino acid-incorporating system from rat liver. Biochim Biophys Acta 1963; 76: 474–477. - PubMed
    1. Kwon YT, Kashina AS, Davydov IV, Hu RG, An JY, Seo JW et al. An essential role of N-terminal arginylation in cardiovascular development. Science 2002; 297: 96–99. - PubMed
    1. Kurosaka S, Leu NA, Zhang F, Bunte R, Saha S, Wang J et al. Arginylation-dependent neural crest cell migration is essential for mouse development. PLoS Genet 2010; 6: e1000878. - PMC - PubMed
    1. Balzi E, Choder M, Chen WN, Varshavsky A, Goffeau A. Cloning and functional analysis of the arginyl-tRNA-protein transferase gene ATE1 of Saccharomyces cerevisiae. J Biol Chem 1990; 265: 7464–7471. - PubMed
    1. Kwon YT, Kashina AS, Varshavsky A. Alternative splicing results in differential expression, activity, and localization of the two forms of arginyl-tRNA-protein transferase, a component of the N-end rule pathway. Mol Cell Biol 1999; 19: 182–193. - PMC - PubMed

MeSH terms