

Genome Analysis of Osteosarcoma Progression Samples Identifies FGFR1 Overexpression as a Potential Treatment Target and CHM as a Candidate Tumor Suppressor Gene
- PMID: 27685995
- PMCID: PMC5042545
- DOI: 10.1371/journal.pone.0163859
Genome Analysis of Osteosarcoma Progression Samples Identifies FGFR1 Overexpression as a Potential Treatment Target and CHM as a Candidate Tumor Suppressor Gene
Abstract
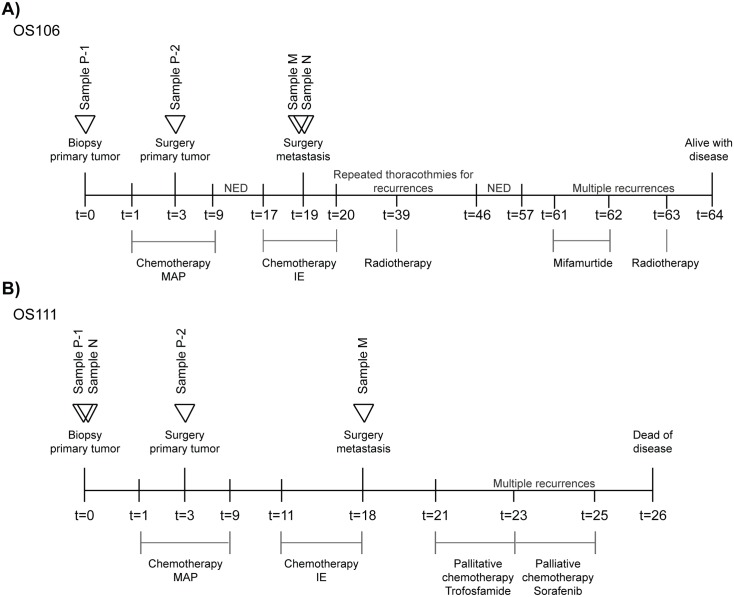
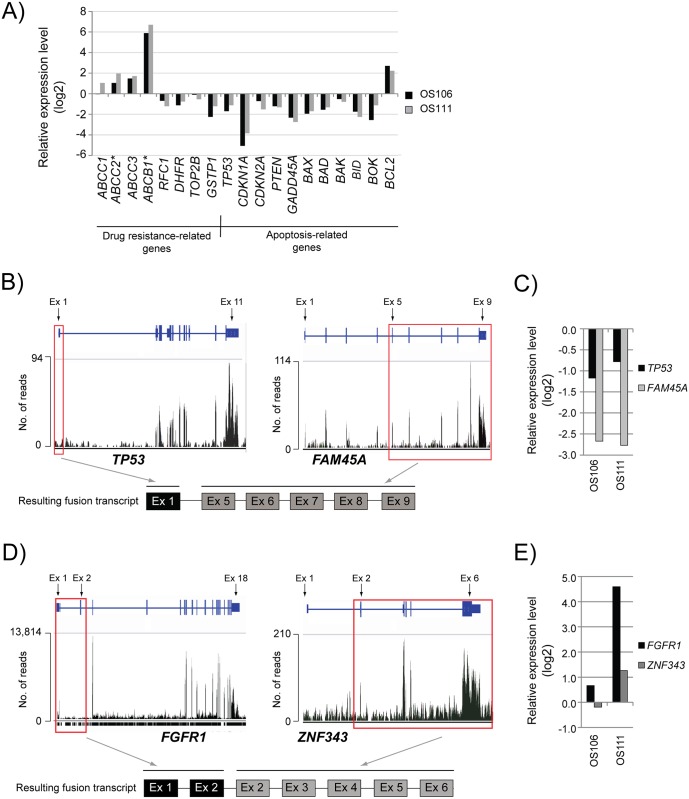
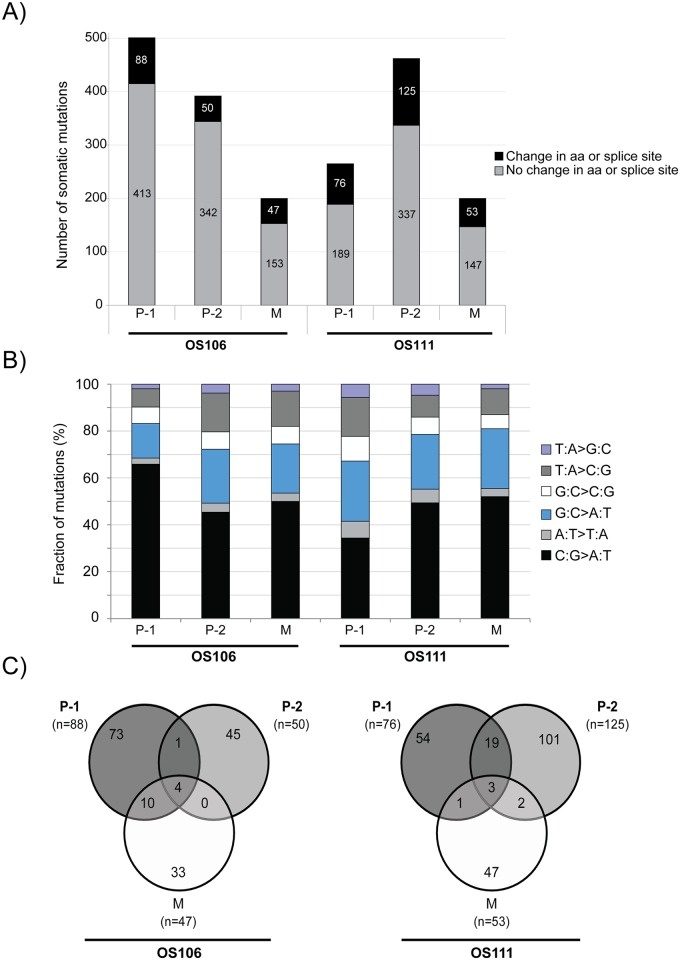
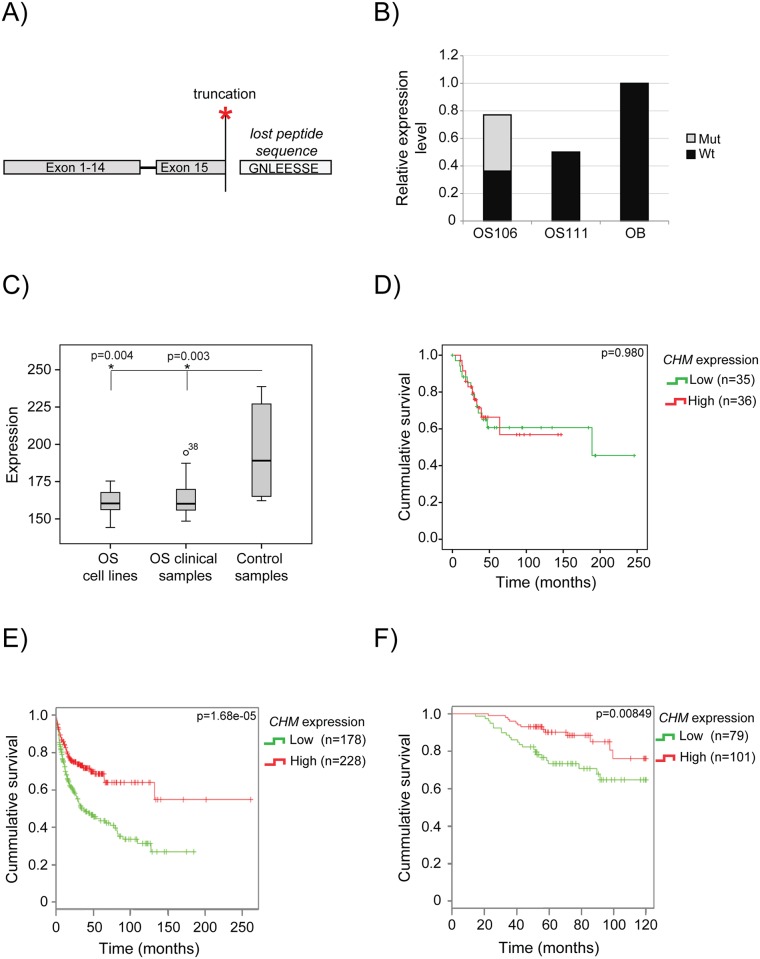
Osteosarcoma (OS) is the most common primary malignant tumor of bone, showing complex chromosomal rearrangements but with few known consistent changes. Deeper biological understanding is crucial to find new therapies to improve patient survival. We have sequenced the whole exome of two primary tumors (before and after chemotherapy), one metastatic tumor and a matched normal sample from two OS patients, to identify mutations involved in cancer biology. The metastatic samples were also RNA sequenced. By RNA sequencing we identified dysregulated expression levels of drug resistance- and apoptosis-related genes. Two fusion transcripts were identified in one patient (OS111); the first resulted in p53 inactivation by fusing the first exon of TP53 to the fifth exon of FAM45A. The second fusion joined the two first exons of FGFR1 to the second exon of ZNF343. Furthermore, FGFR1 was amplified and highly expressed, representing a potential treatment target in this patient. Whole exome sequencing revealed large intertumor heterogeneity, with surprisingly few shared mutations. Careful evaluation and validation of the data sets revealed a number of artefacts, but one recurrent mutation was validated, a nonsense mutation in CHM (patient OS106), which also was the mutation with the highest expression frequency (53%). The second patient (OS111) had wild-type CHM, but a downregulated expression level. In a panel of 71 clinical samples, we confirmed significant low expression of CHM compared to the controls (p = 0.003). Furthermore, by analyzing public datasets, we identified a significant association between low expression and poor survival in two other cancer types. Together, these results suggest CHM as a candidate tumor suppressor gene that warrants further investigation.
Conflict of interest statement
The authors have declared that no competing interests exist.
Figures
Similar articles
-
Deep Sequencing in Conjunction with Expression and Functional Analyses Reveals Activation of FGFR1 in Ewing Sarcoma.Clin Cancer Res. 2015 Nov 1;21(21):4935-46. doi: 10.1158/1078-0432.CCR-14-2744. Epub 2015 Jul 15. Clin Cancer Res. 2015. PMID: 26179511
-
Germline mutations of the p53 tumor suppressor gene in children with osteosarcoma.J Clin Oncol. 1994 May;12(5):925-30. doi: 10.1200/JCO.1994.12.5.925. J Clin Oncol. 1994. PMID: 8164043
-
Molecular pathology of primary and metastatic ductal pancreatic lesions: analyses of mutations and expression of the p53, mdm-2, and p21/WAF-1 genes in sporadic and familial lesions.Cancer. 1997 Feb 15;79(4):700-16. Cancer. 1997. PMID: 9024708
-
Intra-tumor heterogeneity in TP53 null High Grade Serous Ovarian Carcinoma progression.BMC Cancer. 2015 Nov 30;15:940. doi: 10.1186/s12885-015-1952-z. BMC Cancer. 2015. PMID: 26620706 Free PMC article.
-
p53 in breast cancer subtypes and new insights into response to chemotherapy.Breast. 2013 Aug;22 Suppl 2:S27-9. doi: 10.1016/j.breast.2013.07.005. Breast. 2013. PMID: 24074787 Review.
Cited by
-
Genetic profiling of osteosarcoma in an adolescent using a next‑generation sequencing panel and Sanger sequencing: A case report and review of the literature.Biomed Rep. 2025 Jan 3;22(3):42. doi: 10.3892/br.2025.1920. eCollection 2025 Mar. Biomed Rep. 2025. PMID: 39810900 Free PMC article.
-
Upregulation of ATG4A promotes osteosarcoma cell epithelial-to-mesenchymal transition through the Notch signaling pathway.Int J Clin Exp Pathol. 2017 Jul 1;10(7):7975-7982. eCollection 2017. Int J Clin Exp Pathol. 2017. PMID: 31966649 Free PMC article.
-
Filtering of the Gene Signature as the Predictors of Cisplatin-Resistance in Ovarian Cancer.Iran J Biotechnol. 2021 Jul 1;19(3):e2643. doi: 10.30498/ijb.2021.209370.2643. eCollection 2021 Jul. Iran J Biotechnol. 2021. PMID: 34825010 Free PMC article.
-
The Clinical Significance and Potential Molecular Mechanism of Upregulated CDC28 Protein Kinase Regulatory Subunit 1B in Osteosarcoma.J Oncol. 2021 Dec 10;2021:7228584. doi: 10.1155/2021/7228584. eCollection 2021. J Oncol. 2021. PMID: 34925510 Free PMC article.
-
Integration of single-cell sequencing and bulk expression data reveals chemokine signaling pathway in proliferating cells is associated with the survival outcome of osteosarcoma.BMC Med Genomics. 2023 Aug 3;16(1):180. doi: 10.1186/s12920-023-01617-5. BMC Med Genomics. 2023. PMID: 37537613 Free PMC article.
References
-
- Fletcher CDM, Bridge J.A., Hogendoorn P., Mertens F. WHO Classification of Tumours of Soft Tissue and Bone. Fourth Edition WHO, editor.: Lyon: IARC Press; 2013.
-
- Bielack SS, Kempf-Bielack B, Delling G, Exner GU, Flege S, Helmke K, et al. Prognostic factors in high-grade osteosarcoma of the extremities or trunk: an analysis of 1,702 patients treated on neoadjuvant cooperative osteosarcoma study group protocols. J Clin Oncol. 2002;20(3):776–90. Epub 2002/02/01. 10.1200/JCO.20.3.776 . - DOI - PubMed
LinkOut - more resources
Full Text Sources
Other Literature Sources
Molecular Biology Databases
Research Materials
Miscellaneous
