. 2016 Sep 30:7:12976.
doi: 10.1038/ncomms12976.

Flux of signalling endosomes undergoing axonal retrograde transport is encoded by presynaptic activity and TrkB

Affiliations

Flux of signalling endosomes undergoing axonal retrograde transport is encoded by presynaptic activity and TrkB

Tong Wang et al. Nat Commun. .

Erratum in

Abstract

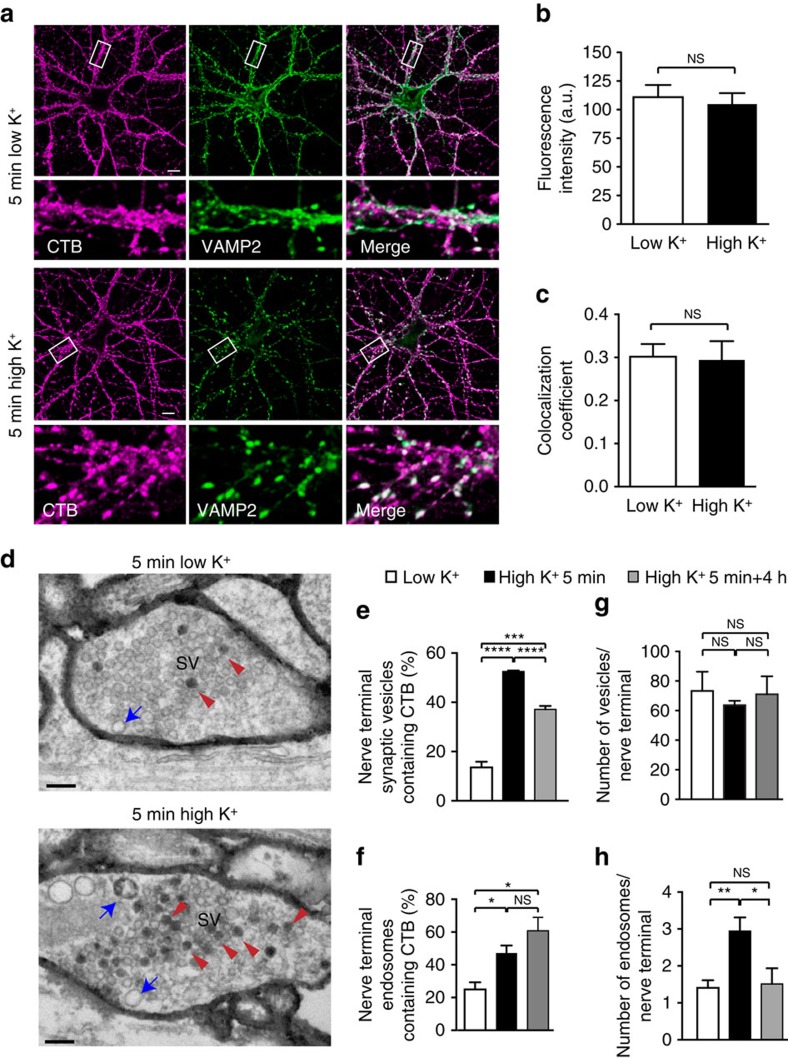
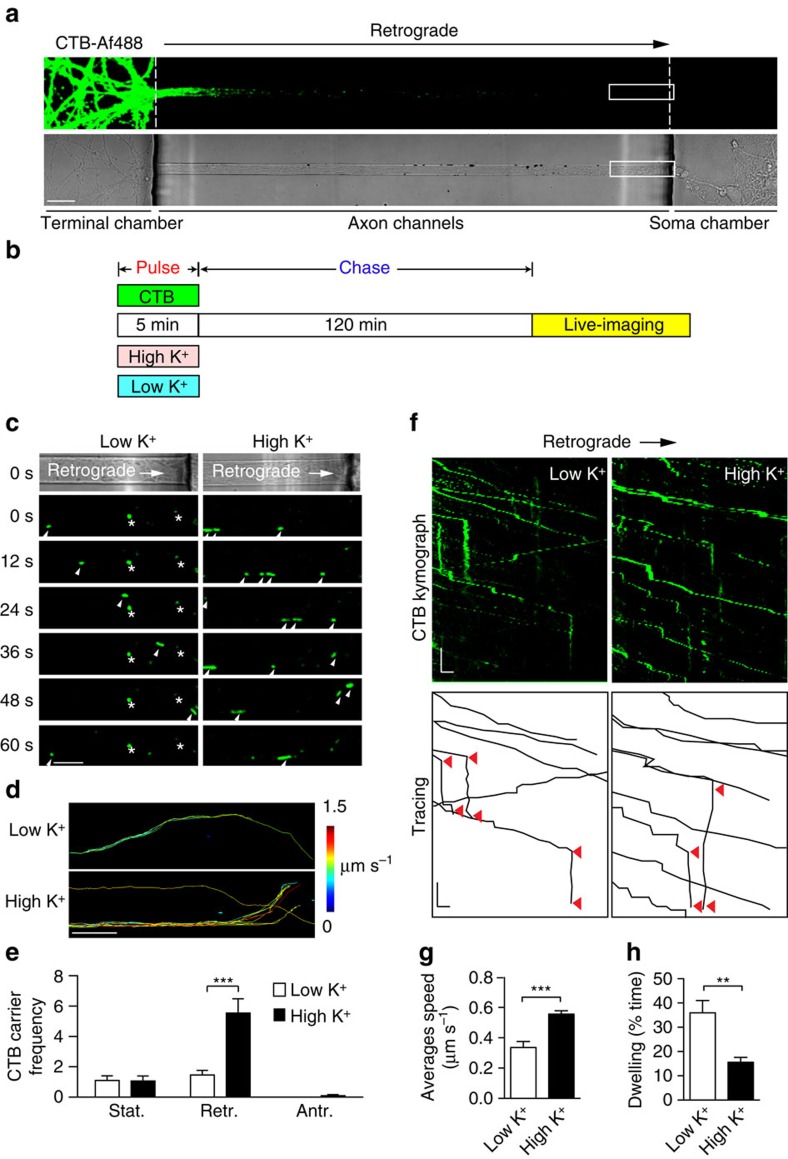
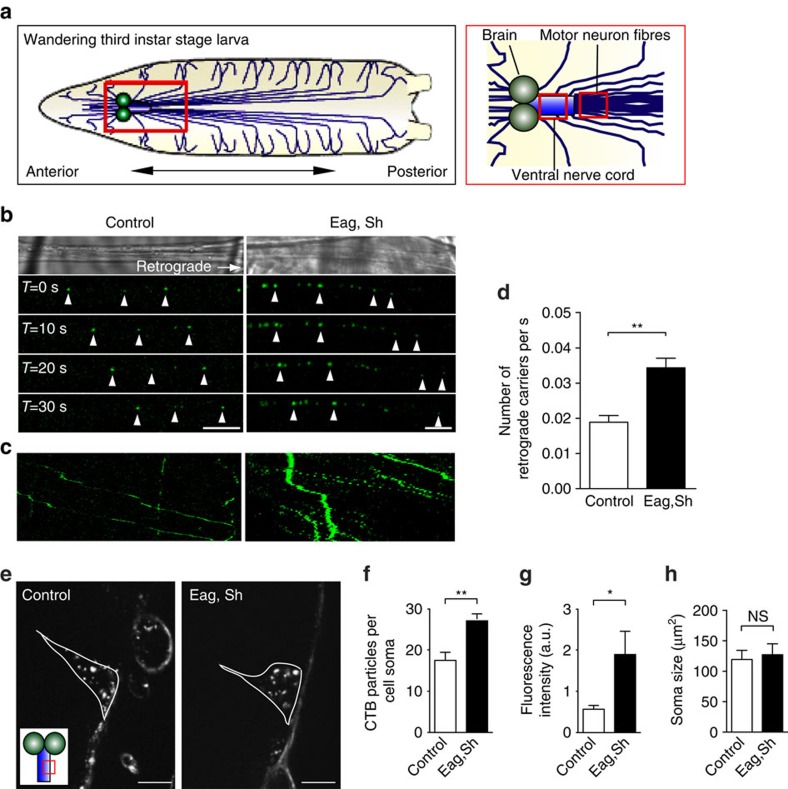
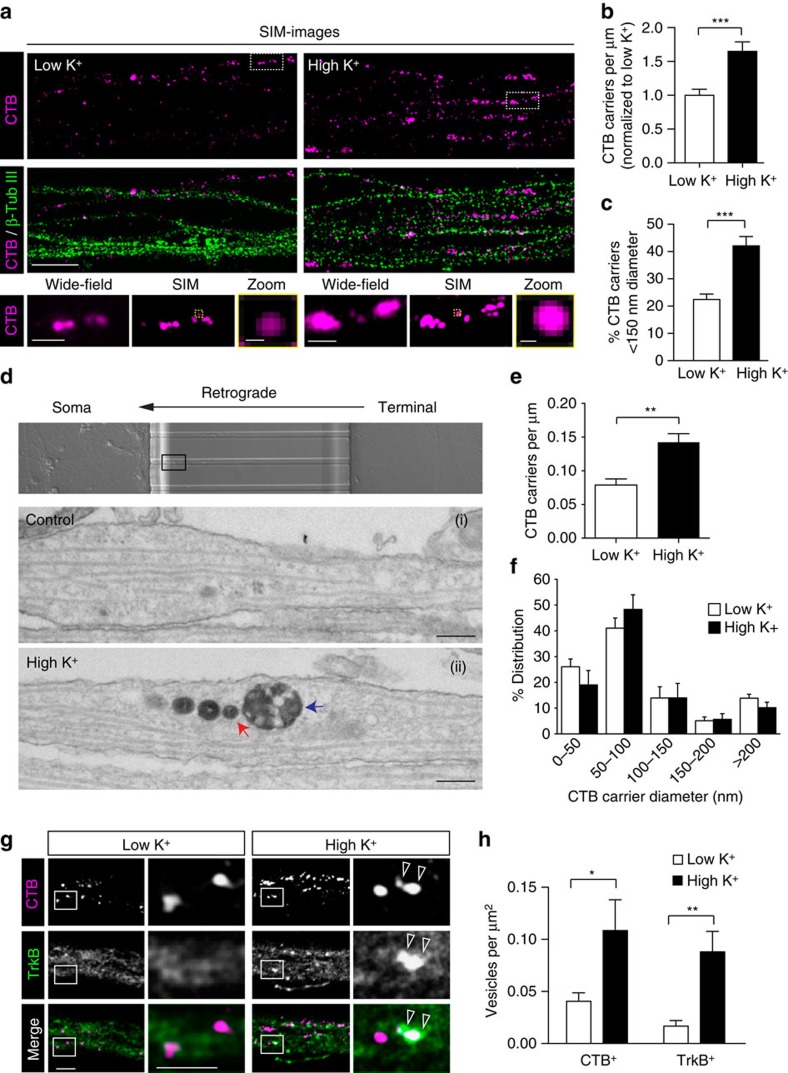
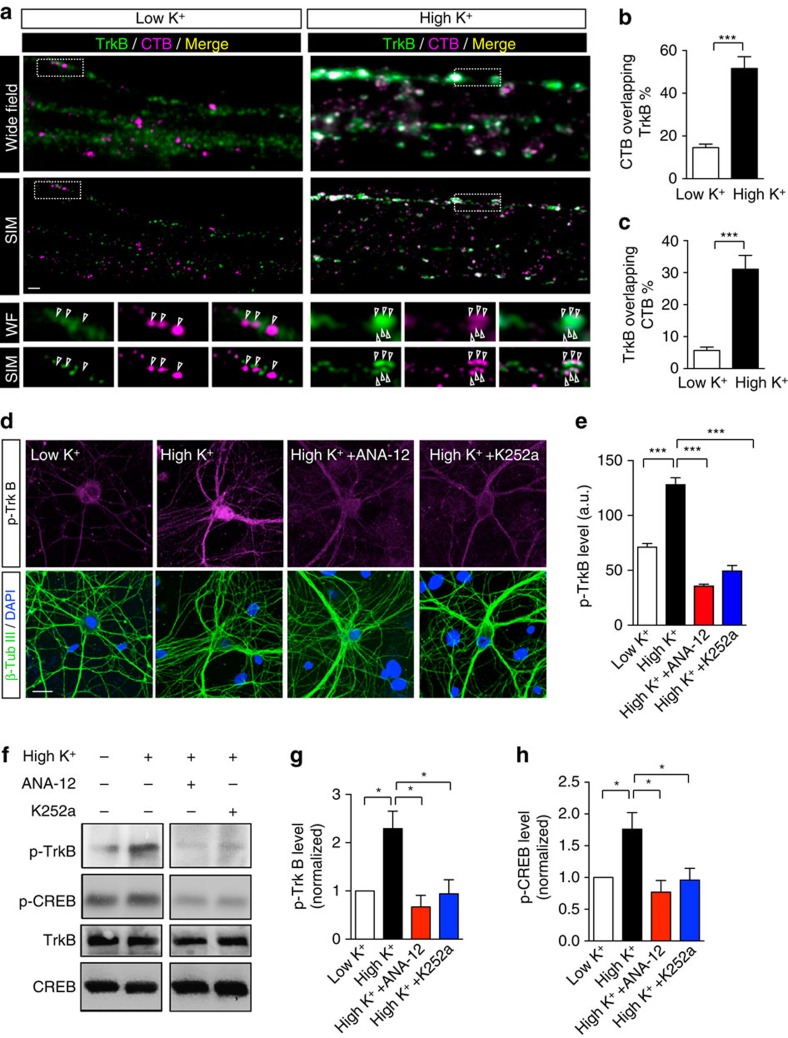
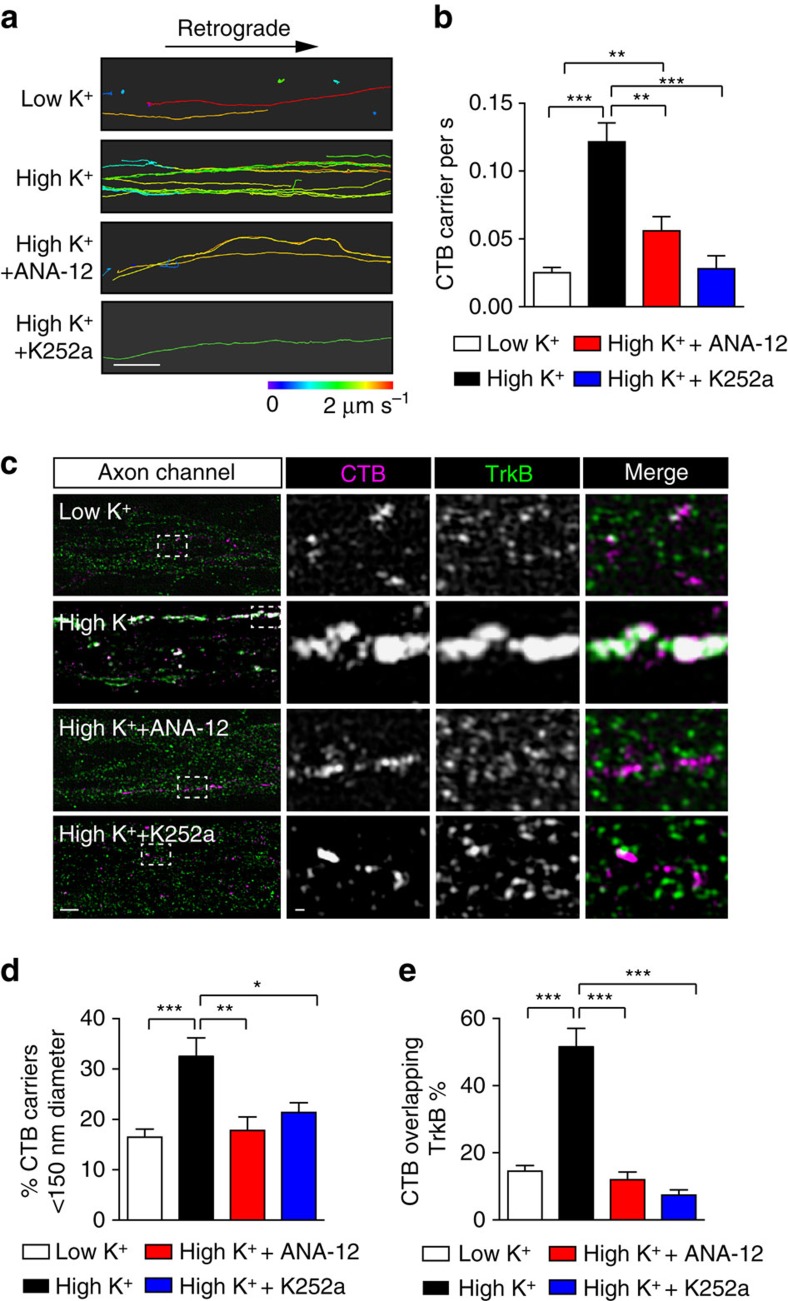
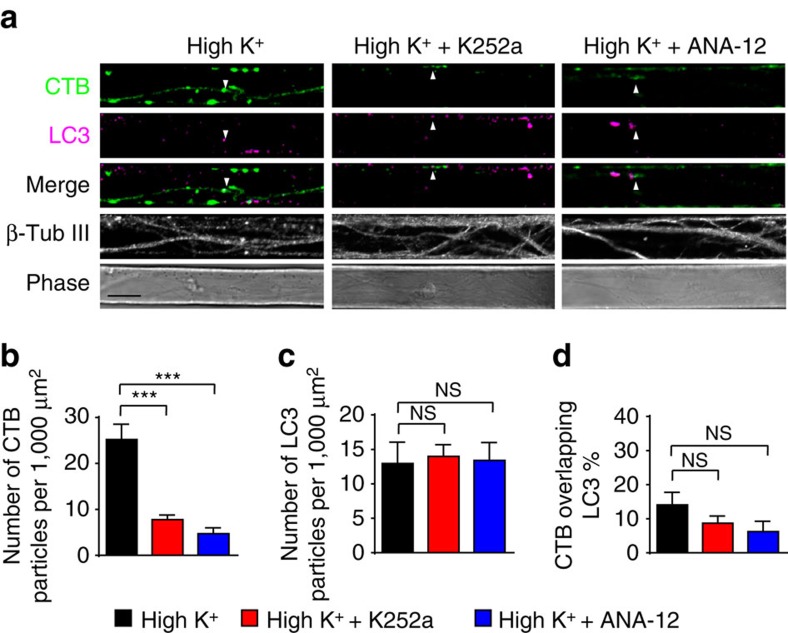
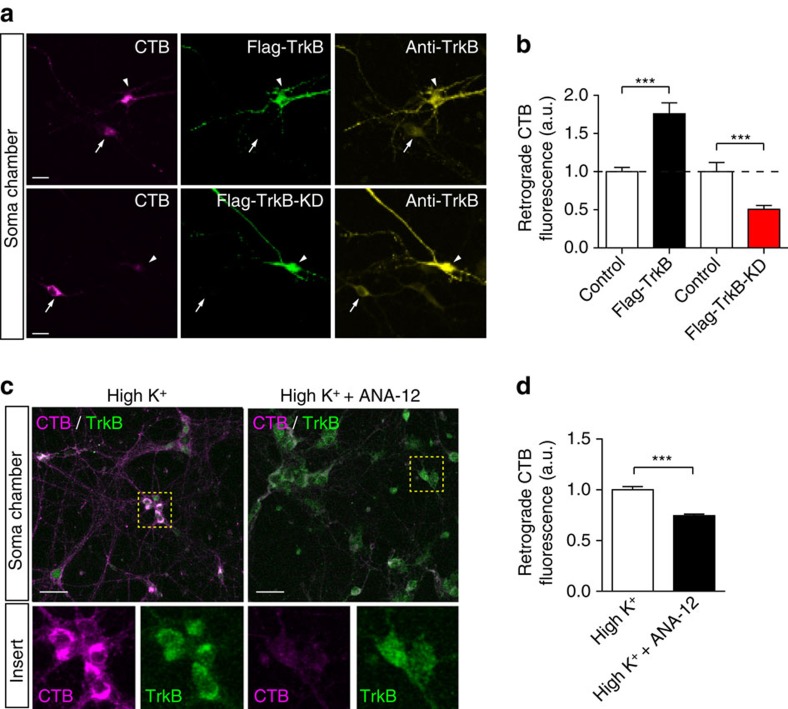
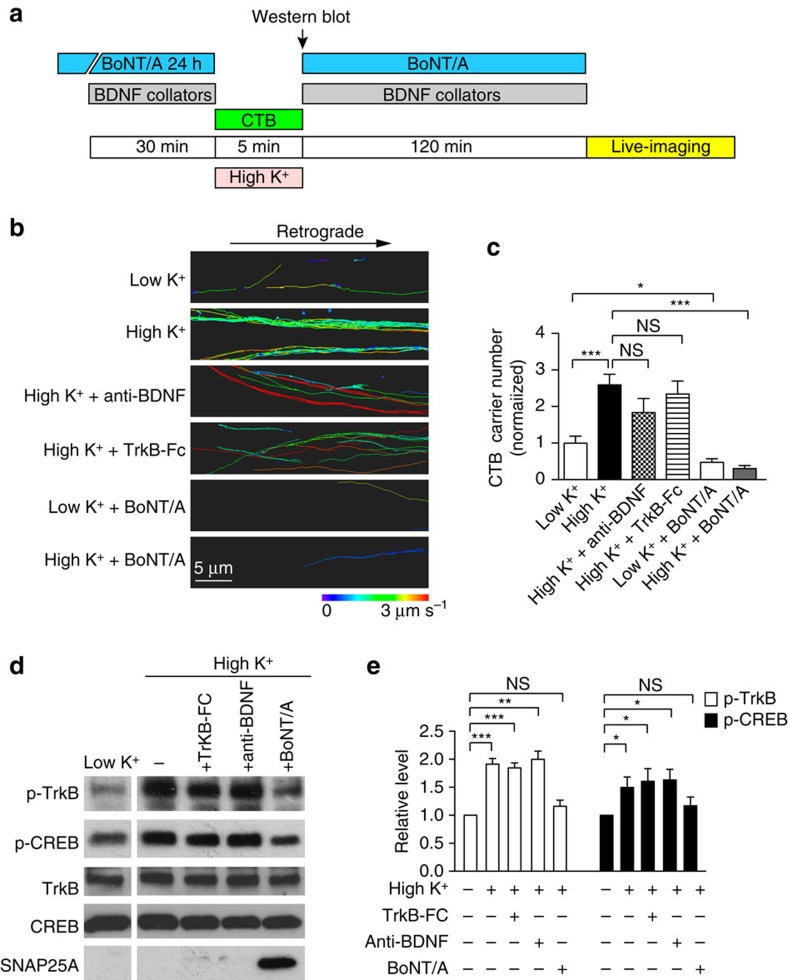
Axonal retrograde transport of signalling endosomes from the nerve terminal to the soma underpins survival. As each signalling endosome carries a quantal amount of activated receptors, we hypothesized that it is the frequency of endosomes reaching the soma that determines the scale of the trophic signal. Here we show that upregulating synaptic activity markedly increased the flux of plasma membrane-derived retrograde endosomes (labelled using cholera toxin subunit-B: CTB) in hippocampal neurons cultured in microfluidic devices, and live Drosophila larval motor neurons. Electron and super-resolution microscopy analyses revealed that the fast-moving sub-diffraction-limited CTB carriers contained the TrkB neurotrophin receptor, transiently activated by synaptic activity in a BDNF-independent manner. Pharmacological and genetic inhibition of TrkB activation selectively prevented the coupling between synaptic activity and the retrograde flux of signalling endosomes. TrkB activity therefore controls the encoding of synaptic activity experienced by nerve terminals, digitalized as the flux of retrogradely transported signalling endosomes.


Conflict of interest statement

The authors declare no competing financial interests.

Figures

Figure 1
Figure 1. Analysis of CTB binding and endocytosis in primary hippocampal neurons.
(a) Cultured hippocampal neurons were washed once with low K+ buffer then incubated with CTB-Af555 for 5 min in either low or high K+ buffer before fixation. Neurons were processed for immunocytochemistry using an anti-VAMP2 antibody. Scale abr, 10 μm. (b,c) Fluorescence intensity of CTB in regions of interest (ROIs) alone (b) or in co-localization with VAMP2 (Pearson’s coefficient) (c) were determined for each condition, and no significant difference in either analysis was observed between low and high K+ treatments. (mean±s.e.m., n=3 independent experiments, 10 cells (2 ROIs each) per experiment, Student’s t-test). (d) Cultured hippocampal neurons incubated with CTB-HRP (10 μg ml−1) for 5 min in either low or high K+ buffer before fixation. Cells were fixed, processed for DAB cytochemistry and imaged by electron microscopy. Compartments within the presynaptic terminal containing endocytosed CTB were identified using the DAB reaction product. Compartments were identified as vesicles (red arrowheads) or endosomes (blue arrows). Scale bar, 200 nm. (eh) Cultured hippocampal neurons were treated as in a, then either fixed (5 min) or returned to growth medium for 4 h before fixation (5 min+4 h). Following processing, the number of small vesicles (<80 nm diameter) and endosomes (>80 nm diameter) per nerve terminal were quantified and the proportion of these compartments containing CTB was determined (mean±s.e.m., n=3–4 individual neuron preparations, >20 nerve terminals per preparation. *P<0.05, **P<0.01, ***P<0.001, ****P<0.0001, NS, not significant, Student’s t-test).
Figure 2
Figure 2. The flux of retrograde CTB carriers is activity-dependent in cultured rat hippocampal neurons.
(a) CTB-Af488 labelling was performed in nerve terminals of hippocampal neurons cultured in microfluidic devices. CTB retrograde trafficking was captured in the observation window along the axon channels (boxed). Scale bar, 20 μm. (b) Hippocampal neurons cultured in microfluidic chambers were pulsed at 37 °C for 5 min with CTB in low- or high-K+ buffers, followed by wash-off of the pulse solutions before a chase in the original culture medium for 2 h. They were then live-imaged with confocal microscopy. (c) Time-lapse images of CTB carriers of axons as described in a; arrowheads delineate the retrograde carriers. Asterisks indicate stationary carriers. Scale bar, 10 μm. (d) Imaris tracing of CTB tracks in representative movies (colour-coded for average speeds of 0–1.5 μm s−1). Scale bar, 10 μm. (e) Number of retrograde CTB carriers after high or low K+ treatment. (f) Representative kymographs of CTB carriers along a single axon. Tracing demonstrates track displacement and static periods (dwelling, red arrowheads). x— Scale bar, 5 μm; y— Scale bar, 20 s. (g,h) The average track speed (g) and dwelling time (h) were determined in low and high K+. (mean±s.e.m., n=15 and 20 channels for low and high K+ respectively, data from three independent experiments, Student’s t-test, **P<0.01, ***P<0.001).
Figure 3
Figure 3. CTB axonal retrograde carrier flux is controlled by synaptic activity in D. melanogaster motor neurons.
(a) Schematic figure of a Drosophila third instar stage larva; the central nervous system is detailed on the right. (b) Control and eag, Sh larva preparations were incubated with CTB-Af488 for 2 h, followed by time-lapse imaging by confocal microscopy. Arrowheads indicate the retrograde movement of the CTB-positive carriers along the motor neuron fibres in successive frames. Scale bar, 5 μm. (c) Kymographs generated from the same time-lapse movies shown in b. (d) Quantitative analysis of the flux of CTB-positive retrograde carriers in control, and eag, Sh Drosophila larva motor axons. (mean±s.e.m., n=15 and n=14 for control and eag, Sh, respectively, data from four independent preparations for each condition, **P<0.01, Student’s t-test). (e) Accumulation of retrogradely transported CTB-positive cargoes in motor neuronal cell bodies located in the ventral nerve cord of control and eag, Sh larvae after 4 h incubation with CTB-Af555. Inset indicates the location of the imaged cell bodies. Scale bar, 10 μm. Quantification of accumulated CTB-positive structures as number of structures per cell body (f) and as fluorescence intensity (g). The size of the motor neuronal soma was quantified in (h). (mean±s.e.m., n=9 and n=10 for control and eag, Sh, respectively, data from four independent preparations, *P<0.05, **P<0.01, NS, not significant, Student’s t-test).
Figure 4
Figure 4. CTB retrograde carrier flux is composed of small aligned vesicular compartments.
(a) Dual-colour SIM on axon channels of microfluidic chambers labelled with CTB under either low K+ (left) or high K+ (right) conditions, β-tubulin III was used to label the axon fibers. Scale bar, 5 μm. Boxes are magnified in the lower panels; original wide-field images are compared with the SIM images of the same region (Scale bar, 1 μm), and individual CTB carriers are further magnified in yellow boxes (Scale bar, 100 nm). The resolution is ∼100 nm. Quantification of total (b) and small CTB carriers (diameter<150 nm) (c) from SIM images (Mander’s coefficient, mean±s.e.m., n=27 for low K+, n=31 for high K+, ***P<0.001, data from four independent preparations, Student’s t-test). (d) Electron microscopy of axons from neurons pulse-chased with CTB-HRP as described in a. Small vesicular carriers—red arrows, multivesicular body—blue arrow. Scale bar, 200 nm. (e) Quantification of the number of carriers per μm neurite length per axon channel. (mean±s.e.m., n=7 (low K+) or 16 (high K+) channels from two independent neuron preparations. **P<0.01) (f) Size distribution of CTB carriers in low K+ and high K+ stimulated cells (n=3 independent neuron preparations). (g) Confocal microscopy of axons from neurons pulse-chased with CTB as described in (a). Endogenous TrkB immunostaining is shown in green, CTB vesicles that co-localized with TrkB are indicated with arrowheads. Scale bar, 5 μm. (h) Quantification of CTB-positive (CTB+) and TrkB-positive (TrkB+) carriers after low K+ or high K+ treatments (n=10 and 11 for high K+ and low K+, *P<0.05, **P<0.01, data from two independent preparations; NS, not significant, Student’s t-test).
Figure 5
Figure 5. Activation of TrkB controls the activity-induced increase in CTB retrograde flux.
(a) Representative wide-field and SIM images of axons in microfluidic chambers that were labelled with CTB (magenta) under either low K+ (left) or high K+ (right) conditions. TrkB antibody (green) was used to label endogenous TrkB receptors. Boxed regions magnified in the lower panels, and aligned CTB vesicles are pointed out with arrowheads. Scale bar, 1 μm. (b,c) Quantification of the ratio of CTB overlapping with TrkB (b), and the ratio of TrkB overlapping with CTB (c) from SIM images. (Mander’s coefficient, mean±s.e.m., n=39 (low K+) or n=46 (high K+) channels from three independent neuron preparations. ***P<0.001, Student’s t-test). (d) Activation of th TrkB pathway was examined with an antibody against phosphorylated Tyr707/706 of TrkB receptors (top panels). Pretreatment with 0.5 μM ANA-12 or 100 nM K252a for 30 min significantly inhibited the high K+-induced p-TrkB increase; β-tubulin III and DAPI (bottom panels) were used to show the density of neuron layers. Scale bar, 20 μm. (e) Quantification of d. (mean±s.e.m., n=29 (low K+) or 30 (high K+) channels from three independent neuron preparations. ***P<0.001, Student’s t-test). (f) Western blot of DIV 14 hippocampal neurons pretreated with 0.5 μM ANA-12 or 100 nM K252a for 30 min showing the same abolition of the high K+ induced increase in p-TrkB and phosphorylated CREB protein (p-CREB), which represented the downstream response; total TrkB and CREB protein levels were used as controls. (gh) Quantification of f. (mean±s.e.m., n=3, data from three independent cultures, *P<0.05, Student’s t-test).
Figure 6
Figure 6. Pharmacological inhibition of TrkB activation abolishes the activity-dependent increase in CTB carrier flux undergoing retrograde axonal transport.
(a) Representative images of CTB retrograde flux inside the axon channels of hippocampal neurons pretreated with 0.5 μM ANA-12 or 100 nM K252a for 30 min before high K+ pulse-chase. Neurons pulse-chased with low or high K+ alone were used as controls. Time-lapse images were tracked with Imaris software, and the tracks shown are colour-coded based on the average speed. Scale bar, 10 μm. Both inhibitors significantly abolished thehigh K+ stimulation-induced CTB flux, as reflected by the decreased number of CTB carriers trafficking through the axon channels per second as quantified in b, (mean±s.e.m., n=78 (low K+), 81 (high K+), 83 (high K++ANA-12) and 45 (high K++K252a) tracks, data from 3 independent neuron preparations, *P<0.05, **P<0.01,***P<0.001, Student’s t-test). (c) Representative SIM images of axons in microfluidic chambers. Neurons were labelled with CTB (red) under either low K+ or high K+ conditions. In the bottom groups, neurons were pretreated with ANA-12 or K252a for 30 min before high K+ stimulation. TrkB antibody (green) was used to label endogenous TrkB receptors, Scale bar, 2 μm. Boxed regions are magnified in the right panels, Scale bar, 200 nm. (d,e) Both inhibitors significantly reduced the number of small CTB carriers with a diameter <150 nm (d), as well as the ratio of CTB overlapping with TrkB as quantified in (e). (Mander’s coefficient, mean±s.e.m., n=39 (low K+), 46 (high K+), 32 (high K++ANA-12) and 25 (high K++K252a) tracks, data from three independent neuron preparations, *P<0.05, **P<0.01,***P<0.001, Student’s t-test).
Figure 7
Figure 7. Pharmacological inhibition of TrkB activation has no effect on LC3-positive autophagosomes.
(a) Representative images of axons in microfluidic chambers labelled with CTB under high K+ or pretreated with ANA-12, K252a for 30 min. TrkB antibody was used to label endogenous TrkB receptors, and co-localization is indicated with arrowheads. Scale bar, 10 μm. (bd) Both inhibitors significantly reduced the number of CTB carriers (b) but had no significant effect on the level of the autophagosome marker LC3 in the same region of interest (c). The ratio of CTB overlapping with LC3 was also not affected (d). (Mander’s coefficient, mean±s.e.m., n=39 (high K+), 39 (high K++ANA-12) and 38 (high K++K252a) channels, data from two independent neuron preparations, ***P<0.001, NS, no significant difference; Student’s t-test).
Figure 8
Figure 8. Genetic inhibition of TrkB activation prevents the activity-dependent retrograde transport of CTB.
(a) DIV14–16 hippocampal neurons cultured in microfluidic chambers were transfected with Flag-TrkB-WT or Flag-TrkB-KD plasmids, and subsequently labelled with CTB under pulse-chased high K+. The fluorescence intensity of retrogradely transported CTB was observed with confocal microscopy in transfected neurons (arrow) and adjacent untransfected neurons (arrowheads) in the soma chambers only. Scale bar, 20 μm. (b) Quantification of a (mean±s.e.m., n=26, 46, 34 and 42 for the control, Flag-TrkB, control and Flag-TrkB-KD groups respectively, data from three independent cultures, ***P<0.001, Student’s t-test). (c) Neurons cultured in microfluidic chambers were labelled with CTB under high K+ pulse, then pretreated with 0.5 μM ANA-12 for 30 min. The fluorescence intensity of retrogradely transported CTB and endogenous TrkB were observed with confocal microscopy in the soma chambers. Scale bar, 50 μm. (d) Quantification of (c). (mean±s.e.m., n=15 and 17 for low K+ and high K+ groups, respectively, data from three independent cultures, ***P<0.001, Student’s t-test).
Figure 9
Figure 9. Activity-dependent CTB retrograde flux is dependent on synaptic activity but not endogenous BDNF secretion.
(a) Hippocampal neurons cultured in microfluidic chambers were pretreated with 100 pM BoNT/A for 24 h or 20 μg ml−1 BDNF collators (BDNF blocking antibody; TrkB-Fc) for 30 min before 5 min CTB pulse in low or high K+ buffers as indicated. After wash-off, the chambers were chased in the original culture medium containing BoNT/A or BDNF collators for 2 h, then live-imaged with confocal microscopy. For western blotting, neurons were collected without the 2 h chase. (b) Imaris tracing of CTB tracks in representative live-imaging movies as treated in a, colour-coded average speed 0–3 μm s−1. Scale bar, 5 μm. (c) Number of retrograde CTB carriers with indicated treatments (mean±s.e.m., n=14, 31, 26, 13, 17 and 17 for low K+, high K+, high K++anti-BDNF, high K++TrkB-Fc, low K++BoNT/A and high K++BoNT/A, respectively, data are from three independent cultures, student’s t-test, *P<0.05; ***P<0.001; NS, not significant). (d) Western blot of treated hippocampal neurons showing that the high K+-induced increases in p-TrkB and p-CREB were not affected by BDNF collators but were abolished by BoNT/A treatment; total TrkB and CREB protein levels were used as controls. (e) Quantification of (d). (mean±s.e.m., n=3, data from three independent cultures, *P<0.05; **P<0.01; ***P<0.001; NS, not significant; Student’s t-test).

References

    1. Schmieg N., Menendez G., Schiavo G. & Terenzio M. Signalling endosomes in axonal transport: travel updates on the molecular highway. Semin. Cell Dev. Biol. 27, 32–43 (2014). - PubMed
    1. Beattie E. C. et al.. A signaling endosome hypothesis to explain NGF actions: potential implications for neurodegeneration. Cold Spring Harb. Symp. Quant. Biol. 61, 389–406 (1996). - PubMed
    1. Howe C. L. & Mobley W. C. signalling endosome hypothesis: a cellular mechanism for long distance communication. J. Neurobiol. 58, 207–216 (2004). - PubMed
    1. Ye H., Kuruvilla R., Zweifel L. S. & Ginty D. D. Evidence in support of signaling endosome-based retrograde survival of sympathetic neurons. Neuron 39, 57–68 (2003). - PubMed
    1. Cosker K. E. & Segal R. A. Neuronal signaling through endocytosis. Cold Spring Harb. Perspect. Biol. 6, a020669 (2014). - PMC - PubMed

LinkOut - more resources