

Explaining the recent decrease in US infant mortality rate, 2007-2013
- PMID: 27687216
- PMCID: PMC5182176
- DOI: 10.1016/j.ajog.2016.09.097
Explaining the recent decrease in US infant mortality rate, 2007-2013
Abstract
Background: The US infant mortality rate has been steadily decreasing in recent years as has the preterm birth rate; preterm birth is a major factor associated with death during the first year of life. The degree to which changes in gestational age-specific mortality and changes in the distribution of births by gestational age have contributed to the decrease in the infant mortality rate requires clarification.
Objective: The objective of the study was to better understand the major contributors to the 2007-2013 infant mortality decline for the total population and for infants born to non-Hispanic black, non-Hispanic white, and Hispanic women.
Study design: We identified births and infant deaths from 2007 and 2013 Centers for Disease Control and Prevention National Vital Statistics System's period linked birth and infant death files. We included all deaths and births for which there was a reported gestational age at birth on the birth certificate of 22 weeks or greater. The decrease in the infant mortality rate was disaggregated such that all of the change could be attributed to improvements in gestational age-specific infant mortality rates and changes in the distribution of gestational age, by week of gestation, using the Kitagawa method. Sensitivity analyses were performed to account for records in which the obstetric estimate of gestational age was missing and for deaths and births less than 22 weeks' gestation. Maternal race and ethnicity information was obtained from the birth certificate.
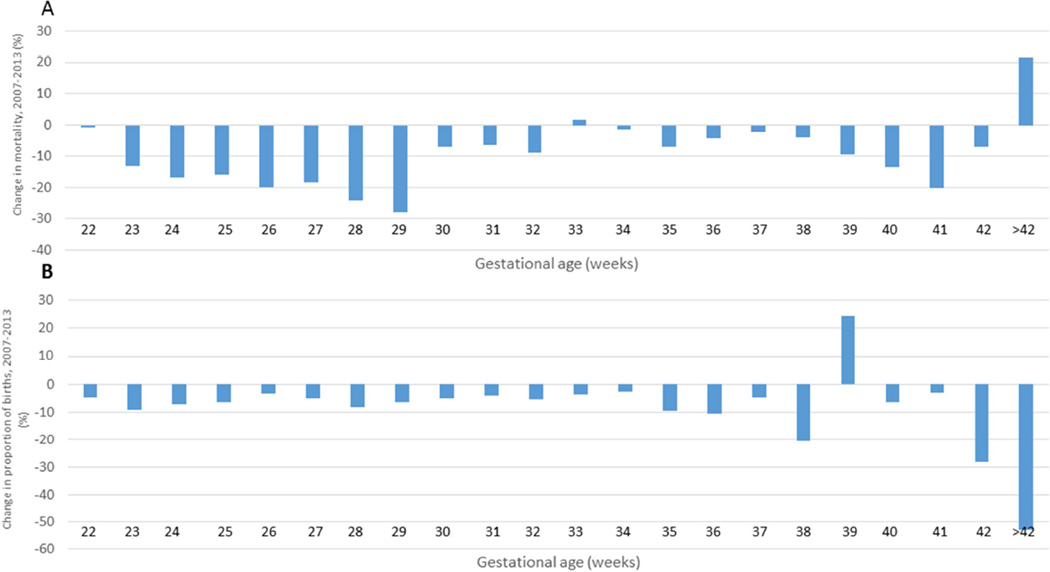
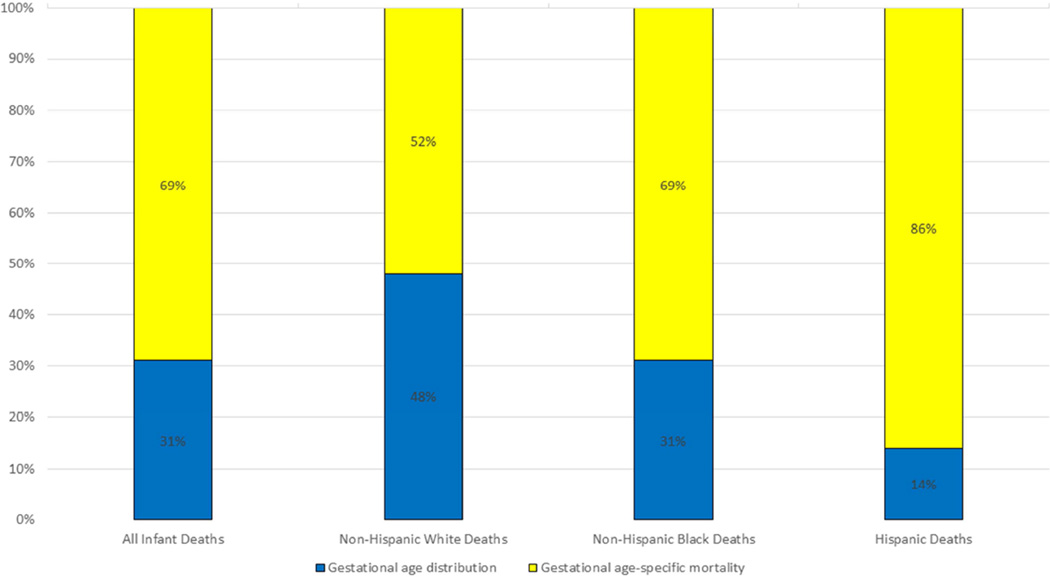
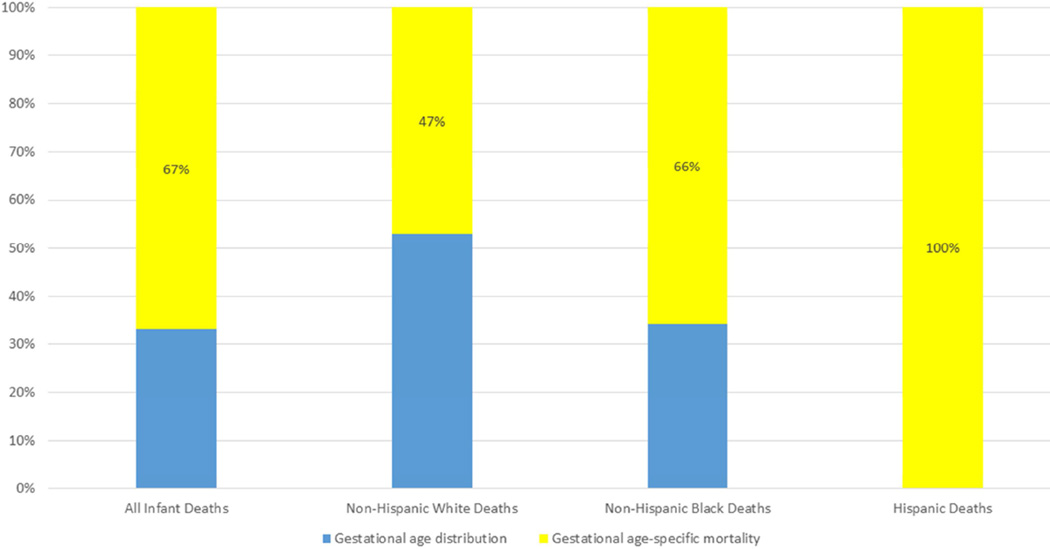
Results: The infant mortality rates after exclusions were 5.72 and 4.92 per 1000 live births for 2007 and 2013, respectively, with an absolute difference of -0.80 (14% decrease). Infant mortality rates declined by 11% for non-Hispanic whites, by 19% for non-Hispanic blacks, and by 14% for Hispanics during the period. Compared with 2007, the proportion of births in each gestational age category was lower in 2013 with the exception of 39 weeks during which there was an increase in the proportion of births from 30.1% in 2007 to 37.5% in 2013. Gestational age-specific mortality decreased for each gestational age category between 2007 and 2013 except 33 weeks and >42 weeks. About 31% of the decrease in the US infant mortality rate from 2007 through 2013 was due to changes in the gestational age distribution, and 69% was due to improvements in gestational age-specific survival. Improvements in the gestational age distribution from 2007 through 2013 benefited infants of non-Hispanic white women (48%) the most, followed by infants of non-Hispanic black (31%) and Hispanic (14%) women.
Conclusion: Infant mortality improved between 2007 and 2013 as a result of both improvements in the distribution of gestational age at birth and improvements in survival after birth. The differential contribution of improvements in the gestational age distribution at birth by race and ethnicity suggests that preconception and antenatal health and health care aimed at preventing or delaying preterm birth may not be reaching all populations.
Keywords: Kitagawa analysis; infant mortality; preterm birth.
Published by Elsevier Inc.
Conflict of interest statement
The authors report no conflicts of interest.
Figures
References
-
- Mathews TJ, MacDorman MF, Thoma ME. National vital statistics reports. 9. Vol. 64. Hyattsville, MD: National Center for Health Statistics; 2015. Infant mortality statistics from the 2013 period linked birth/infant death data set. - PubMed
-
- Martin JA, Osterman MJK, Kirmeyer SE, Gregory ECW. National vital statistics reports. 5. Vol. 64. Hyattsville, MD: National Center for Health Statistics; 2015. Measuring gestational age in vital statistics data: Transitioning to the obstetric estimate. - PubMed
-
- Callaghan WM, MacDorman MF, Rasmussen SA, Qin C, Lackritz EM. The contribution of preterm birth top infant mortality in the United States. Pediatrics. 2006;118:1566–1573. - PubMed
-
- National Vital Statistics System. [Accessed July 29, 2015];Linked Birth and Infant Death Data. ( http://www.cdc.gov/nchs/linked.htm)
-
- Callaghan WM, Dietz PM. Differences in birthweight for gestational age distributions according to measures used to assign gestational age. Am J Epidemiol. 2010;171:826–836. - PubMed
MeSH terms
Grants and funding
LinkOut - more resources
Full Text Sources
Other Literature Sources
