

Changes in brain oxysterols at different stages of Alzheimer's disease: Their involvement in neuroinflammation
- PMID: 27687218
- PMCID: PMC5040635
- DOI: 10.1016/j.redox.2016.09.001
Changes in brain oxysterols at different stages of Alzheimer's disease: Their involvement in neuroinflammation
Abstract
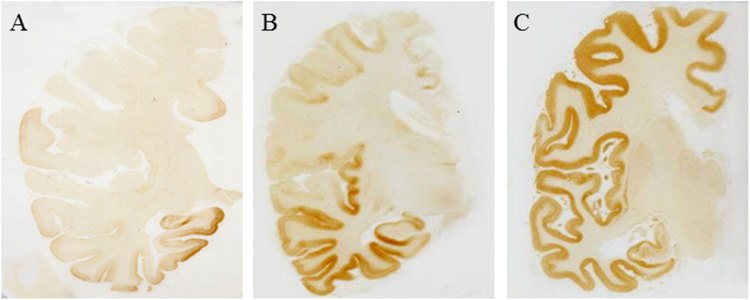
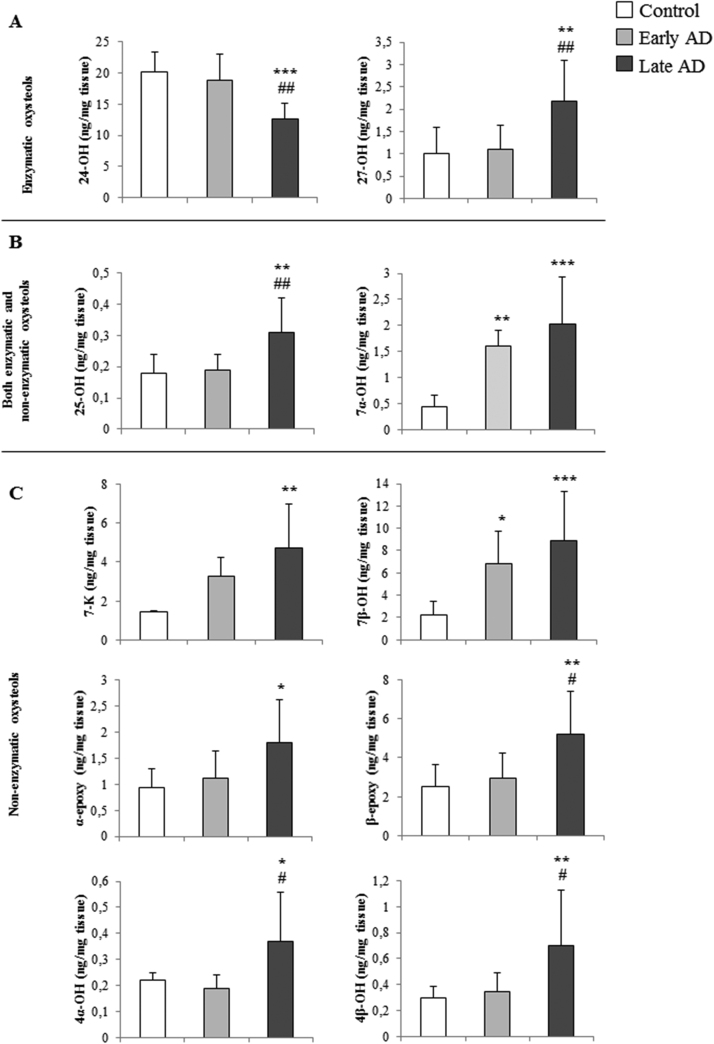
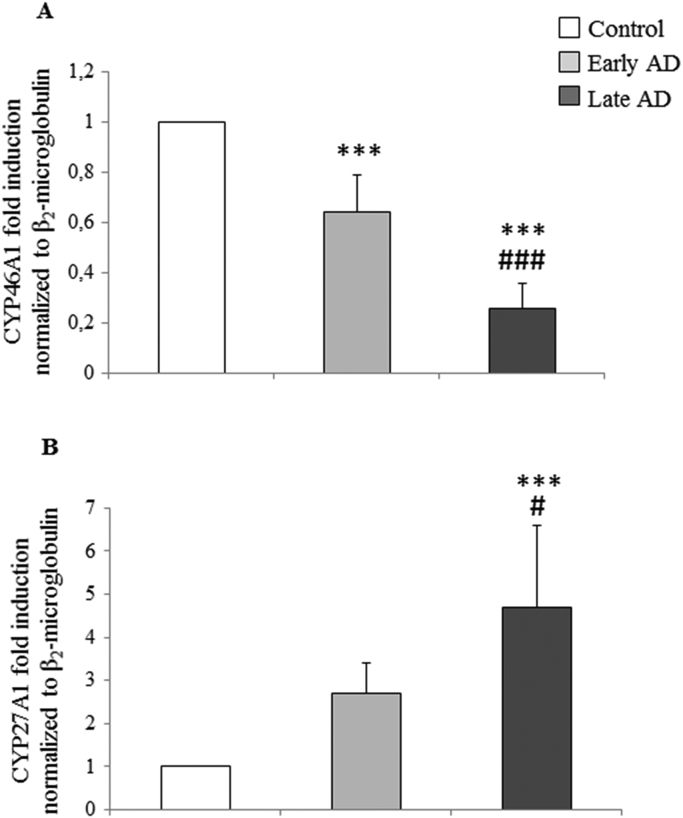
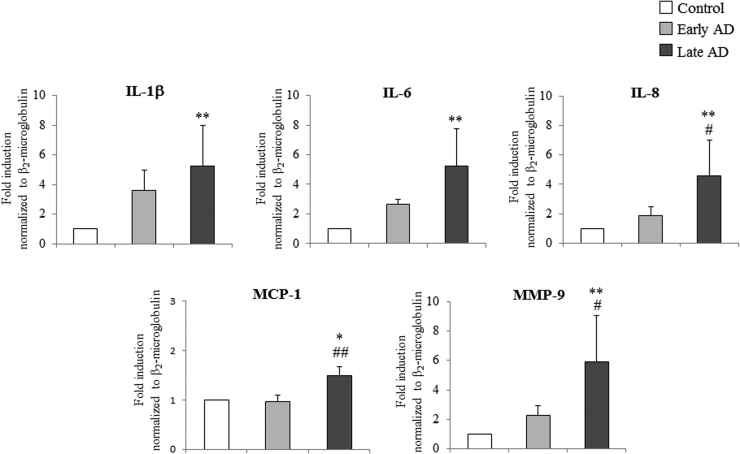
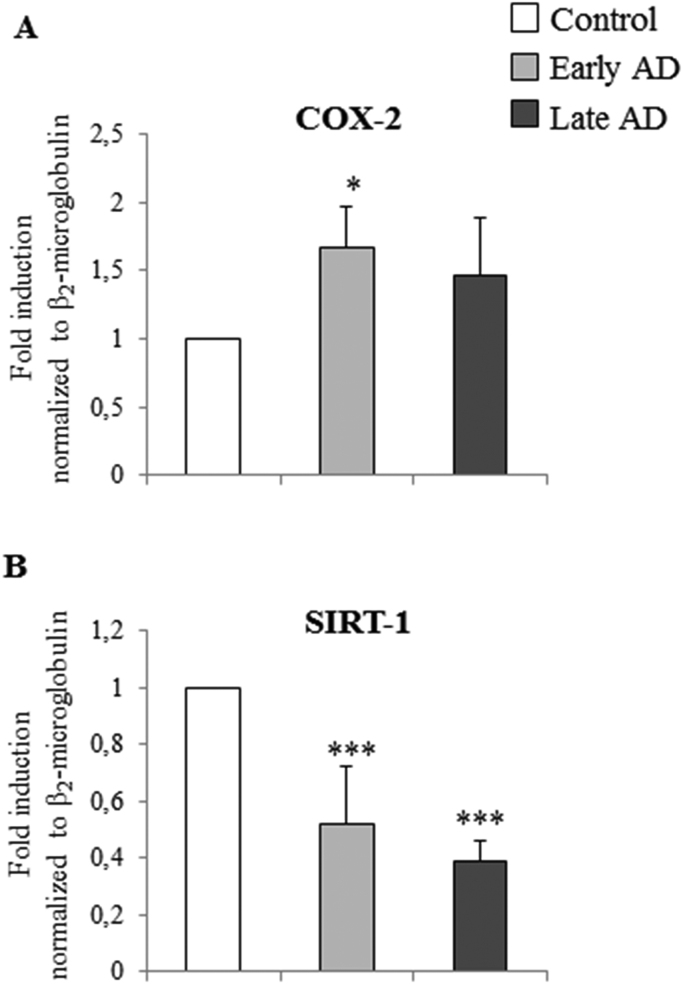
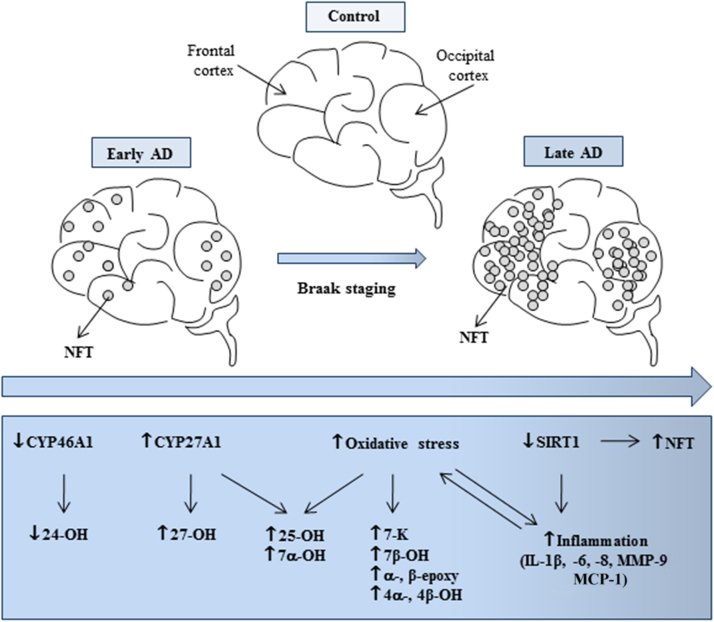
Alzheimer's disease (AD) is a gradually debilitating disease that leads to dementia. The molecular mechanisms underlying AD are still not clear, and at present no reliable biomarkers are available for the early diagnosis. In the last several years, together with oxidative stress and neuroinflammation, altered cholesterol metabolism in the brain has become increasingly implicated in AD progression. A significant body of evidence indicates that oxidized cholesterol, in the form of oxysterols, is one of the main triggers of AD. The oxysterols potentially most closely involved in the pathogenesis of AD are 24-hydroxycholesterol and 27-hydroxycholesterol, respectively deriving from cholesterol oxidation by the enzymes CYP46A1 and CYP27A1. However, the possible involvement of oxysterols resulting from cholesterol autooxidation, including 7-ketocholesterol and 7β-hydroxycholesterol, is now emerging. In a systematic analysis of oxysterols in post-mortem human AD brains, classified by the Braak staging system of neurofibrillary pathology, alongside the two oxysterols of enzymatic origin, a variety of oxysterols deriving from cholesterol autoxidation were identified; these included 7-ketocholesterol, 7α-hydroxycholesterol, 4β-hydroxycholesterol, 5α,6α-epoxycholesterol, and 5β,6β-epoxycholesterol. Their levels were quantified and compared across the disease stages. Some inflammatory mediators, and the proteolytic enzyme matrix metalloprotease-9, were also found to be enhanced in the brains, depending on disease progression. This highlights the pathogenic association between the trends of inflammatory molecules and oxysterol levels during the evolution of AD. Conversely, sirtuin 1, an enzyme that regulates several pathways involved in the anti-inflammatory response, was reduced markedly with the progression of AD, supporting the hypothesis that the loss of sirtuin 1 might play a key role in AD. Taken together, these results strongly support the association between changes in oxysterol levels and AD progression.
Keywords: Alzheimer's disease; Cholesterol metabolism; Inflammation; Oxysterols; Sirtuin-1.
Copyright © 2016 The Authors. Published by Elsevier B.V. All rights reserved.
Figures
References
-
- Querfurth H.W., LaFerla F.M. Alzheimer’s disease. N. Engl. J. Med. 2010;362:329–344. - PubMed
-
- Gotz J., Chen F., van Dorpe J., Nitsch R.M. Formation of neurofibrillary tangles in P301l tau transgenic mice induced by Abeta 42 fibrils. Science. 2001;293:1491–1495. - PubMed
-
- Lewis J., Dickson D.W., Lin W.L., Chisholm L., Corral A., Jones G., Yen S.H., Sahara N., Skipper L., Yager D., Eckman C., Hardy J., Hutton M., McGowan E. Enhanced neurofibrillary degeneration in transgenic mice expressing mutant tau and APP. Science. 2001;293:1487–1491. - PubMed
-
- Braak H., Thal D.R., Ghebremedhin E., Del Tredici K. Stages of the pathologic process in Alzheimer disease: age categories from 1 to 100 years. J. Neuropathol. Exp. Neurol. 2011;70:960–969. - PubMed
-
- Braak H., Del Tredici K. Alzheimer's pathogenesis: is there neuron-to-neuron propagation? Acta Neuropathol. 2011;121:589–595. - PubMed
MeSH terms
Substances
LinkOut - more resources
Full Text Sources
Other Literature Sources
Medical
Miscellaneous
