. 2016 Sep 30:7:12800.
doi: 10.1038/ncomms12800.

CO2 fixation by anaerobic non-photosynthetic mixotrophy for improved carbon conversion

Affiliations

CO2 fixation by anaerobic non-photosynthetic mixotrophy for improved carbon conversion

Shawn W Jones et al. Nat Commun. .

Abstract

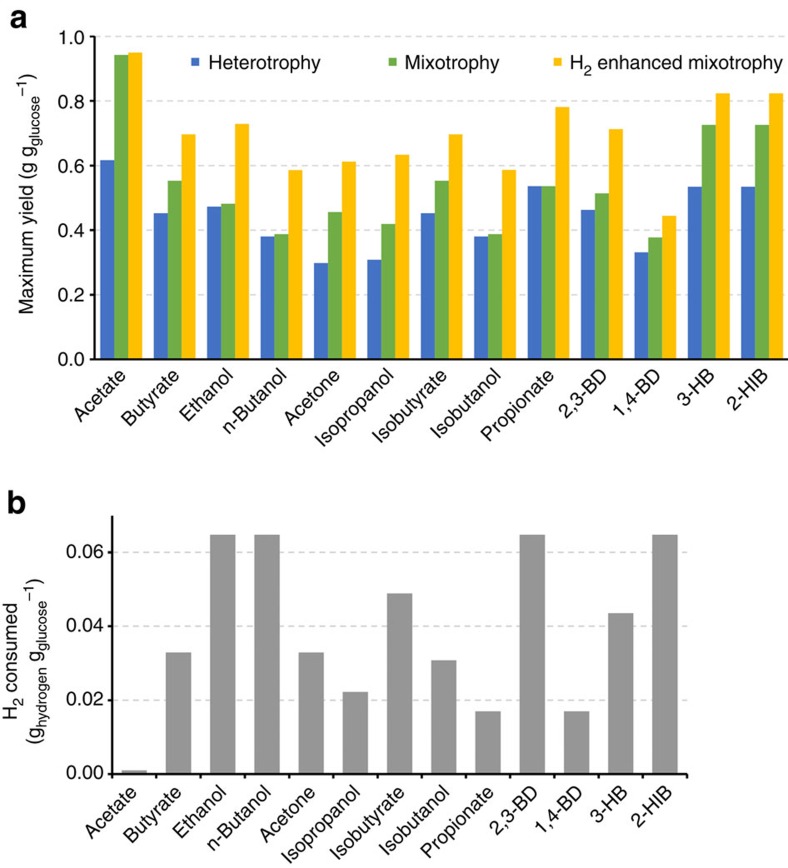
Maximizing the conversion of biogenic carbon feedstocks into chemicals and fuels is essential for fermentation processes as feedstock costs and processing is commonly the greatest operating expense. Unfortunately, for most fermentations, over one-third of sugar carbon is lost to CO2 due to the decarboxylation of pyruvate to acetyl-CoA and limitations in the reducing power of the bio-feedstock. Here we show that anaerobic, non-photosynthetic mixotrophy, defined as the concurrent utilization of organic (for example, sugars) and inorganic (for example, CO2) substrates in a single organism, can overcome these constraints to increase product yields and reduce overall CO2 emissions. As a proof-of-concept, Clostridium ljungdahlii was engineered to produce acetone and achieved a mass yield 138% of the previous theoretical maximum using a high cell density continuous fermentation process. In addition, when enough reductant (that is, H2) is provided, the fermentation emits no CO2. Finally, we show that mixotrophy is a general trait among acetogens.


Conflict of interest statement

White Dog Labs is commercializing a mixotrophy-based fermentation process and has filed a patent application PCT:US2016:019760.

Figures

Figure 1
Figure 1. The concept of mixotrophy and its demonstration.
(a,b) Different modes of fermentation are shown as an abbreviated metabolic network (a) and block flow diagrams (b). Heterotrophy (case I): hexose is consumed and CO2 and potentially H2 are produced. Mixotrophy (case II): hexose is consumed and excess reducing equivalents are used to fix endogenously produced CO2; any unconsumed CO2 is released from the process. H2-enhanced mixotrophy (case III): hexose along with H2 are fed to the microorganism and no CO2 is released. Syngas-enhanced mixotrophy (case IV): hexose and CO:CO2:H2 are fed to the microorganism. Depending on the composition of the syngas and the metabolite of interest, CO2 may still be released from the process. Dashed lines indicate potential pathways or products. (c,d) 13C-labelling fermentation profiles of CLJ (c) and CAU (d) during syngas-enhanced mixotrophy. Fructose (black line) consumed and metabolites produced during fermentation in the presence of a syngas mixture (13CO, 13CO2, H2 and N2). The percentage of acetate labelled with 13C is shown in light blue for each time point. The s.d. of two biological replicates is shown in black error bars.
Figure 2
Figure 2. Metabolic engineering of CLJ to demonstrate mixotrophic production of acetone.
(a) Metabolic pathways downstream of pyruvate for the native and engineered CLJ. Native metabolites and enzymes are shown in black, and heterologous enzymes along with non-native metabolites are shown in blue. Integration with the WLP is shown through light blue arrows. The gene deletion is shown in red. PFOR, pyruvate:ferredoxin oxidoreductase; ALS, acetolactate synthase; ALDC, acetolactate decarboxylase; 23BDH, 2,3-butanediol dehydrogenase; SADH, secondary alcohol dehydrogenase; AK, acetate kinase; PTA, phosphotransacetylase; AAD, alcohol:aldehyde dehydrogenase; THL, thiolase; CoAT, CoA-transferase; AADC, acetoacetate decarboxylase. (b,c) Product profiles of CLJ ΔSADH (pTCtA) under mixotrophy and H2-enhanced mixotrophy. Total molar yields (b) and product distributions (c) are shown. The s.d. of three biological replicates is shown in black error bars.
Figure 3
Figure 3. High cell density continuous acetone fermentation.
Fermentation performance for 150 h of cell retention fermentation. At hour 96, a harvest was initiated to maintain a constant cell density. Titers and cell densities (a) are shown in addition to volumetric productivities and the total acetone pathway (acetone, 3-HB, and isopropanol) product yield (b). (a) Acetone pathway titers (blue diamond), acetate titers (orange triangle) and cell densities (grey circle with broken line). (b) Fructose volumetric consumption (black squares), acetone pathway volumetric productivity (blue diamonds), acetate volumetric productivity (orange triangles) and acetone pathway mass yield (%g g−1) from consumed fructose (red circle with broken line). Individual product and fructose titers are shown in Supplementary Fig. 2.
Figure 4
Figure 4. Mixotrophy is a general trait of acetogens.
(a) Carbon molar yields (CM CS−1; Cmetabolites Csubstrate−1), defined as the carbon moles produced divided by sugar carbon moles consumed, of C. acetobutylicum (CAC), C. ljungdahlii (CLJ), C. autoethanogenum (CAU), M. thermoacetica (MTA) and E. limosum (ELM) grown under different conditions. Cultures were grown on fructose with either a N2 headspace (heterotrophy and mixotrophy) or a syngas headspace (syngas-enhanced mixotrophy). The red dashed line indicates a yield of 67%. (b,c) Product profiles of CLJ, CAU, MTA and ELM under mixotrophy (b) or syngas-enhanced mixotrophy (c) are shown. Yields of CO2 in b are calculated based on total carbon consumed for each strain. The s.d. of three biological replicates is shown in black error bars.
Figure 5
Figure 5. Theoretical yields for various metabolites to demonstrate the potential of mixotrophy.
(a) Calculated maximum biological mass yields for several metabolites of interest under heterotrophic, mixotrophic and H2-enhanced mixotrophic conditions (where only enough H2 is supplemented to consume all CO2 evolved). Amounts of H2 required to achieve these yields are shown in b. 2,3-BD, 2,3-butanediol; 1,4-BD, 1,4-butanediol; 3-HB, 3-hydroxybutyrate; 2-HIB, 2-hydroxyisobutyrate.

References

    1. Papoutsakis E. T. Reassessing the progress in the production of advanced biofuels in the current competitive environment and beyond: what are the successes and where progress eludes us and why. Ind. Eng. Chem. Res. 54, 10170–10182 (2015).
    1. Atsumi S., Hanai T. & Liao J. C. Non-fermentative pathways for synthesis of branched-chain higher alcohols as biofuels. Nature 451, 86–89 (2008). - PubMed
    1. Bogorad I. W., Lin T.-S. & Liao J. C. Synthetic non-oxidative glycolysis enables complete carbon conservation. Nature 502, 693–697 (2013). - PubMed
    1. Fast A. G., Schmidt E. D., Jones S. W. & Tracy B. P. Acetogenic mixotrophy: novel options for yield improvement in biofuels and biochemicals production. Curr. Opin. Biotechnol. 33, 60–72 (2015). - PubMed
    1. Fast A. G. & Papoutsakis E. T. Stoichiometric and energetic analyses of non-photosynthetic CO2-fixation pathways to support synthetic biology strategies for production of fuels and chemicals. Curr. Opin. Chem. Eng. 1, 380–395 (2012).