Characterizing the intersection of Co-occurring risk factors for illicit drug abuse and dependence in a U.S. nationally representative sample
- PMID: 27687534
- PMCID: PMC5138160
- DOI: 10.1016/j.ypmed.2016.09.030
Characterizing the intersection of Co-occurring risk factors for illicit drug abuse and dependence in a U.S. nationally representative sample
Abstract
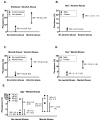
Few studies have attempted to characterize how co-occurring risk factors for substance use disorders intersect. A recent study examined this question regarding cigarette smoking and demonstrated that co-occurring risk factors generally act independently. The present study examines whether that same pattern of independent intersection of risk factors extends to illicit drug abuse/dependence using a U.S. nationally representative sample (National Survey on Drug Use and Health, 2011-2013). Logistic regression and classification and regression tree (CART) modeling were used to examine risk of past-year drug abuse/dependence associated with a well-established set of risk factors for substance use (age, gender, race/ethnicity, education, poverty, smoking status, alcohol abuse/dependence, mental illness). Each of these risk factors was associated with significant increases in the odds of drug abuse/dependence in univariate logistic regressions. Each remained significant in a multivariate model examining all eight risk factors simultaneously. CART modeling of these 8 risk factors identified subpopulation risk profiles wherein drug abuse/dependence prevalence varied from <1% to >80% corresponding to differing combinations of risk factors present. Alcohol abuse/dependence and cigarette smoking had the strongest associations with drug abuse/dependence risk. These results demonstrate that co-occurring risk factors for illicit drug/abuse dependence generally intersect in the same independent manner as risk factors for cigarette smoking, underscoring further fundamental commonalities across these different types of substance use disorders. These results also underscore the fundamental importance of differences in the presence of co-occurring risk factors when considering the often strikingly different prevalence rates of illicit drug abuse/dependence in U.S. population subgroups.
Keywords: Adults; Classification and regression tree (CART); Co-occurring risk factors; Illicit drug abuse and dependence; Multiple logistic regression; Risk factors; Substance use disorders; U.S. nationally representative sample.
Copyright © 2016 Elsevier Inc. All rights reserved.
Conflict of interest statement
Declaration of Interests: None to declare.
Figures


References
-
- Breiman L, Friedman JH, Olshen RA, Stone CJ. Classification and regression trees. Belmont, California: Wadsworth; 1984.
-
- Center for Behavioral Health Statistics and Quality. 2013 National Survey on Drug Use and Health Public Use File Codebook. Rockville, MD: Substance Abuse and Mental Health Services Administration; 2014. [Accessed June 16, 2015]. http://www.icpsr.umich.edu/cgibin/file?comp=none&study=35509&ds=1&file_i....
-
- Compton WM, Thomas YF, Stinson FS, Grant BF. Prevalence, correlates, disability, and comorbidity of DSM-IV drug abuse and dependence in the USA: Results from the National Epidemiologic Survey on Alcohol and Related Conditions. Arch Gen Psychiatry. 2007;64:566–576. doi: 10.1001/archpsyc.64.5.566. - DOI - PubMed
MeSH terms
Substances
Grants and funding
LinkOut - more resources
Full Text Sources
Other Literature Sources
Medical
Miscellaneous

