

Fitness consequences of polymorphic inversions in the zebra finch genome
- PMID: 27687629
- PMCID: PMC5043542
- DOI: 10.1186/s13059-016-1056-3
Fitness consequences of polymorphic inversions in the zebra finch genome
Abstract
Background: Inversion polymorphisms constitute an evolutionary puzzle: they should increase embryo mortality in heterokaryotypic individuals but still they are widespread in some taxa. Some insect species have evolved mechanisms to reduce the cost of embryo mortality but humans have not. In birds, a detailed analysis is missing although intraspecific inversion polymorphisms are regarded as common. In Australian zebra finches (Taeniopygia guttata), two polymorphic inversions are known cytogenetically and we set out to detect these two and potentially additional inversions using genomic tools and study their effects on embryo mortality and other fitness-related and morphological traits.
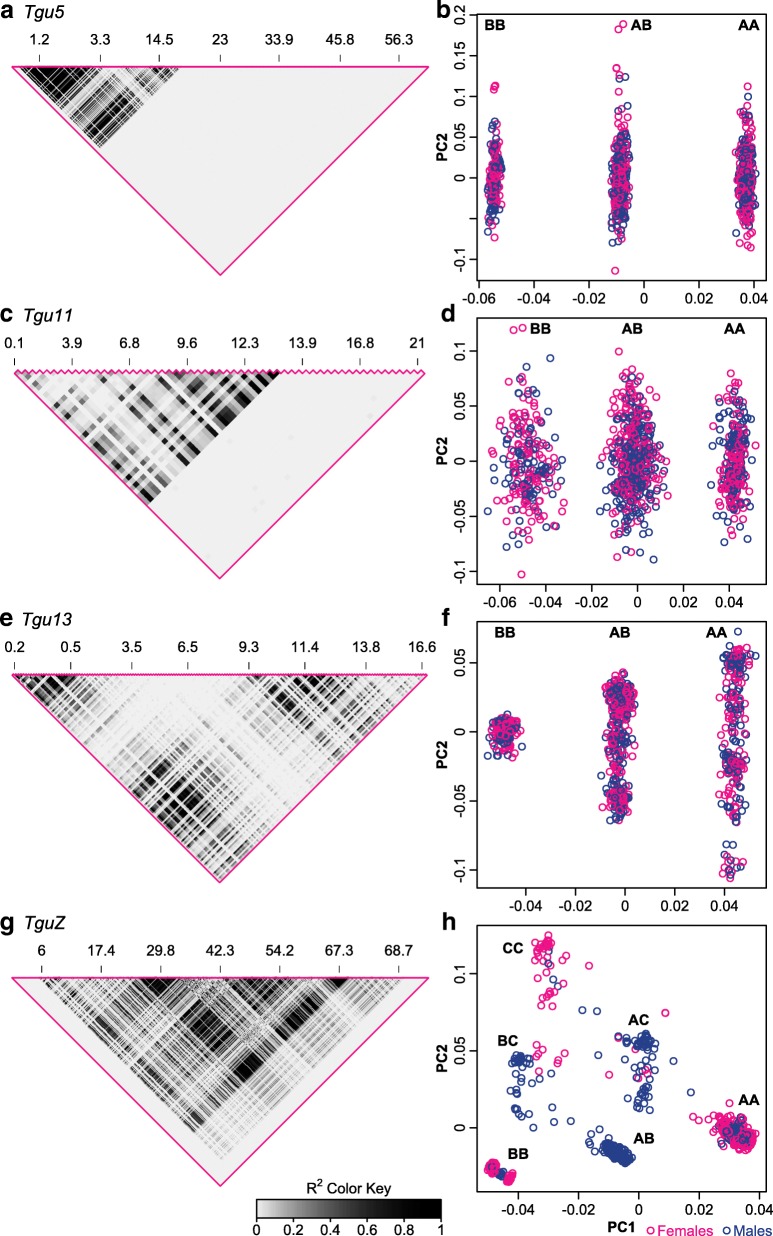
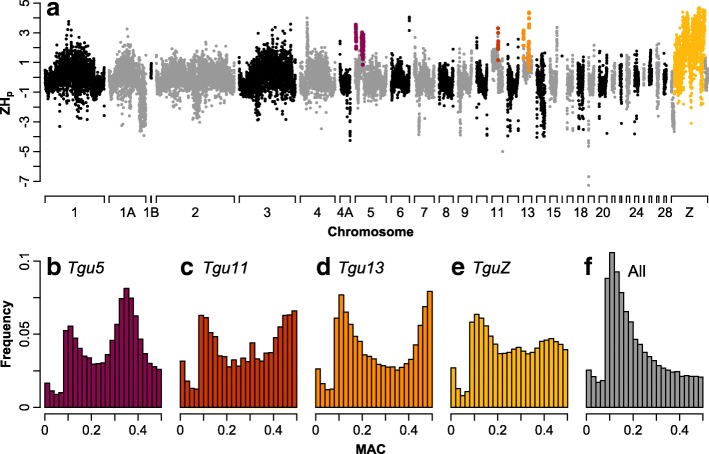
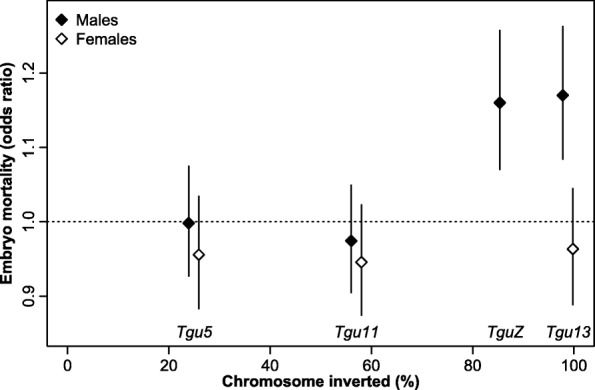
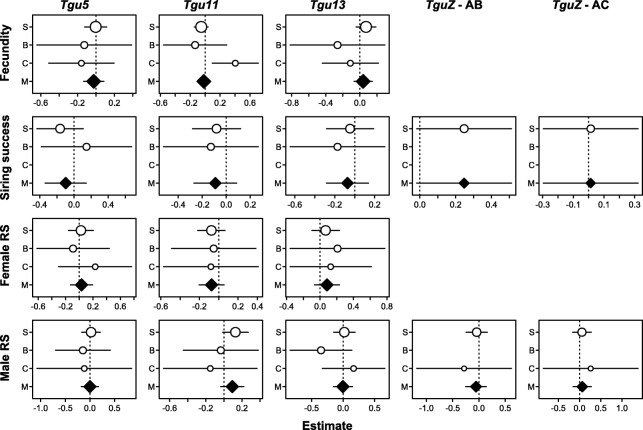
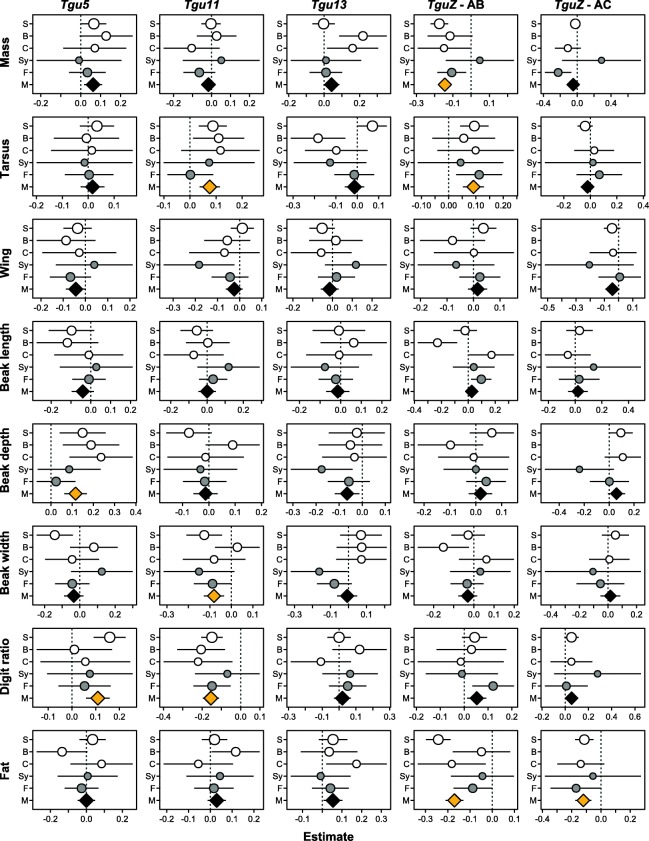
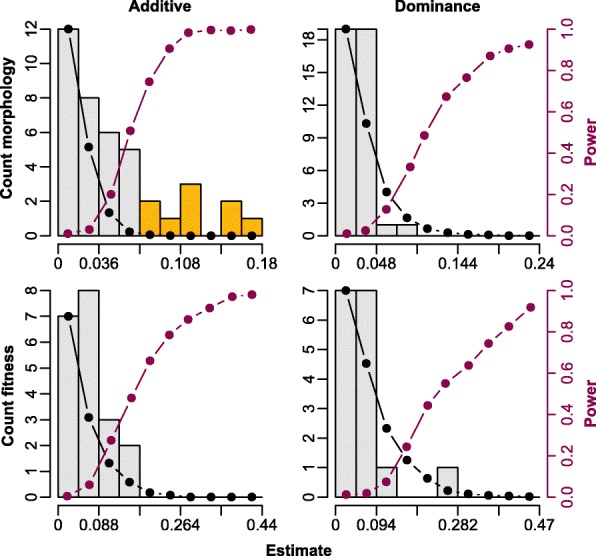
Results: Using whole-genome SNP data, we screened 948 wild zebra finches for polymorphic inversions and describe four large (12-63 Mb) intraspecific inversion polymorphisms with allele frequencies close to 50 %. Using additional data from 5229 birds and 9764 eggs from wild and three captive zebra finch populations, we show that only the largest inversions increase embryo mortality in heterokaryotypic males, with surprisingly small effect sizes. We test for a heterozygote advantage on other fitness components but find no evidence for heterosis for any of the inversions. Yet, we find strong additive effects on several morphological traits.
Conclusions: The mechanism that has carried the derived inversion haplotypes to such high allele frequencies remains elusive. It appears that selection has effectively minimized the costs associated with inversions in zebra finches. The highly skewed distribution of recombination events towards the chromosome ends in zebra finches and other estrildid species may function to minimize crossovers in the inverted regions.
Keywords: Embryo mortality; Heterosis; Inversion polymorphism; Miscarriage; Overdominance; Structural variant.
Figures
Similar articles
-
Weak antagonistic fitness effects can maintain an inversion polymorphism.Mol Ecol. 2023 Jul;32(13):3575-3585. doi: 10.1111/mec.16963. Epub 2023 Apr 28. Mol Ecol. 2023. PMID: 37118648
-
The recombination landscape of the zebra finch Taeniopygia guttata genome.Genome Res. 2010 Apr;20(4):485-95. doi: 10.1101/gr.101410.109. Epub 2010 Mar 31. Genome Res. 2010. PMID: 20357052 Free PMC article.
-
A sex-linked supergene with large effects on sperm traits has little impact on reproductive traits in female zebra finches.Proc Biol Sci. 2024 Mar 27;291(2019):20232796. doi: 10.1098/rspb.2023.2796. Epub 2024 Mar 27. Proc Biol Sci. 2024. PMID: 38531403 Free PMC article.
-
Neuroendocrine regulation of long-term pair maintenance in the monogamous zebra finch.Horm Behav. 2015 Nov;76:11-22. doi: 10.1016/j.yhbeh.2015.04.014. Epub 2015 Apr 29. Horm Behav. 2015. PMID: 25935729 Review.
-
Population genetics of inversion polymorphism in Drosophila ananassae.Indian J Exp Biol. 1998 Aug;36(8):739-48. Indian J Exp Biol. 1998. PMID: 9838874 Review.
Cited by
-
Footprints of adaptive evolution revealed by whole Z chromosomes haplotypes in flycatchers.Mol Ecol. 2019 May;28(9):2290-2304. doi: 10.1111/mec.15021. Epub 2019 May 29. Mol Ecol. 2019. PMID: 30653779 Free PMC article.
-
Genome Assembly and Evolutionary Analysis of the Mandarin Duck Aix galericulata Reveal Strong Genome Conservation among Ducks.Genome Biol Evol. 2022 May 31;14(6):evac083. doi: 10.1093/gbe/evac083. Genome Biol Evol. 2022. PMID: 35640266 Free PMC article.
-
Comparative population pangenomes reveal unexpected complexity and fitness effects of structural variants.bioRxiv [Preprint]. 2025 Feb 13:2025.02.11.637762. doi: 10.1101/2025.02.11.637762. bioRxiv. 2025. PMID: 39990470 Free PMC article. Preprint.
-
Experimental test of the fitness effects of divergent marine-freshwater chromosomal inversions in stickleback under different salinity conditions.Heredity (Edinb). 2025 Jul 24. doi: 10.1038/s41437-025-00784-8. Online ahead of print. Heredity (Edinb). 2025. PMID: 40702314
-
Occasional paternal inheritance of the germline-restricted chromosome in songbirds.Proc Natl Acad Sci U S A. 2022 Jan 25;119(4):e2103960119. doi: 10.1073/pnas.2103960119. Proc Natl Acad Sci U S A. 2022. PMID: 35058355 Free PMC article.
References
-
- White MJD. Animal cytology and evolution. Cambridge: Cambridge University Press; 1977.
LinkOut - more resources
Full Text Sources
Other Literature Sources
Miscellaneous
