Observational Study
. 2016 Sep 29;14(1):284.
doi: 10.1186/s12967-016-1030-6.

Walking performance is positively correlated to calf muscle fiber size in peripheral artery disease subjects, but fibers show aberrant mitophagy: an observational study

Affiliations
Observational Study

Walking performance is positively correlated to calf muscle fiber size in peripheral artery disease subjects, but fibers show aberrant mitophagy: an observational study

Sarah H White et al. J Transl Med. .

Erratum in

Abstract

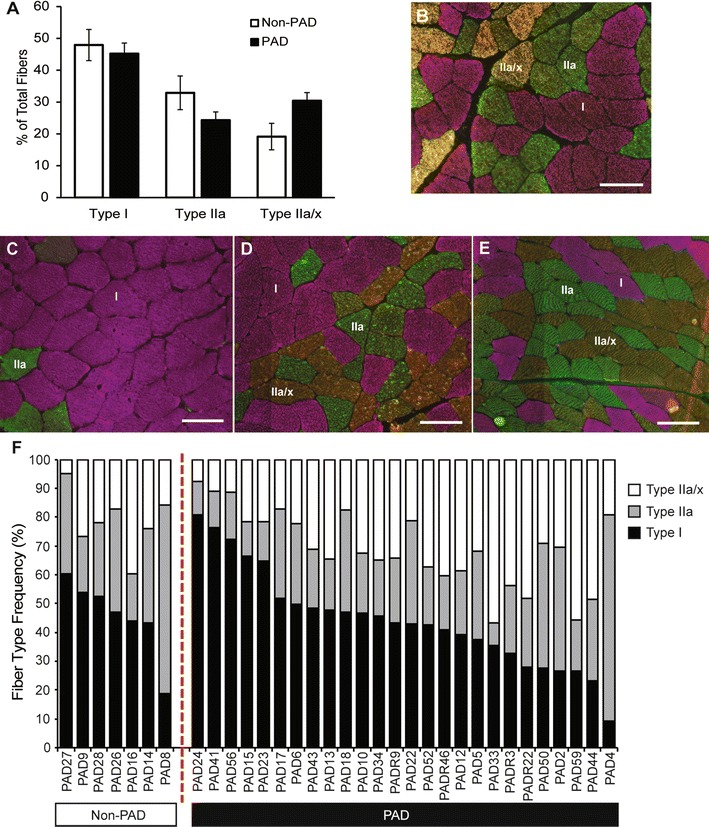
Background: Patients with lower extremity peripheral artery disease (PAD) have decreased mobility, which is not fully explained by impaired blood supply to the lower limb. Additionally, reports are conflicted regarding fiber type distribution patterns in PAD, but agree that skeletal muscle mitochondrial respiration is impaired.

Methods: To test the hypothesis that reduced muscle fiber oxidative activity and type I distribution are negatively associated with walking performance in PAD, calf muscle biopsies from non-PAD (n = 7) and PAD participants (n = 26) were analyzed immunohistochemically for fiber type and size, oxidative activity, markers of autophagy, and capillary density. Data were analyzed using analysis of covariance.

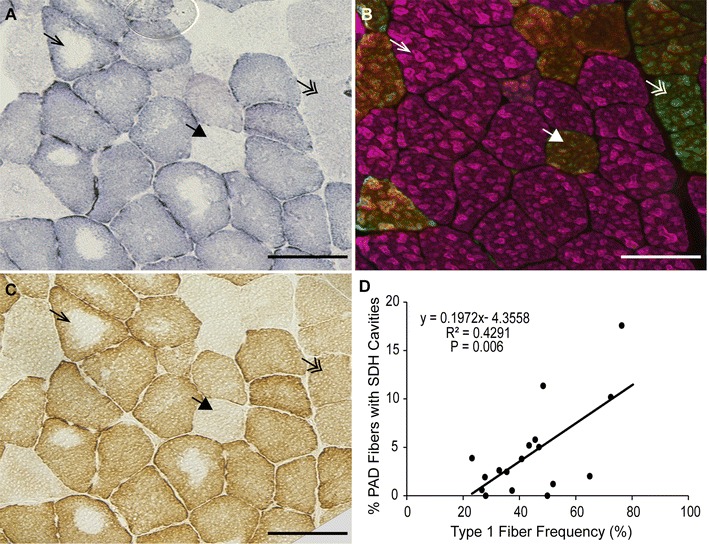
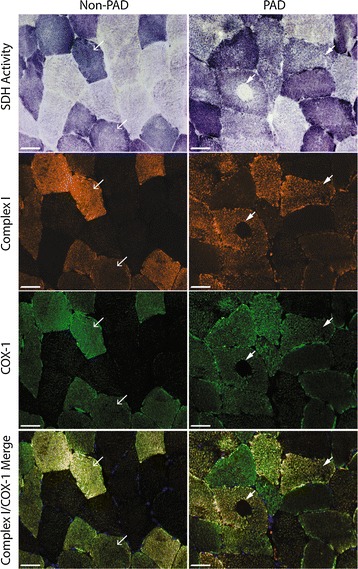
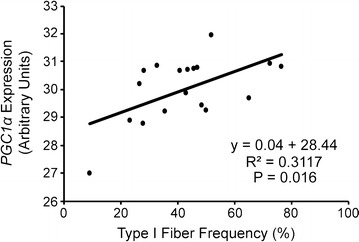
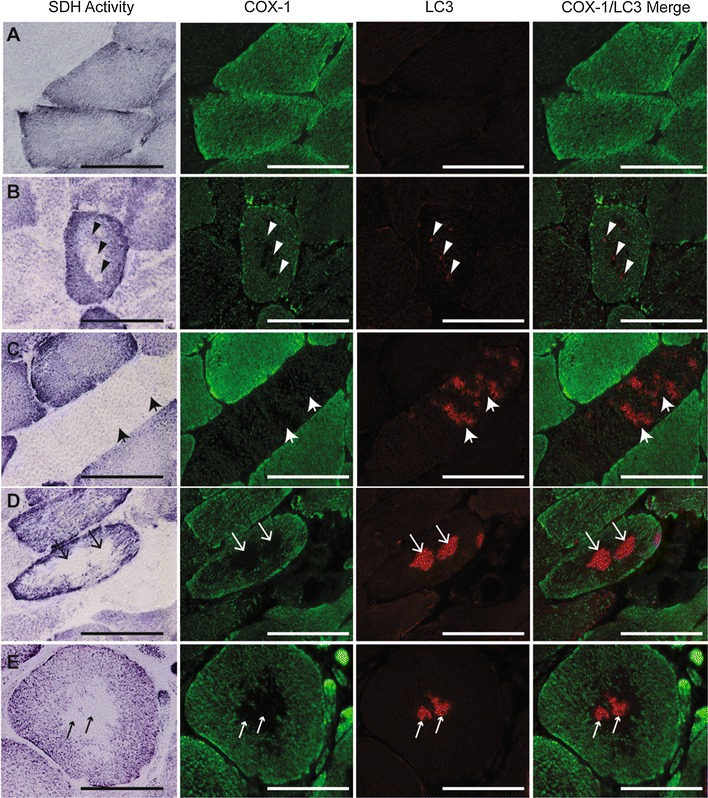
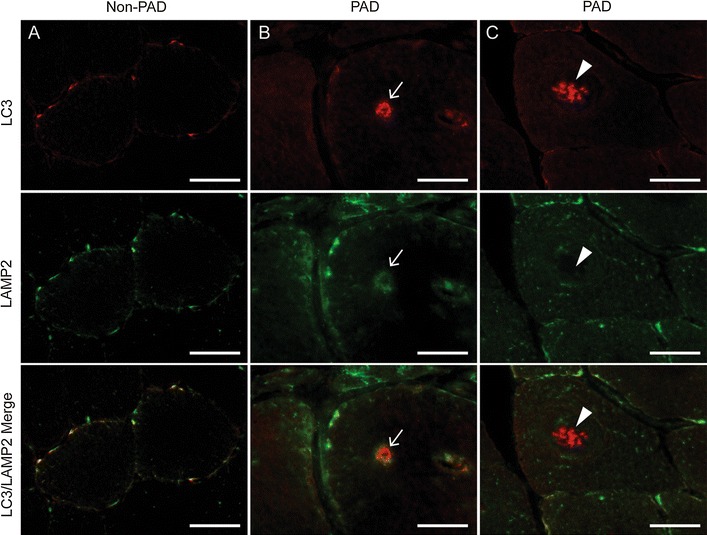
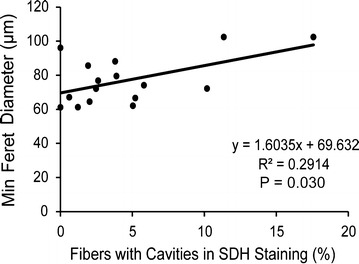
Results: There was a wide range in fiber type distribution among subjects with PAD (9-81 % type I fibers) that did not correlate with walking performance. However, mean type I fiber size correlated with 4-min normal- and fastest-paced walk velocity (r = 0.4940, P = 0.010 and r = 0.4944, P = 0.010, respectively). Although intensity of succinate dehydrogenase activity staining was consistent with fiber type, up to 17 % of oxidative fibers were devoid of mitochondria in their cores, and the core showed accumulation of the autophagic marker, LC3, which did not completely co-localize with LAMP2, a lysosome marker.

Conclusions: Calf muscle type I fiber size positively correlates with walking performance in PAD. Accumulation of LC3 and a lack of co-localization of LC3 with LAMP2 in the area depleted of mitochondria in PAD fibers suggests impaired clearance of damaged mitochondria, which may contribute to reduced muscle oxidative capacity. Further study is needed to determine whether defective mitophagy is associated with decline in function over time, and whether interventions aimed at preserving mitochondrial function and improving autophagy can improve walking performance in PAD.

Keywords: Calf muscle; Fiber type; Mitochondria; Mitophagy; Peripheral artery disease.


Figures

Fig. 1
Fig. 1
Fiber type analysis of gastrocnemius muscle sections using isoform-specific myosin heavy chain (MyHC) immunohistochemistry. A Quantification (mean ± SEM) of type I (pink), IIa (green), and IIa/x (yellow/orange) muscle fibers, shown in representative images, of non-PAD (B; n = 7) and PAD (CE; n = 26) participants. CE) Representative images of PAD subjects with primarily type I fibers, 50 % type I and 50 % Type II, and primarily type II fibers, respectively; F individual variation in fiber type distribution between non-PAD and PAD subjects (approximately 1000 fibers analyzed per subject). Scale bar = 100 µm
Fig. 2
Fig. 2
Representative images of serial PAD gastrocnemius muscle sections stained for mitochondrial activity and fiber type. A succinate dehydrogenase (SDH) activity; B myosin heavy chain (MyHC) composition by immunohistochemistry; C cytochrome c oxidase activity. Arrows point to the same fiber in serial sections. Arrow, type I fiber (pink); double arrow, type IIa fiber (green); large arrowhead, type IIa/x hybrid fiber (yellow/orange). D Correlation between the percent of total fibers with SDH cavities and type I fiber frequency in PAD subjects (n = 18, approximately 1000 fibers counted per subject). Scale bar = 100 µm
Fig. 3
Fig. 3
Representative images of non-PAD and PAD gastrocnemius muscle sections stained for mitochondrial activity and mitochondrial electron transport proteins. Top row shows succinate dehydrogenase (SDH) activity (dark fibers are type I, intermediate fibers are type IIa, and light fibers are type IIa/x), second row shows mitochondrial complex I, subunit 20 (orange), third row shows mitochondrial complex IV, subunit I (COX-1; green) staining and bottom row shows complex I and COX-1 merged. Arrows within the same column point to same fibers. Scale bar = 50 µm
Fig. 4
Fig. 4
Correlation between mRNA levels of PGC1α and type I fiber frequency in PAD gastrocnemius muscle samples (n = 18, approximately 1000 fibers counted per subject to quantify type I fiber frequency)
Fig. 5
Fig. 5
Representative images of the variation of LC3 staining associated with cavities in SDH activity and mitochondrial COX-1 staining in PAD gastrocnemius muscle sections. First column shows succinate dehydrogenase (SDH) activity (dark fibers are type I, intermediate fibers are type IIa, and light fibers are type IIa/x), second column shows mitochondrial COX-1 protein (green), third column shows LC3 (red) and fourth column shows COX-1 and LC3 merged. Examples of normal fibers with no LC3 staining or COX-1 cavities (row A), punctate LC3 staining where a COX-1 cavitiy is forming (row B), elevated LC3 staining with low COX-1 staining (row C), LC3 accumulation in areas lacking COX-1 staining (row D), and LC3 plaque in the center of an SDH/COX1 cavity (COX-1; row E). Arrows within the same row point to areas of LC3 accumulation in same fiber. Scale bar = 100 µM
Fig. 6
Fig. 6
Representative images of gastrocnemius muscle sections from non-PAD and PAD subjects stained for LC3, an autophagosome marker (red) and LAMP2, a lysosome marker (green). A In non-PAD, very little LC3 and LAMP2 staining is apparent. In PAD, rare fibers show co-localization of accumulated LC3 and LAMP2 (B), whereas the majority of fibers have elevated LC3 accumulation but no co-localization with LAMP2 (C). Arrows in the same column point to the same areas of LC3 accumulation in the center of the fiber with or without LAMP2 co-localization. Scale bar = 50μm
Fig. 7
Fig. 7
Correlation between average minimum fiber diameter and succinate dehydrogenase (SDH) cavities in PAD gastrocnemius samples. SDH cavities are quantified by the percentage of fibers with cavities in SDH activity staining

References

    1. McDermott MM, Greenland P, Liu K, Guralnik JM, Criqui MH, Dolan NC, Chan C, Celic L, Pearce WH, Schneider JR, et al. Leg symptoms in peripheral arterial disease: associated clinical characteristics and functional impairment. JAMA. 2001;286:1599–1606. doi: 10.1001/jama.286.13.1599. - DOI - PubMed
    1. McDermott MM, Greenland P, Liu K, Guralnik JM, Celic L, Criqui MH, Chan C, Martin GJ, Schneider J, Pearce WH, et al. The ankle brachial index is associated with leg function and physical activity: the walking and leg circulation study. Ann Intern Med. 2002;136:873–883. doi: 10.7326/0003-4819-136-12-200206180-00008. - DOI - PubMed
    1. McDermott MM, Liu K, Greenland P, Guralnik JM, Criqui MH, Chan C, Pearce WH, Schneider JR, Ferrucci L, Celic L, et al. Functional decline in peripheral arterial disease: associations with the ankle brachial index and leg symptoms. JAMA. 2004;292:453–461. doi: 10.1001/jama.292.4.453. - DOI - PubMed
    1. McDermott MM, Guralnik JM, Tian L, Liu K, Ferrucci L, Liao Y, Sharma L, Criqui MH. Associations of borderline and low normal ankle-brachial index values with functional decline at 5-year follow-up: the WALCS (walking and leg circulation study) J Am Coll Cardiol. 2009;53:1056–1062. doi: 10.1016/j.jacc.2008.09.063. - DOI - PMC - PubMed
    1. McDermott MM, Guralnik JM, Tian L, Ferrucci L, Liu K, Liao Y, Criqui MH. Baseline functional performance predicts the rate of mobility loss in persons with peripheral arterial disease. J Am Coll Cardiol. 2007;50:974–982. doi: 10.1016/j.jacc.2007.05.030. - DOI - PMC - PubMed

Publication types