. 2016 Sep 30:6:34421.
doi: 10.1038/srep34421.

Auditory cortical field coding long-lasting tonal offsets in mice

Affiliations

Auditory cortical field coding long-lasting tonal offsets in mice

Hironori Baba et al. Sci Rep. .

Abstract

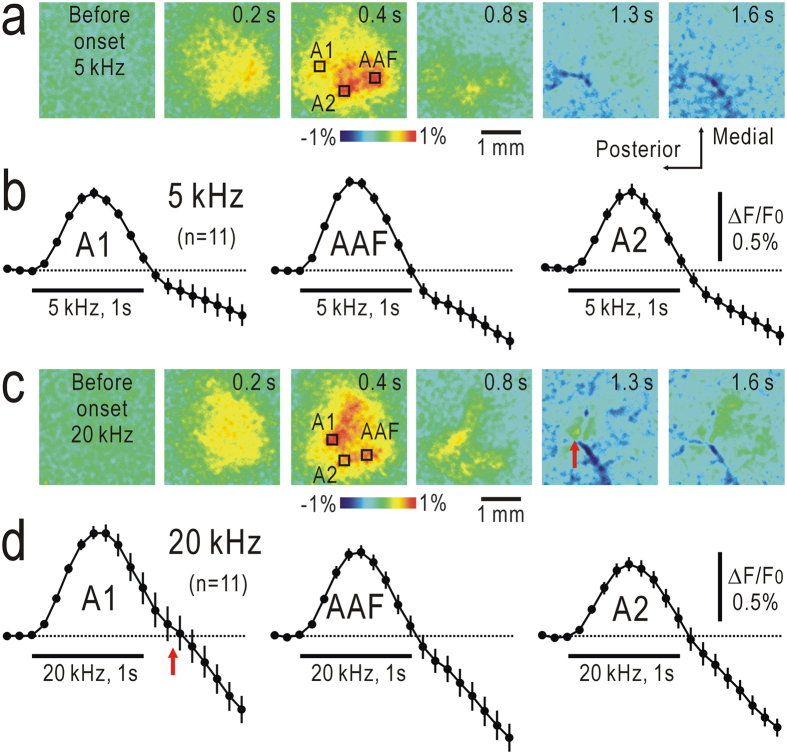
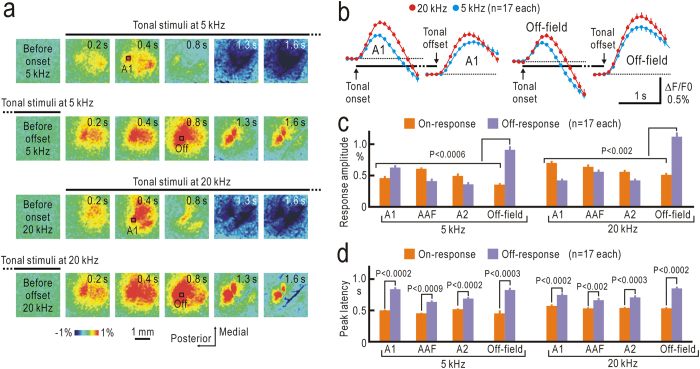
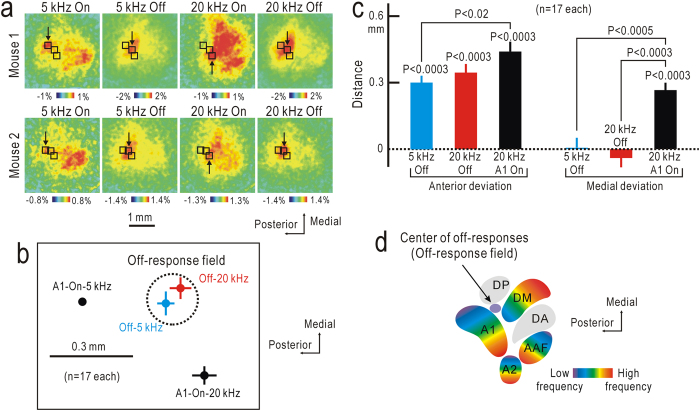
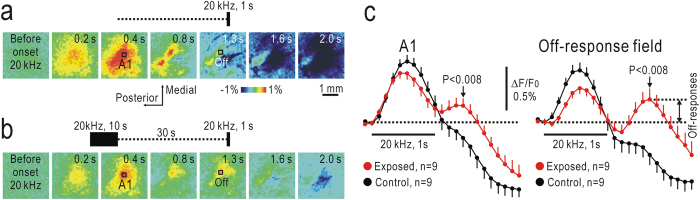
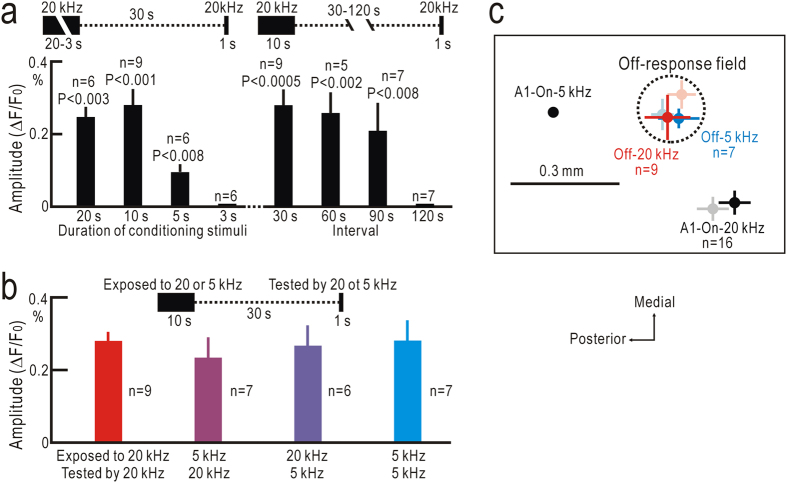
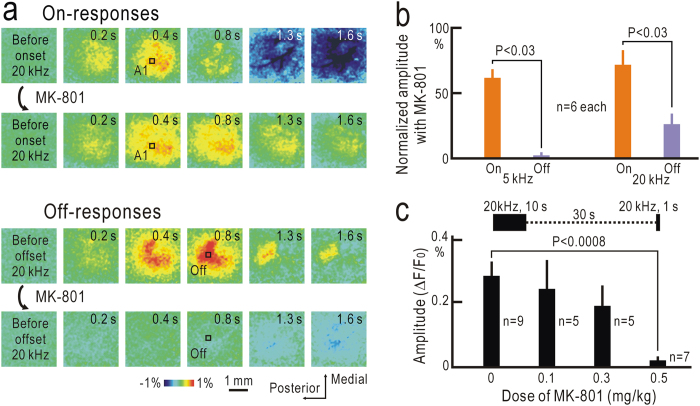
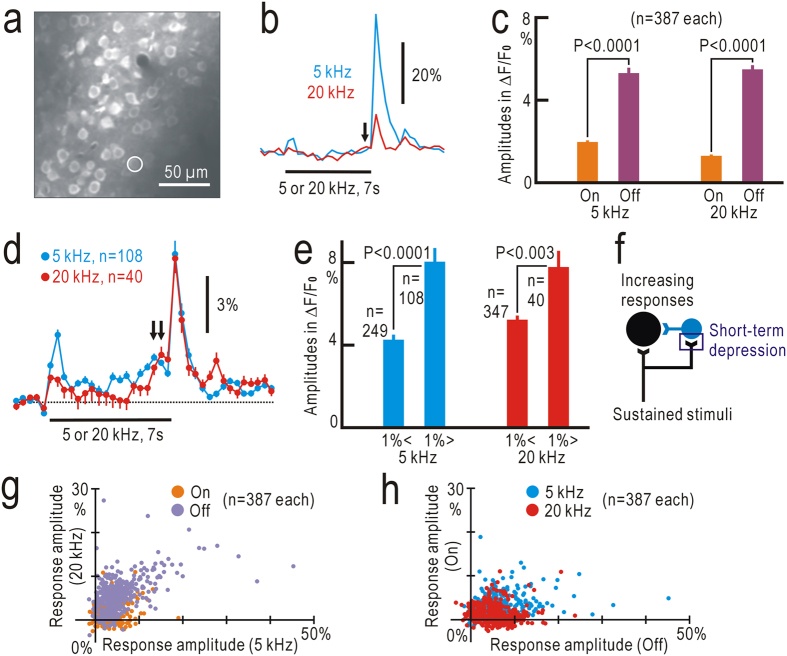
Although temporal information processing is important in auditory perception, the mechanisms for coding tonal offsets are unknown. We investigated cortical responses elicited at the offset of tonal stimuli using flavoprotein fluorescence imaging in mice. Off-responses were clearly observed at the offset of tonal stimuli lasting for 7 s, but not after stimuli lasting for 1 s. Off-responses to the short stimuli appeared in a similar cortical region, when conditioning tonal stimuli lasting for 5-20 s preceded the stimuli. MK-801, an inhibitor of NMDA receptors, suppressed the two types of off-responses, suggesting that disinhibition produced by NMDA receptor-dependent synaptic depression might be involved in the off-responses. The peak off-responses were localized in a small region adjacent to the primary auditory cortex, and no frequency-dependent shift of the response peaks was found. Frequency matching of preceding tonal stimuli with short test stimuli was not required for inducing off-responses to short stimuli. Two-photon calcium imaging demonstrated significantly larger neuronal off-responses to stimuli lasting for 7 s in this field, compared with off-responses to stimuli lasting for 1 s. The present results indicate the presence of an auditory cortical field responding to long-lasting tonal offsets, possibly for temporal information processing.


Figures

Figure 1
Figure 1. Flavoprotein fluorescence responses to tonal stimuli lsting for 1 s.
(a) Responses to 5 kHz tone bursts. Maximal responses were found at approximately 0.4–0.5 s after the onset of the stimuli. Time shown at each panel represents that after stimulus onset. (b) Time courses of fluorescence signals in the ROI placed in A1, AAF, and A2 shown in (a). (c) Responses to 20 kHz tone bursts. (d) Time courses of fluorescence signals shown in (c). Humps (red arrows) were found in (c,d) after offset of stimuli. Mean and S.E.M. are shown.
Figure 2
Figure 2. Flavoprotein fluorescence responses to tonal stimuli lasting for 7 s.
(a) On- and off-responses to 5 kHz (upper two panels) and 20 kHz stimuli (lower two panels). Clear off-responses were observed after offsets of stimuli. Time shown at each panel represents that after stimulus onset for on-responses (first and third lines of panels), and that after stimulus offset for off-responses (second and fourth lines). Lines above panels show timing of stimulus presentation. (b) Time courses of on- and off-responses in ROIs placed in A1 and the off-response field. (c,d) Amplitudes (c) and peak latency (d) of on- and off-responses in A1, AAF, A2, and the off-response field.
Figure 3
Figure 3. Cortical distribution of off-response peaks.
(a) On- and off-responses to 5 kHz or 20 kHz tonal stimuli lasting for 7 s recorded in the two different mice. (b) Locations of on- and off response peaks relative to on-response peaks to 5 kHz stimuli in A1. No significant tonotopic shift was found in the off-responses, while the on-response peaks were arranged in a tonotopic order within A1. (c) Anterior and medial deviations of 5 kHz off-, 20 kHz off-, and 20 kHz on-response peaks from the 5 kHz on-response peaks in A1. P values were estimated compared with the location of the 5 kHz on-response peaks in A1, unless otherwise specified. (d) Relative location of off-response field (purple) in the schematic map of the auditory cortex. Tonotopically organized fields are shown in rainbow colors.
Figure 4
Figure 4. Off-responses to short test stimuli after conditioning stimuli.
(a) Serial images of on-responses to short test stimuli at 20 kHz lasting for 1 s. Time shown at each panel represents that after stimulus onset. (b) Serial images of on- and off-responses to short test stimuli at 20 kHz for 1 s, which were given to mice 30 s after conditioning stimuli at 20 kHz for 10 s. Images in (a,b) were taken in the same mouse. (c) Time courses of ΔF/F0 in ROIs placed at on-response peaks in A1 and off-response peaks in the off-response field shown in (a,b) with or without preceding conditioning stimuli. Amplitudes of off-responses to short test stimuli were defined as ΔF/F0. When this value was negative, the amplitude was assumed to be zero.
Figure 5
Figure 5. Properties of off-responses to short test stimuli.
(a) Amplitudes of off-responses dependent on duration of conditioning stimuli (left) and intervals between conditioning and test stimuli (right). Statistical differences were evaluated compared with response amplitudes at the 3 s duration of conditioning stimuli (left), or at the 120 s interval between conditioning and test stimuli (right). (b) Relationship between amplitudes of off-responses, and frequencies of conditioning and test stimuli. No apparent frequency specificity was found. (c) Cortical locations of off-response peaks relative to on-response peaks to 5 kHz stimuli in A1. Off-response peaks after conditioning stimuli (vivid colors) were observed in the same area as the response peaks (faint colors) found after long sound stimuli lasting for 7 s.
Figure 6
Figure 6. Suppression of off-responses by MK-801.
(a) On- and off responses to 20 kHz tonal stimuli lasting for 7 s recorded before and after application of MK-801 (0.5 mg/kg, i.p.) in the same mouse. Time shown at each panel represents that after stimulus onset for on-responses (first and second lines of panels), and that after stimulus offset for off-responses (third and fourth lines). (b) Relative amplitudes of on- responses measured in A1 and off-responses measured in the off-response field to 5 kHz or 20 kHz tonal stimuli after application of 0.5 mg/kg MK-801. Values were normalized by the amplitudes before application. (c) Relationship between MK-801 dose and amplitudes of off-responses in the off-response field to short test stimuli at 20 kHz.
Figure 7
Figure 7. Neuronal calcium responses to tonal stimuli recorded at 397 ms intervals.
(a) Two-photon calcium imaging of the off-response field stained with Cal-520. The circle with a diameter of 20 pixels (14.3 μm) shows a neuronal cell body that was stained with Cal-520, but not with SR-101. (b) Example of calcium responses in ΔF/F0 to 5 kHz and 20 kHz stimuli lasting for 7 s, recorded in the cell body shown in (a). Arrow shows gradually-increasing responses before offset of tonal stimuli. The reference (F0) was taken immediately before stimulus onset, because the Ca2 + signals of relatively large amplitudes were less clearly affected by hemodynamic responses. (c) Amplitudes of the on- and off-responses to 5 kHz and 20 kHz stimuli. (d) Averaged traces of ΔF/F0 in selected neurons, which exhibited ΔF/F0 larger than 1% in three frames immediately before tonal offset. Double arrows show increasing responses before tonal offset. (e) Amplitudes of off-responses to 5 kHz and 20 kHz stimuli in neurons with increasing responses >1% or <1%. (f) Possible disinhibition that produces increasing responses and enhances off-responses after long-lasting tonal stimuli. An inhibitory neuron is shown in blue. (g) Correlation between responses elicited by 5 kHz and 20 kHz stimuli. Orange and purple dots show on- and off-responses, respectively. (h) Correlation between on- and off-responses. Blue and red dots show data obtained using 5 kHz and 20 kHz stimuli, respectively.

References

    1. Gaub S., Groszer M., Fisher S. E. & Ehret G. The structure of innate vocalizations in Foxp2-deficient mouse pups. Genes. Brain Behav. 9, 390–401 (2010). - PMC - PubMed
    1. Arriaga G. & Jarvis E. D. Mouse vocal communication system: are ultrasounds learned or innate? Brain Lang. 124, 96–116 (2013). - PMC - PubMed
    1. Kudoh M., Seki K. & Shibuki K. Sound sequence discrimination learning is dependent on cholinergic inputs to the rat auditory cortex. Neurosci. Res. 50, 113–123 (2004). - PubMed
    1. Kudoh M. & Shibuki K. Sound sequence discrimination learning motivated by reward requires dopaminergic D2 receptor activation in the rat auditory cortex. Learn. Mem. 13, 690–698 (2006). - PMC - PubMed
    1. Wang X., Lu T., Bendor D. & Bartlett E. Neural coding of temporal information in auditory thalamus and cortex. Neuroscience 154, 294–303 (2008). - PMC - PubMed