. 2016 Sep 15;30(18):2062-2075.
doi: 10.1101/gad.283317.116. Epub 2016 Sep 29.

E2F coregulates an essential HSF developmental program that is distinct from the heat-shock response

Affiliations

E2F coregulates an essential HSF developmental program that is distinct from the heat-shock response

Jian Li et al. Genes Dev. .

Abstract

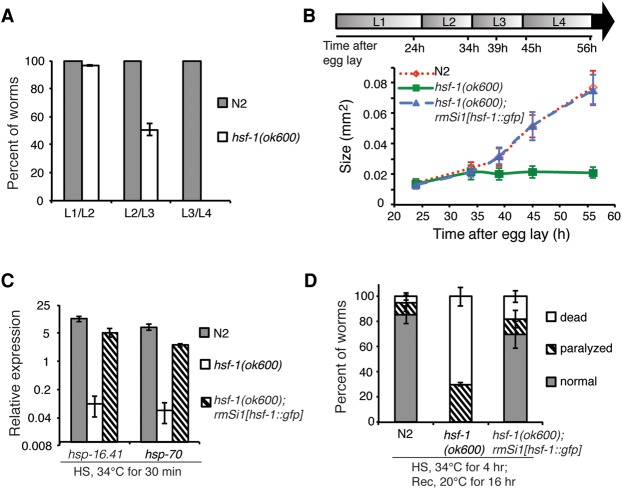
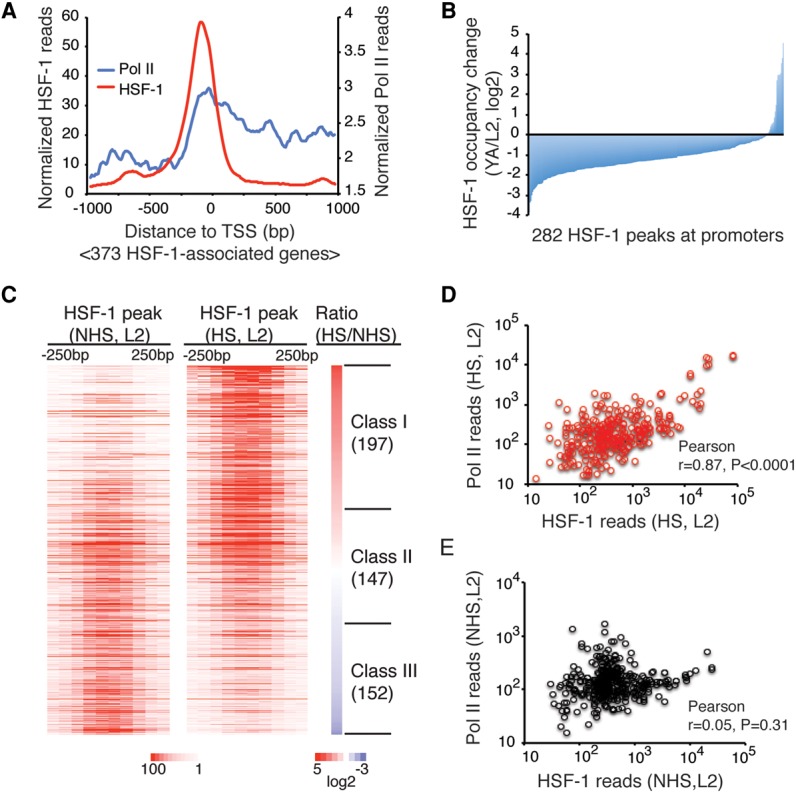
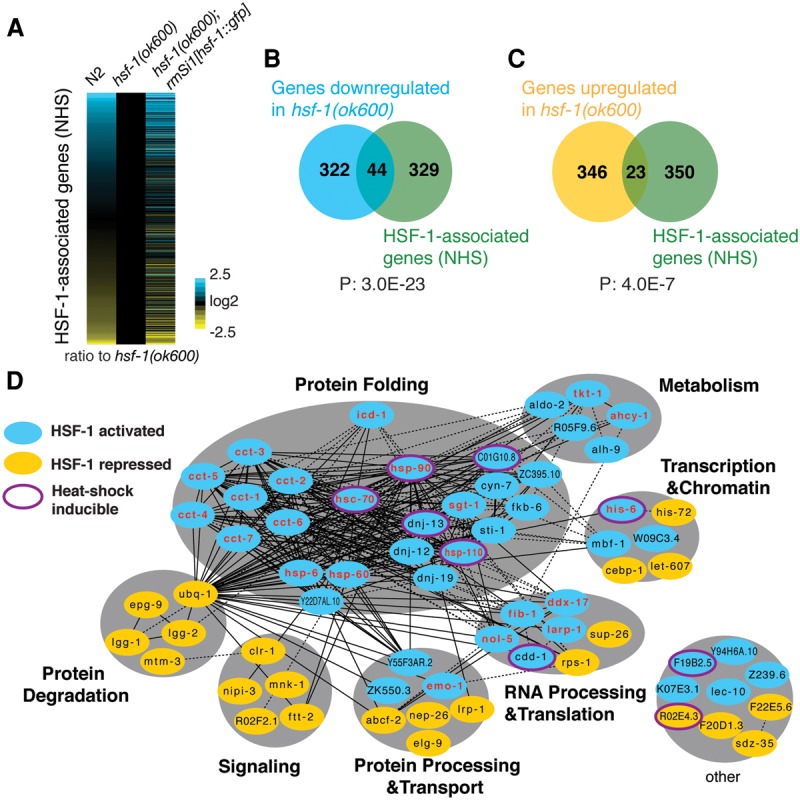
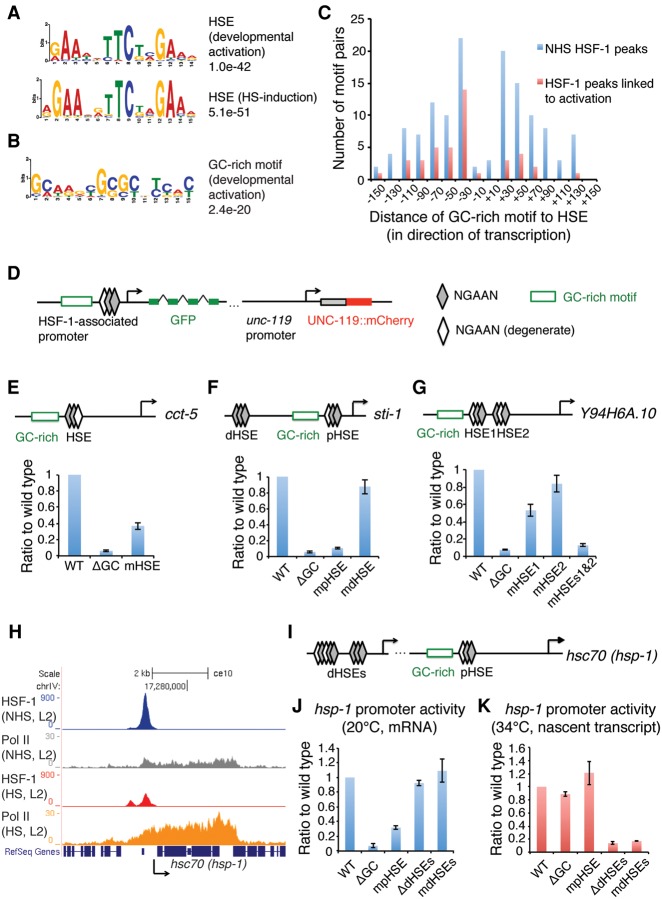
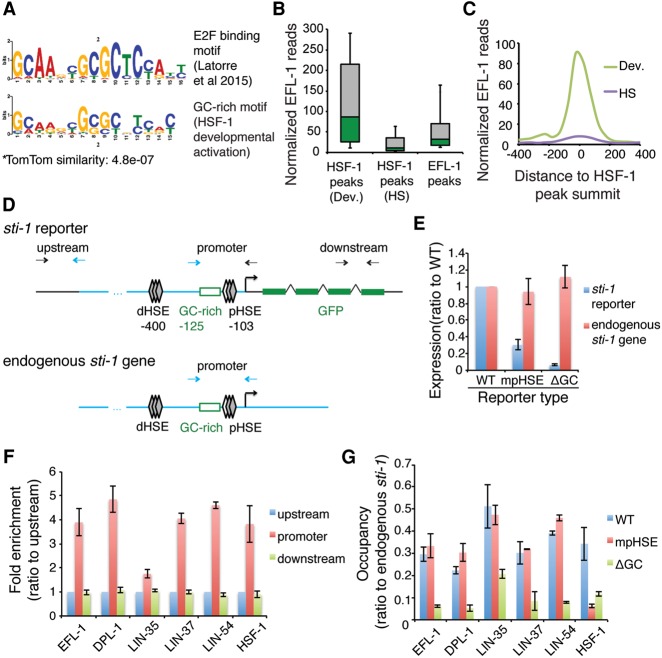
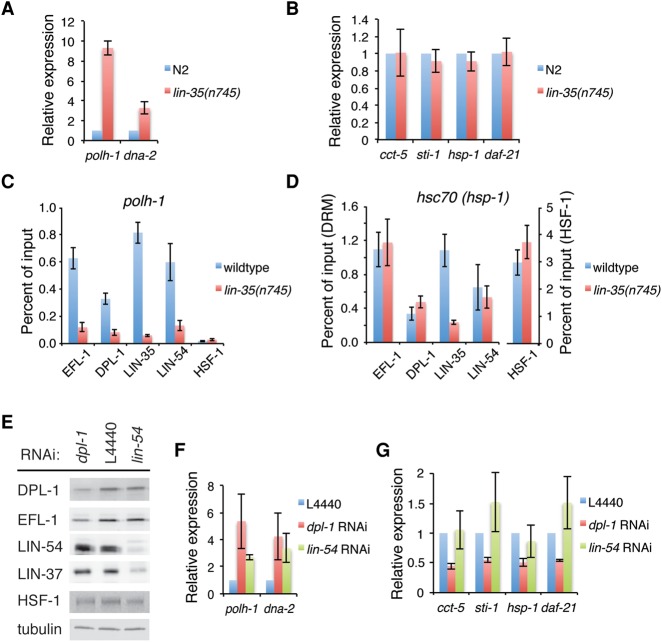
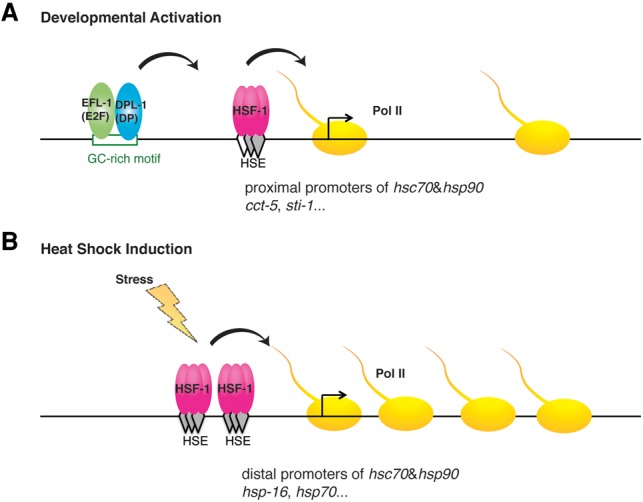
Heat-shock factor (HSF) is the master transcriptional regulator of the heat-shock response (HSR) and is essential for stress resilience. HSF is also required for metazoan development; however, its function and regulation in this process are poorly understood. Here, we characterize the genomic distribution and transcriptional activity of Caenorhabditis elegans HSF-1 during larval development and show that the developmental HSF-1 transcriptional program is distinct from the HSR. HSF-1 developmental activation requires binding of E2F/DP to a GC-rich motif that facilitates HSF-1 binding to a heat-shock element (HSE) that is degenerate from the consensus HSE sequence and adjacent to the E2F-binding site at promoters. In contrast, induction of the HSR is independent of these promoter elements or E2F/DP and instead requires a distinct set of tandem canonical HSEs. Together, E2F and HSF-1 directly regulate a gene network, including a specific subset of chaperones, to promote protein biogenesis and anabolic metabolism, which are essential in development.

Keywords: Caenorhabditis elegans; E2F transcription factor; development; heat-shock factor (HSF); molecular chaperones; stress response; transcription regulation.


Figures

Figure 1.
Figure 1.
HSF-1 is essential for C. elegans larval development. (A) Histograms showing the percent of wild-type (N2) and hsf-1(ok600) animals that passed through each larval molt at 20°C. Error bars represent the SEM of four biological replicates. n = 30 N2; n = 55 hsf-1(ok600). (B) The size of wild-type (N2), hsf-1(ok600), and hsf-1(ok600); rmSi1[hsf-1::gfp] larvae. The rmSi1 transgene carries a single copy of hsf-1p::hsf-1(minigene)::gfp::hsf-1 3′ UTR. At least 30 animals of each genotype were measured. Error bars represent SD. The size of hsf-1(ok600) animals is unchanged from 34 h after egg lay (L2 stage; P = 0.68, one-way ANOVA analysis) and significantly differs from N2 and hsf-1(ok600); rmSi1[hsf-1::gfp] measured at 39 h after egg lay (L3 stage) and thereafter. t-test, P = 0.001. The timeline represents larval stages (L1–L4) at given time points. (C) The expression of hsp-16.41 and hsp-70(C12C8.1) in wild-type (N2), hsf-1(ok600), and hsf-1(ok600); rmSi1[hsf-1::gfp] animals exposed to heat shock (HS; 30 min at 34°C) at L2 stage. Error bars represent the SEM of biological triplicates. (D) Thermorecovery of wild-type (N2), hsf-1(ok600), and hsf-1(ok600); rmSi1[hsf-1::gfp] animals at L2 (30 h after egg lay) exposed to an extended heat shock (HS) for 4 h at 34°C followed by recovery (Rec) for 16 h at 20°C. Error bars represent the SEM of biological triplicates. n = 137 N2; n = 130 hsf-1(ok600); n = 136 hsf-1(ok600); rmSi1[hsf-1::gfp].
Figure 2.
Figure 2.
HSF-1 exhibits distinct genomic occupancy in development compared with the HSR. (A) Composite plots of HSF-1 and Pol II ChIP-seq reads within 1000 bp from the TSSs of 373 HSF-1-associated genes in L2 animals at 20°C. HSF-1-associated genes were defined as genes having HSF-1 ChIP-seq peak summits mapped within 1000 bp from the TSS. (B) Histogram of HSF-1 occupancy changes at promoter-associated HSF-1 peaks between L2 and YA animals at 20°C. The 282 peaks whose summits are within 1000 bp from the TSS detected in either L2 or YA animals were included. HSF-1 occupancy was calculated as normalized HSF-1 ChIP-seq reads within 250 bp from the peak summits. (C) Heat maps of normalized HSF-1 reads at ChIP-seq peaks (mapped to 50 bp bins, ±250 bp from peak summits) in L2 animals grown at 20°C without heat shock (NHS) or exposed for 30 min to 34°C heat shock (HS). Peaks were ranked by the ratio of HSF-1 reads in heat shock compared with without heat shock. The peaks with increased or decreased HSF-1 occupancy by 1.5-fold in heat shock were grouped into class I or class III, respectively, and the remaining peaks with similar HSF-1 occupancy were grouped into class II. The number of genes associated with each class of peaks is shown in parentheses. (D,E) Scatter plots of HSF-1 (−600 to +400 bp) and Pol II (−500 to +1000 bp) ChIP-seq reads at HSF-1-associated promoters from L2 animals in heat shock (D; 313 genes) and without heat shock (E; 373 genes).
Figure 3.
Figure 3.
HSF-1 directly regulates genes essential for C. elegans larval development. (A) Relative expression of HSF-1-associated genes in wild-type (N2), hsf-1(ok600), and hsf-1(ok600); rmSi1[hsf-1::gfp] L2 animals (30 h after egg lay) at 20°C. Gene expression levels were determined by RNA-seq and normalized to that in hsf-1(ok600). (B,C) Venn diagrams showing the overlap of genes down-regulated (B) or up-regulated (C) in hsf-1(ok600) compared with N2 (FDR 0.05) and genes associated with HSF-1. P = Fisher's exact test. (D) The gene network directly regulated by HSF-1 in C. elegans larval development. HSF-1 directly activated genes corresponding to those genes directly associated with HSF-1 and down-regulated in hsf-1(ok600) (indicated in blue ovals); HSF-1 directly repressed genes corresponding to genes associated with HSF-1 and up-regulated in hsf-1(ok600) (indicated in yellow ovals). Solid lines represent physical protein interactions; dashed lines represent genetic interactions or coexpression. The 22 genes labeled in red are known to be required for larval development in genetic analyses. The eight genes induced upon heat shock are indicated with a purple outline around either blue or yellow ovals.
Figure 4.
Figure 4.
HSF-1 transcriptional activities in development require a unique promoter architecture. (A) The HSEs derived from HSF-1 ChIP-seq peaks that are either associated with HSF-1-activated genes in development and correspond to degenerate HSEs (top) or induced upon heat shock and correspond to canonical HSEs comprised of three inverted pentamer NGAAN sequences (bottom). Genes associated with HSF-1 ChIP-seq peaks within 1000 bp from the TSS and significantly increased expression (twofold or more; FDR 0.05) upon heat shock are defined as induced genes. (B) A GC-rich motif derived from HSF-1 ChIP-seq peaks associated with HSF-1-activated genes in development. (C) Histograms representing the position relationship of the GC-rich motif and HSE at HSF-1 ChIP-seq peaks in L2 animals at 20°C. HSF-1 peaks within 1000 bp of TSSs were included. HSF-1 peaks linked to activation are those at the promoters of HSF-1-activated genes in development. (D) Schematic representation of a transcriptional reporter system used to assay HSF-1 developmental targets. The unc-119p::unc-119::mCherry internal reference reporter is on the same construct of the GFP transcriptional reporter. (EG) RT-qPCR analysis of transcriptional reporters of the cct-5 (E), sti-1 (F), and Y94H6A.10 (G) genes in L2 animals at 20°C. The mRNA levels of GFP were normalized to the mRNA levels of mCherry to calculate promoter activity. The relative activity of promoter variants carrying either mutations of the HSE (mHSE) or deletion of the GC-rich motif (ΔGC) is shown as the ratio to the wild-type (WT) promoters. (pHSE) Proximal HSE; (dHSE) distal HSE. Shown at the top of each panel is a schematic of the cct-5, sti-1, and Y94H6A.10 promoters, with the arrow indicating the TSS and direction of transcription. Error bars represent the SEM of biological triplicates. (H) Gbrowser view of HSF-1 and Pol II occupancy at the hsc70 (hsp-1) gene locus in L2 animals with or without heat shock. (I) Schematic representation of the hsc70 (hsp-1) promoter. The two arrows indicate the distal and proximal TSSs, respectively. (J,K) RT-qPCR analysis of transcription reporters of the hsc70 (hsp-1) gene in L2 animals at 20°C (J) or with a 30-min heat shock at 34°C (K). Because of the high abundance of hsc70 (hsp-1) mRNA at 20°C, the newly synthesized nascent transcript during heat shock was measured to calculate promoter activity at 34°C. (mdHSEs) Mutation of both distal HSEs; (ΔdHSEs) deletion of the region containing both distal HSEs.
Figure 5.
Figure 5.
An E2F complex binds to the GC-rich motif at HSF-1 developmental genes. (A) The GC-rich motif from HSF-1 directly activated promoters in development (bottom) resembles an E2F-binding motif (top) derived from ChIP-seq peaks of the E2F-associated DRM complex (Latorre et al. 2015). (B) Box plots of EFL-1 ChIP-seq reads at HSF-1 peaks that are linked to either developmental activation (Dev.), heat-shock induction (HS), or all EFL-1 peaks at promoters (±250 bp around summits) (Kudron et al. 2013). Peaks linked to HSF-1 activation in both conditions were excluded. Boxes depict the 25th through 75th percentiles, and whiskers show the 10th through 90th percentiles. (C) Composite plots of EFL-1 ChIP-seq reads (Kudron et al. 2013) within 400 bp from the summits of the HSF-1 peaks that are linked to either developmental activation (Dev.) or heat-shock induction (HS). (D) Schematic representation of ChIP-qPCR analysis at the integrated sti-1 reporters. Paired arrows represent the primers used in qPCR analysis, blue lines and arrows indicate the sequences from the endogenous sti-1 promoter, and black lines and arrows indicate the sequences specific to the reporter transgene. (E) RT-qPCR analysis of the sti-1 reporter and the endogenous sti-1 gene in transgenic animals. Normalized expression levels of the reporter (GFP/mCherry) and the endogenous gene (sti-1/housekeeping genes) were measured in transgenic animals carrying the sti-1 reporter containing the wild-type (WT) promoter or promoter variants with mutations in the proximal HSE (mpHSE) or deletion of the GC-rich motif (ΔGC). Data are represented as ratios of the expression levels in animals carrying the wild-type reporter. Error bars represent the SEM of biological triplicates. (F) ChIP-qPCR analysis of HSF-1 and subunits of the DRM complex in transgenic animals carrying the wild-type sti-1 reporter. Occupancies of the transcription factors at three regions across the reporter were measured and are shown as fold enrichment over the upstream control region. Error bars represent the SEM of biological triplicates. (G) ChIP-qPCR analysis of HSF-1 and subunits of the DRM complex in transgenic animals carrying different sti-1 reporters. Transgenic animals with an integrated sti-1 reporter carrying the wild-type (WT) promoter, mutation of the proximal HSE (mpHSE), or deletion of the GC-rich motif (ΔGC) were analyzed. Occupancies of the transcription factors were measured at the promoter regions of the reporter as well as the endogenous sti-1 gene, and the normalized occupancy (reporter/endogenous gene) is shown in the histograms. Error bars represent the SEM of biological triplicates.
Figure 6.
Figure 6.
EFL-1/DPL-1 functions as a coactivator for HSF-1 at its developmental targets independently of LIN-35. (A,B) RT-qPCR analysis of the canonical DRM-repressed genes polh-1 and dna-2 (A) and the HSF-1 developmental target genes cct-5, sti-1, hsc70(hsp-1), and hsp90(daf-21) (B) in the wild-type N2 or lin-35(nn745) L2 larvae. Expression levels are plotted as the ratio to that of N2 animals. Error bars represent the SEM of biological triplicates. (C,D) ChIP-qPCR analysis of HSF-1 and subunits of the DRM complex at the promoters of the polh-1 (C) and hsc70(hsp-1) (D) genes. Occupancies of transcription factors were plotted as percent of input. Error bars represent the SEM of biological triplicates. (E) Western blot analysis of HSF-1 (HSF-1::GFP) and subunits of the DRM complex in hsf-1(ok600); rmSi1[hsf-1::gfp] L2 animals treated with dpl-1 RNAi, lin-54 RNAi, or the empty vector control L4440. α-Tubulin was probed as a loading control. (F,G) RT-qPCR analysis of polh-1 and dna-2 (F) and cct-5, sti-1, hsc70(hsp-1), and hsp90(daf-21) (G) in hsf-1(ok600); rmSi1[hsf-1::gfp] L2 animals treated with dpl-1 RNAi, lin-54 RNAi, or the empty vector control L4440. Expression levels are plotted as the ratio to that of the L4440 control. Error bars represent the SEM of biological triplicates.
Figure 7.
Figure 7.
Model of HSF-1 transcription activation in larval development and the HSR. (A) Schematic of an HSF-1 developmentally activated promoter showing binding of EFL-1(E2F)/DPL-1(DP) to the GC-rich motif to function as an activator by enhancing the binding of HSF-1 to a degenerate HSE, resulting in transcriptional activation. (B) Schematic of classical heat-shock-responsive gene in which multiple HSF-1 trimers bind to tandem canonical HSEs, leading to inducible transcription.

References

    1. Akerfelt M, Morimoto RI, Sistonen L. 2010a. Heat shock factors: integrators of cell stress, development and lifespan. Nat Rev Mol Cell Biol 11: 545–555. - PMC - PubMed
    1. Akerfelt M, Vihervaara A, Laiho A, Conter A, Christians ES, Sistonen L, Henriksson E. 2010b. Heat shock transcription factor 1 localizes to sex chromatin during meiotic repression. J Biol Chem 285: 34469–34476. - PMC - PubMed
    1. Albanese V, Yam AY, Baughman J, Parnot C, Frydman J. 2006. Systems analyses reveal two chaperone networks with distinct functions in eukaryotic cells. Cell 124: 75–88. - PubMed
    1. Araya CL, Kawli T, Kundaje A, Jiang L, Wu B, Vafeados D, Terrell R, Weissdepp P, Gevirtzman L, Mace D, et al. 2014. Regulatory analysis of the C. elegans genome with spatiotemporal resolution. Nature 512: 400–405. - PMC - PubMed
    1. Baler R, Dahl G, Voellmy R. 1993. Activation of human heat shock genes is accompanied by oligomerization, modification, and rapid translocation of heat shock transcription factor HSF1. Mol Cell Biol 13: 2486–2496. - PMC - PubMed

Publication types

MeSH terms

Substances