. 2016 Nov 1;7(44):71580-71593.
doi: 10.18632/oncotarget.12259.

Blockade of the Hedgehog pathway downregulates estrogen receptor alpha signaling in breast cancer cells

Affiliations

Blockade of the Hedgehog pathway downregulates estrogen receptor alpha signaling in breast cancer cells

Yumei Diao et al. Oncotarget. .

Abstract

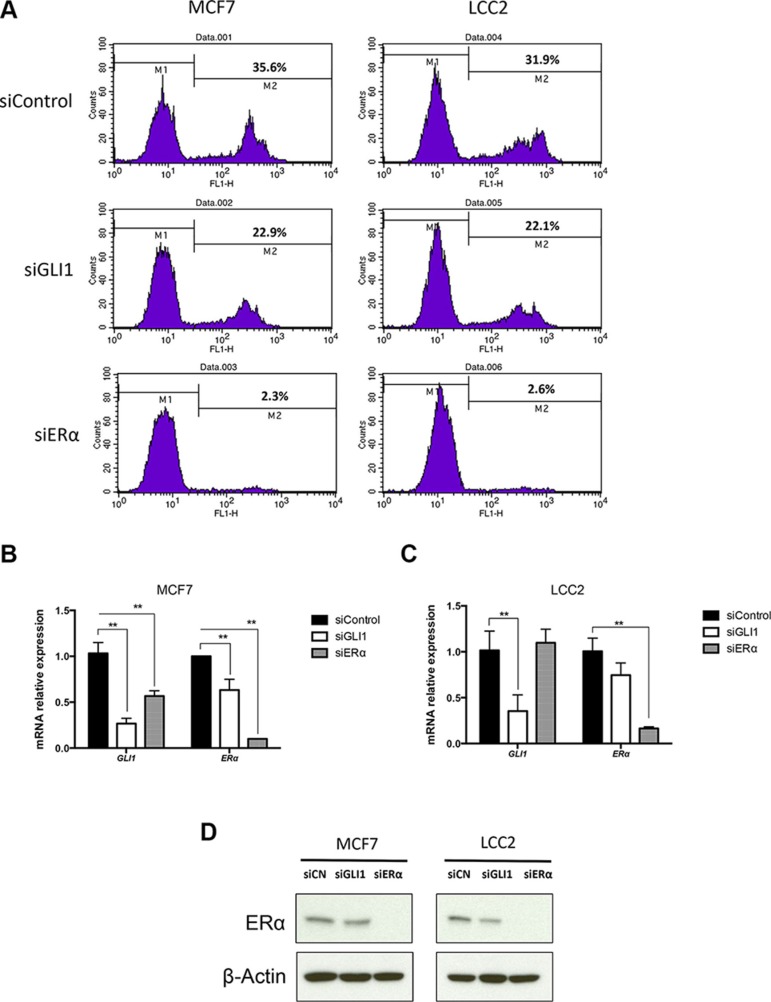
Anti-estrogen treatment, exemplified by tamoxifen, is a well-established adjuvant therapy for estrogen receptor alpha (ERα)-positive breast cancer. However, the effectiveness of this drug is limited due to the development of resistance. The Hedgehog (HH) signaling pathway is critical in embryonic development, and aberrant activation of this transduction cascade is linked to various malignancies. However, it remains unclear whether HH signaling is activated in human breast cancer and related to tamoxifen resistance. Deciphering how this pathway may be involved in breast cancer is a crucial step towards the establishment of targeted combinatorial treatments for this disease. Here, we show that the expression of the HH signaling effector protein GLI1 is higher in tamoxifen resistant compared to sensitive cells. Tamoxifen resistant cells have stronger ERα transcriptional activity relative to sensitive cells, even though the ERα expression is similar in both cell types. Knockdown of GLI1 attenuates cell proliferation and reduces ERα transcriptional activity in both sensitive and resistant cells, irrespective of estrogen stimulation. Combinatorial treatment of tamoxifen and the GLI antagonist GANT61 further suppresses the growth of sensitive and resistant cells relative to administration of only tamoxifen, and this was irrespective of estrogen stimulation. Moreover, a positive correlation between GLI1 and ERα expression was identified in breast cancer samples. Additionally, high GLI1 expression predicted worse distant metastasis-free survival in breast cancer patients. These data suggest that the HH pathway may be a new candidate for therapeutic targeting and prognosis in ERα-positive breast cancer.

Keywords: GANT61; GLI1; drug targeting; glioma associated oncogene; tamoxifen.


Conflict of interest statement

CONFLICTS OF INTEREST

The authors declare no conflicts of interest.

Figures

Figure 1
Figure 1. Characterization of tamoxifen sensitive MCF7 and tamoxifen resistant LCC2 breast cancer cells
(A) Endogenous expression of GLI1, PTCH1, ERα, ADORA1 and pS2 in MCF7 and LCC2 cells was determined by real-time PCR. Data are represented as relative expression (2−ΔΔCt values), calculated by subtracting the Ct value of the housekeeping gene TBP from the Ct value of the interrogated transcripts (ΔCt), and normalized to the ΔCt values obtained with MCF7. Representative data from one of three independent experiments are shown. Error bars indicate the standard deviation. **, Statistical significant, P < 0.01, compared to control, calculated by the Student's t-test. (B) Protein levels of GLI1, ERα and β-Actin in MCF7 and LCC2 cells were analyzed by Western blot. β-Actin was used as the endogenous protein control. (C) The effects of tamoxifen on cell viability. MCF7 and LCC2 cells were treated with 0, 4, 6, 8, 10, 20 or 40 μM tamoxifen and after 48 hours cell viability was determined with the WST-1 assay. The absorbance at 450 nm was measured with the reference wavelength set at 690 nm. Shown are data from triplicate measurements. Representative data from one of three independent experiments are shown. Error bars indicate the standard deviation. The two-way ANOVA analysis using Sidak's multiple comparisons was employed to calculate statistical significance (**P < 0.01).
Figure 2
Figure 2. Depletion of GLI1 or ERα reduces the proliferation of MCF7 and LCC2 cells
(A) MCF7 and LCC2 cells, cultured for 48 hours following transfection with control siRNA (siControl), GLI1 siRNA (siGLI1) or ERα siRNA (siERα), were subjected to the EdU incorporation assay for 1 hour. The percentage of cells labeled with Alexa Fluor 488 azide was detected by flow cytometry. The expression of GLI1 and ERα in MCF7 (B) and LCC2 (C) cells, following siRNA knockdown of GLI1 or ERα, was determined by real-time PCR. Data are represented as relative expression (2-ΔΔCt values), calculated by subtracting the Ct value of the housekeeping gene TBP from the Ct value of the interrogated transcripts (ΔCt), and normalized to the ΔCt value obtained with control siRNA. Representative data from one of three independent experiments are shown. Error bars indicate the standard deviation. **, Statistical significant, P < 0.01, compared to control, calculated by the Student's t-test. (D) Protein levels of ERα in MCF7 and LCC2 cells, transfected with control siRNA (siCN), GLI1 siRNA (siGLI1) or ERα siRNA (siERα) for 48 hours, was determined by Western blot. β-Actin was used as the endogenous protein control.
Figure 3
Figure 3. GLI1 depletion reduces the activity of an ERα reporter
MCF7 and LCC2 cells were transfected with control siRNA (siControl) or GLI1 siRNA (siGLI1) and after 24 hours were co-transfected with the reporter plasmid ERE-TK-Luc and the pRL-TK control plasmid. Subsequently, both cell lines were treated with 10 nM E2 or ethanol (EtOH) for 24 hours in serum-deprived medium before harvesting. Luciferase expression was measured 48 hours after plasmid transfection. Shown are data from two independent experiments. Error bars indicate the standard error of the mean (SEM). **, Statistical significant, P < 0.01, compared to control, calculated by the Student's t-test.
Figure 4
Figure 4. GLI1 depletion reduces the expression of ERα, its target genes and the binding to its targets
(A) The expression of GLI1, PTCH1, ERα and its target genes, IL20, ADORA1 and pS2 in MCF7 and LCC2 cells treated with 10 nM E2 or ethanol (EtOH) for 3 hours in serum-deprived medium, following siRNA knockdown of GLI1, was determined by real-time PCR. Data are represented as relative expression (2−ΔΔCt values), calculated by subtracting the Ct value of the housekeeping gene TBP from the Ct value of the interrogated transcripts (ΔCt), and normalized to the ΔCt value obtained with control siRNA in MCF7/LCC2 cells. Representative data from one of three independent experiments are shown. Error bars indicate the standard deviation. * or **, Statistical significant, P < 0.05 or P < 0.01 respectively, compared to control siRNA, calculated by the Student's t-test. (B) Protein levels of ERα and β-Actin in MCF7 and LCC2 cells treated with 10 nM E2 or ethanol (EtOH) for 6 and 12 hours in serum-deprived medium, 24 hours after transfection with control siRNA (siCN) or GLI1 siRNA (siGLI1), was determined by Western blot. β-Actin was used as the endogenous protein control. (C) Recruitment of ERα to the promoter of the pS2 gene is diminished following GLI1 depletion. MCF7 cells were transfected with control siRNA or GLI1 siRNA and after 48 hours treated with 10 nM E2 or ethanol (EtOH) for 30 min in serum-deprived medium before harvesting and subjected to ChIP-qPCR analysis with an ERα antibody and PCR primers spanning the ERα binding site at the pS2 gene promoter. The data presented are normalized to input DNA and expressed as fold enrichment over IgG. Shown are data from two independent experiments. Error bars indicate the standard error of the mean (SEM). **, Statistical significant, P < 0.01, compared to IgG control, calculated by the Student's t-test. A schematic diagram of the promoter region of the pS2 gene, with the transcriptional start sites (+1) indicated by an arrow, the ERα binding site by a black oval and the position of the primers (−296, −235) is also shown. Note the increased ERα binding at the promoter following E2 treatment, which is eliminated by GLI1 depletion.
Figure 5
Figure 5. GANT61 increases tamoxifen cytotoxicity, irrespective of the presence or absence of estrogen
(A), (B) GANT61 suppresses the cell viability of MCF7 and LCC2 cells. Both cell lines were treated with 0, 2.5, 5, 10, 20 and 30 μM GANT61 or DMSO as a control. After 48 hours cell viability was determined with the WST-1 assay. Error bars indicate the standard deviation. The two-way ANOVA analysis using Sidak's multiple comparisons was employed to calculate statistical significance (**P < 0.01). (C) GANT61 treatment reduces the cell proliferation of MCF7 and LCC2 cells. Both cell lines were treated with 10 μM GANT61 or DMSO as a control. After 48 hours cell proliferation was determined by the EdU incorporation assay using flow cytometry. (D), (E) The expression of GLI1, ERα, pS2 and IL20 in MCF7 and LCC2 cells treated with GANT61 or DMSO for 48 hours were measured by real-time PCR. Error bars indicate the standard deviation. **, Statistical significant, P < 0.01 respectively, compared to the DMSO control, calculated by the Student's t-test. (FI) MCF7 and LCC2 cells were treated with 10 nM E2 or EtOH and 10 μM GANT61 or DMSO in the presence of different concentrations (0, 1, 2.5, 5, 10 or 20 μM) of tamoxifen, for 48 hours and the number of viable cells was measured with the WST-1 assay using a TECAN plate spectrophotometer. Shown are data from triplicate measurements expressed as percentage of control. Representative data from one of three independent experiments are shown. Error bars indicate the standard deviation. The two-way ANOVA analysis using Sidak's multiple comparisons was employed to calculate statistical significance (**P < 0.01). (J) MCF7 and LCC2 cells, cultured for 24 hours following transfection with control siRNA (siCN) or GLI1 siRNA (siGLI1) and treated with 10 μM tamoxifen (TAM) or ethanol (EtOH) for 48 hours, were subjected to the EdU incorporation assay for 1 hour. The percentage of cells labeled with Alexa Fluor 488 azide was detected by flow cytometry.
Figure 6
Figure 6. GLI1 expression positively correlates with the expression of ESR1 and its target genes and is a negative prognostic marker in breast cancer
(AC) Scatter plots showing significant correlation between GLI1 and ESR1 (A), GLI1 and pS2 (B), GLI1 and GREB1 (C) expression in a publically available breast cancer dataset, test statistics were from Pearson product-moment correlation. (D) Kaplan-Meier plot showing that high GLI1 expression correlates with worse distant metastasis-free survival (DMFS) in patients with ERα-positive, Grade 1 breast cancer. The Kaplan-Meier plot is stratified for high (red) and low (black) GLI1 expression (n = 126; P = 0.0081).

References

    1. McGuire A, Brown JA, Malone C, McLaughlin R, Kerin MJ. Effects of age on the detection and management of breast cancer. Cancers. 2015;7:908–929. - PMC - PubMed
    1. McGuire S. World Cancer Report 2014. Geneva, Switzerland: World Health Organization, International Agency for Research on Cancer, WHO Press, 2015. Adv Nutr. 2016;7:418–419. - PMC - PubMed
    1. Musgrove EA, Sutherland RL. Biological determinants of endocrine resistance in breast cancer. Nat Rev Cancer. 2009;9:631–643. - PubMed
    1. Ramaswamy B, Lu YZ, Teng KY, Nuovo G, Li XB, Shapiro CL, Majumder S. Hedgehog signaling is a novel therapeutic target in tamoxifen-tesistant breast cancer aberrantly activated by PI3K/AKT pathway. Cancer Res. 2012;72:5048–5059. - PMC - PubMed
    1. Takebe N, Miele L, Harris PJ, Jeong W, Bando H, Kahn M, Yang S, Ivy SP. Targeting Notch, Hedgehog, and Wnt pathways in cancer stem cells: clinical update. Nat Rev Clin Oncol. 2015;12:445–464. - PMC - PubMed

MeSH terms