. 2016 Sep 30;11(9):e0162984.
doi: 10.1371/journal.pone.0162984. eCollection 2016.

Identification and Characterization of Two Human Monocyte-Derived Dendritic Cell Subpopulations with Different Functions in Dying Cell Clearance and Different Patterns of Cell Death

Affiliations

Identification and Characterization of Two Human Monocyte-Derived Dendritic Cell Subpopulations with Different Functions in Dying Cell Clearance and Different Patterns of Cell Death

Uriel Trahtemberg et al. PLoS One. .

Abstract

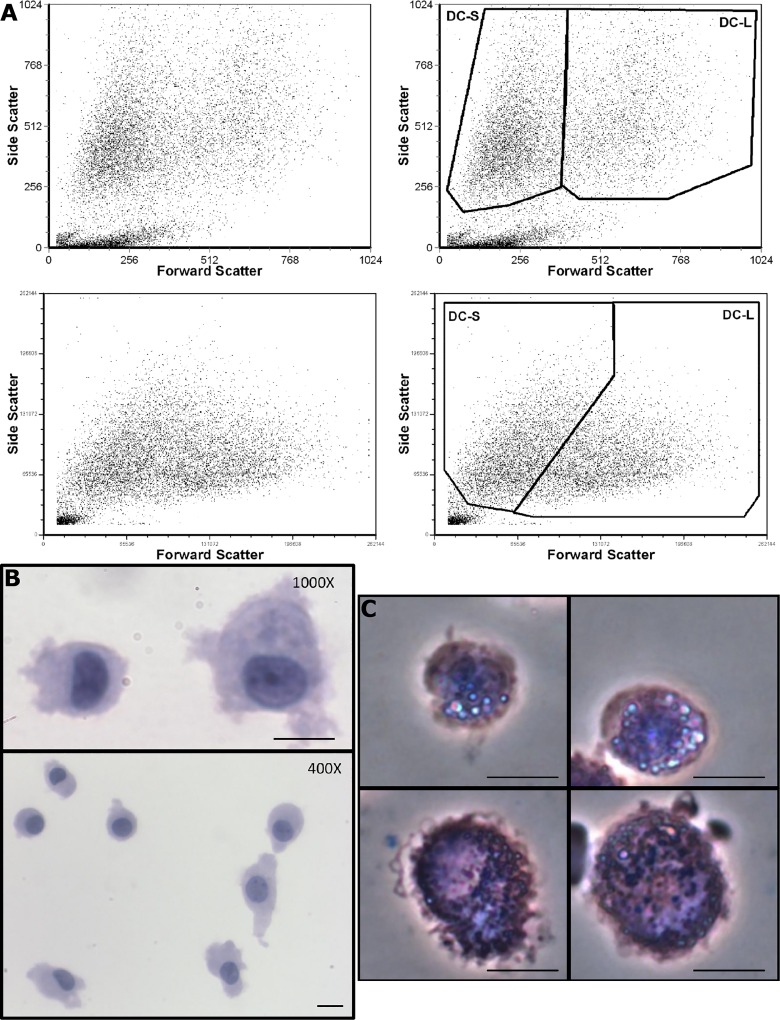
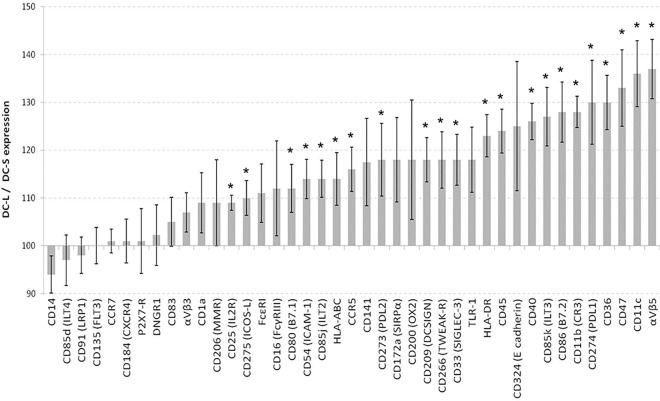
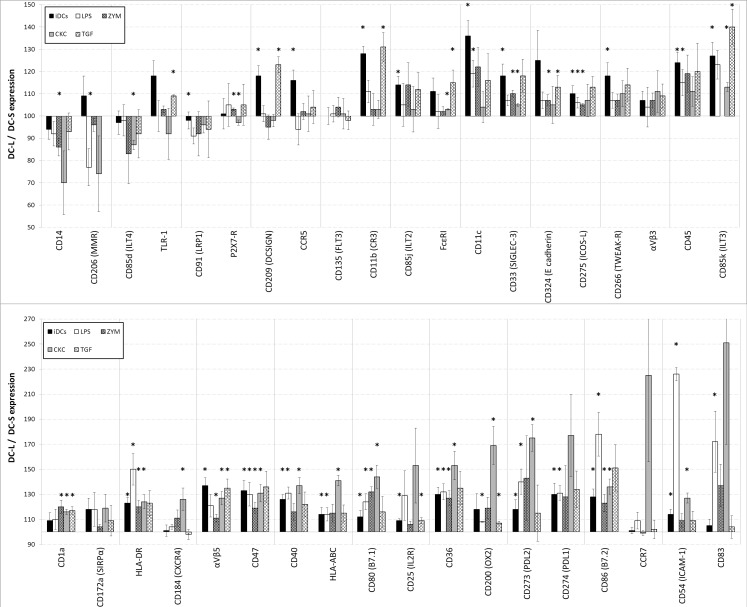
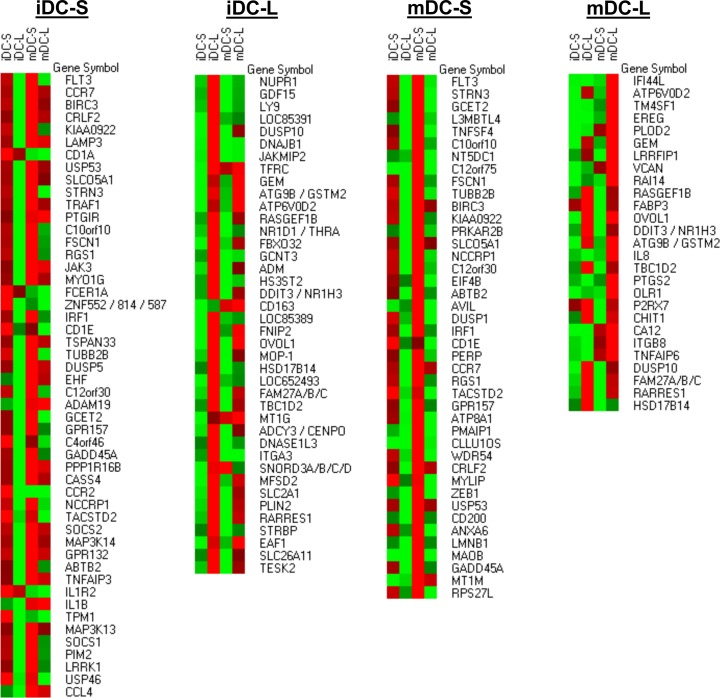
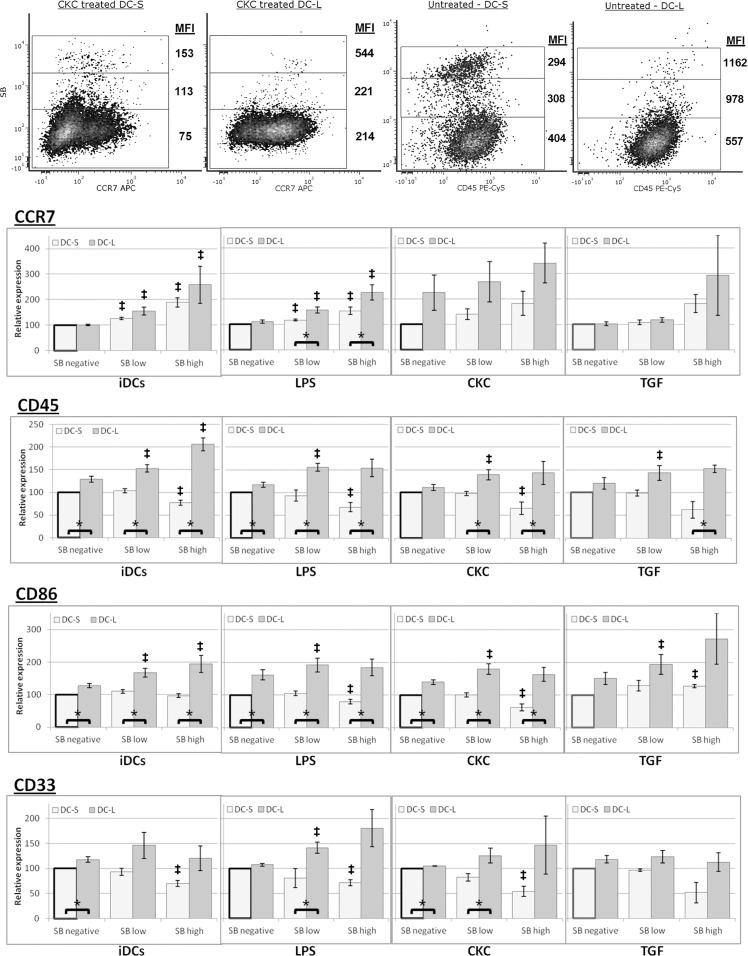
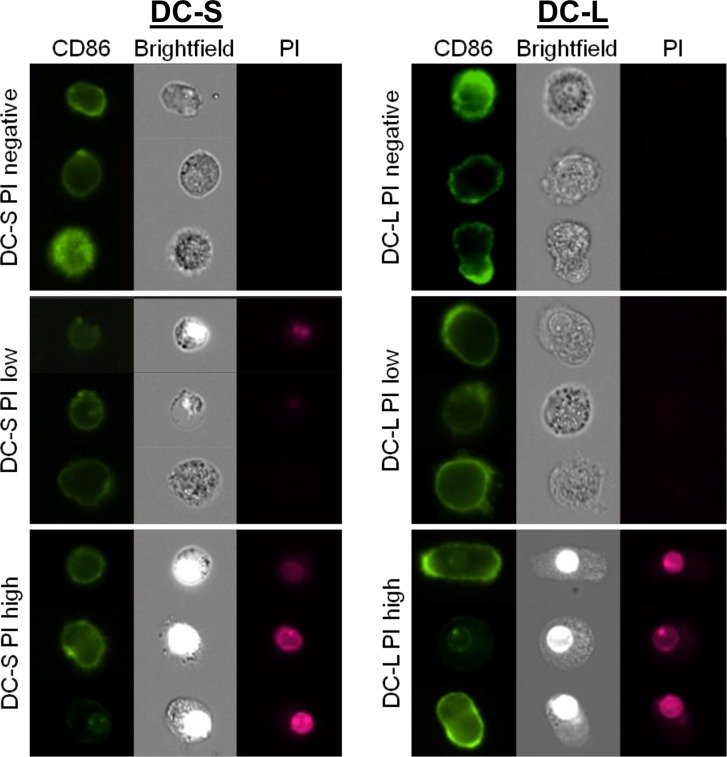
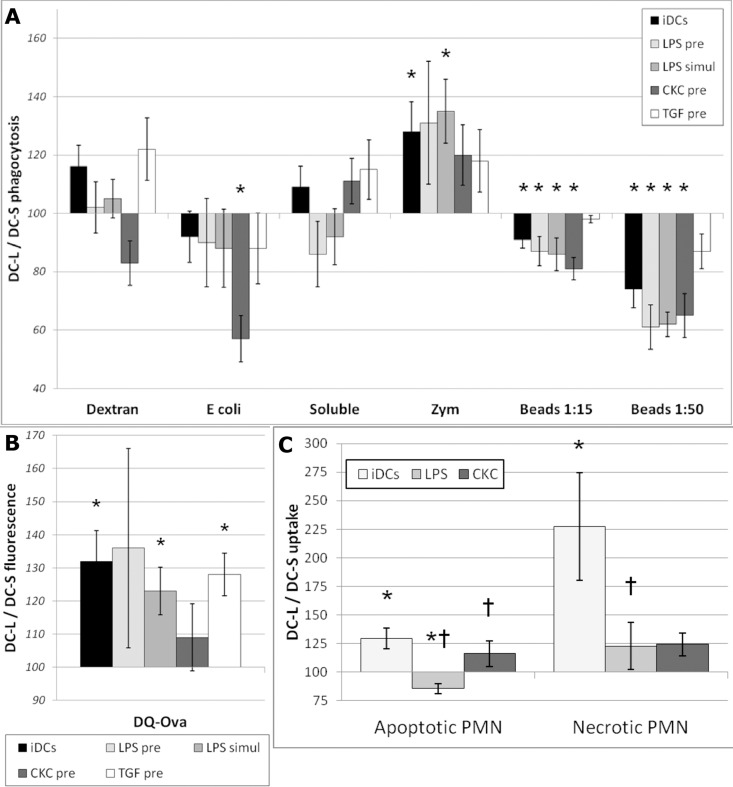
Human monocyte-derived dendritic cells (mdDCs) are versatile cells that are used widely for research and experimental therapies. Although different culture conditions can affect their characteristics, there are no known subpopulations. Since monocytes differentiate into dendritic cells (DCs) in a variety of tissues and contexts, we asked whether they can give rise to different subpopulations. In this work we set out to characterize two human mdDC subpopulations that we identified and termed small (DC-S) and large (DC-L). Morphologically, DC-L are larger, more granular and have a more complex cell membrane. Phenotypically, DC-L show higher expression of a wide panel of surface molecules and stronger responses to maturation stimuli. Transcriptomic analysis confirmed their separate identities and findings were consistent with the phenotypes observed. Although they show similar apoptotic cell uptake, DC-L have different capabilities for phagocytosis, demonstrate better antigen processing, and have significantly better necrotic cell uptake. These subpopulations also have different patterns of cell death, with DC-L presenting an inflammatory, "dangerous" phenotype while DC-S mostly downregulate their surface markers upon cell death. Apoptotic cells induce an immune-suppressed phenotype, which becomes more pronounced among DC-L, especially after the addition of lipopolysaccharide. We propose that these two subpopulations correspond to inflammatory (DC-L) and steady-state (DC-S) DC classes that have been previously described in mice and humans.


Conflict of interest statement

The authors have declared that no competing interests exist.

Figures

Fig 1
Fig 1. Light scatter and morphology of DC-S and DC-L.
A) Forward vs side scatter dot plots of DCs analyzed by flow cytometry. Left panels show the ungated populations, right panels show the gating strategy used. The top panels show iDCs analyzed with FACScan, while the bottom panels show LPS-matured DCs analyzed in an LSR II. Gated populations represent viable cells (see main text). B) iDCs were prepared by cytocentrifugation, fixed with ethanol, and then stained with hematoxylin and eosin. In the top figure, two DCs with significant size differences are seen at high magnification. In the bottom figure, a lower magnification field shows a collection of DCs of different sizes. C) iDCs were sorted as described in Materials and Methods and then imaged live after addition of crystal violet using phase contrast. In the top panels we see two examples of DC-S, while the bottom panels show two examples of DC-L. Bar: 10 μm.
Fig 2
Fig 2. Expression of surface markers on immature DC-L vs DC-S.
The relative surface marker expression of DC-L vs DC-S at the immature stage is shown. DC-S median fluorescence intensity (MFI) was normalized to 100; values above and below 100 indicate higher and lower expression, respectively, of DC-L as compared to DC-S. * = p<0.05 for the DC-L / DC-S MFI ratio. n ≥ 3 for all markers. Only SB- or PI-negative cells are shown. Error bars = ±SEM. We also tested CCR2, CD1e, CD121b (IL1R2), CD163, HLA-G, LOX-1 (OLR1), OX40-L (CD252), RAGE, TIM-1, and TSLP-R; however, these surface markers were expressed at very low levels, precluding accurate quantification, or not expressed at all, thus, they are not shown.
Fig 3
Fig 3. Changes in surface marker expression of DC-L vs DC-S following stimulation.
The relative marker expression of DC-L vs DC-S at the immature stage (iDCs), as well as following stimulation with LPS, zymosan, a CKC, or TGF-β is shown. The MFI of DC-S was normalized to 100; values above and below 100 indicate higher and lower expression, respectively, of DC-L as compared to DC-S. * = p<0.05 for the DC-L / DC-S MFI ratio. n ≥ 3 for all markers. Only SB- or PI-negative cells shown. Error bars = ±SEM.
Fig 4
Fig 4. Characterization of differentially expressed transcripts in DC-S and DC-L.
iDCs were sorted into DC-S and DC-L and replated for 24 hours with or without LPS, followed by RNA extraction. A pool of 3 experiments was analyzed using Affymetrix microarrays. Four pooled RNA datasets were obtained: DC-S at the immature stage and after LPS stimulation (iDC-S and mDC-S, respectively), and DC-L at the immature stage and after LPS stimulation (iDC-L and mDC-L, respectively). The data was preprocessed using RMA and a cutoff of 4 (log). In order to obtain the list of differentially expressed genes, the expression profiles of DC-S and DC-L were subtracted from each other. The list of genes presented in each category (iDC-S, iDC-L, mDC-S and mDC-L) represents genes that were differentially expressed, defined as a transcript with at least a twofold difference; thus, a gene that is present at similar levels in both subsets would be excluded from the results, even if highly expressed. Due to the cutoff used, fold changes indicate minimal overexpression (the differences can be larger but not smaller). A heatmap representation of the transcripts is shown at absolute levels after RMA and cutoff, in comparison to all the other samples. Red indicates high expression; green, low. Values were row-normalized; shown from top to bottom, from highest to lowest overexpression.
Fig 5
Fig 5. Patterns of surface marker expression changes upon spontaneous DC death.
DCs were labeled with fluorescent antibodies for marker expression and co-stained with SB. The cells were gated for DC-S and DC-L, as well as SB negative, low, and high, indicating advancing stages of spontaneous cell death during culture. Top Row: Density plots of representative examples are shown. The MFI of each marker is indicated beside the gates. All gates include at least 50 events. Bottom rows (bar charts): DCs at the immature stage and after stimulation with LPS, CKC, and TGF-β, as indicated, were co-stained with fluorescent antibodies and SB, and gated as described above. Values were normalized so that SB negative DC-S = 100 (bold outline). n≥3 for all markers. * = p<0.05 for the DC-L / DC-S MFI ratio. ‡ = p<0.05 for the DC-L / DC-S MFI ratio change vs SB negative (paired t-test). Error bars = ±SEM.
Fig 6
Fig 6. Imaging of live DCs stained with CD86 and PI.
iDCs were labeled with CD86, co-stained with PI and imaged using an Amnis Imagestream™ cytometer. The cells were gated into DC-S (left column) and DC-L (right column), as well as PI-negative, low, and high, using an analogous scheme to the one used with other flow cytometers. Three representative examples from every set are shown.
Fig 7
Fig 7. Phagocytosis, antigen-processing, and uptake of dying cells by DC-S vs DC-L.
A) Targets were added to iDCs, to DCs previously stimulated for 24 hrs with LPS, CKC, or TGF-β (“pre”), or simultaneously with LPS (“simul”), as indicated. * = p < 0.05 for the DC-L / DC-S MFI ratio. n≥3. Only SB- or PI-negative cells shown. Error bars = ±SEM. DCs were incubated with the indicated fluorescent targets for 8–12 hours and then analyzed by flow cytometry. B) Same as "A" but using DQ-ovalbumin, which is ovalbumin over-conjugated with fluorochrome, and thus self-quenching. After uptake and degradation, the fluorochromes in the resulting peptides are sparser and can fluoresce; therefore, higher fluorescence indicates higher uptake and/or processing of the original protein. C) DCs were incubated with DiD-labeled (fluorescent) apoptotic PMN at a ratio of 1:4 for 8–12 hours. Apoptotic cells were added to iDCs or to DCs previously stimulated for 24 hours with LPS or CKC, as indicated. Samples were then stained with HLA-DR or DCSIGN to specifically identify the DCs, and analyzed by flow cytometry. The MFI of DC-S was normalized to 100; values above and below 100 indicate higher and lower expression, respectively, among DC-L as compared to DC-S. * = p < 0.05 for the DC-L / DC-S MFI ratio. † = p < 0.05 for the DC-L / DC-S MFI ratio change in mature vs immature DCs (paired t-test). n ≥ 3. Only SB- or PI-negative cells shown. Error bars = ±SEM.
Fig 8
Fig 8. Phenotype after interaction with apoptotic cells.
DCs were mixed with apoptotic PBMC at a ratio of 1:4 for 24 hours. LPS was added 6 hours after the apoptotic cells, as indicated. Only SB- or PI-negative cells are shown; representative of 4 experiments. Top panel: The change in the expression of surface markers for all DCs is shown, normalized for iDCs (bold outline). Bottom panel: Same as the top panel, but instead of showing the results for all DCs, the MFI of iDC-S is normalized to 100; values above and below 100 indicate higher and lower expression, respectively, among DC-L as compared to DC-S.

References

    1. Heath WR, Carbone FR. Dendritic cell subsets in primary and secondary T cell responses at body surfaces. Nat Immunol. 2009;10(12):1237–44. 10.1038/ni.1822 - DOI - PubMed
    1. Banchereau J, Steinman RM. Dendritic cells and the control of immunity. Nature. 1998;392(6673):245–52. - PubMed
    1. Tisch R. Immunogenic versus tolerogenic dendritic cells: a matter of maturation. Int Rev Immunol. 2010;29(2):111–8. 10.3109/08830181003602515 - DOI - PubMed
    1. Liu K, Nussenzweig MC. Origin and development of dendritic cells. Immunol Rev. 2010;234(1):45–54. 10.1111/j.0105-2896.2009.00879.x - DOI - PubMed
    1. Mildner A, Jung S. Development and function of dendritic cell subsets. Immunity. 2014;40(5):642–56. 10.1016/j.immuni.2014.04.016 - DOI - PubMed