Review
. 2017 Feb;45(2):337-355.
doi: 10.1002/jmri.25479. Epub 2016 Sep 30.

Diffusion-weighted breast MRI: Clinical applications and emerging techniques

Affiliations
Review

Diffusion-weighted breast MRI: Clinical applications and emerging techniques

Savannah C Partridge et al. J Magn Reson Imaging. 2017 Feb.

Abstract

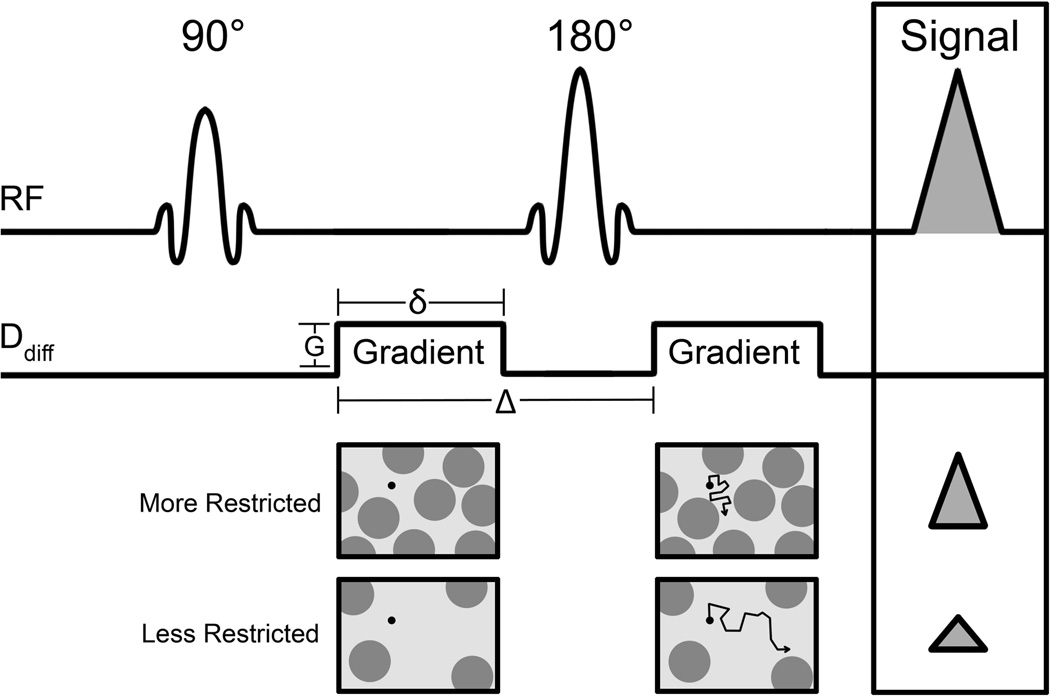
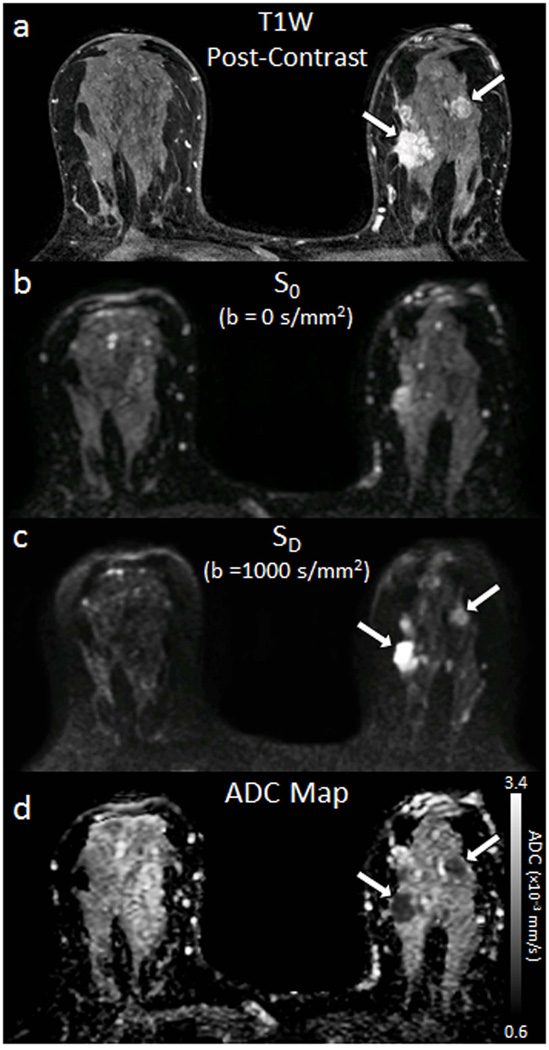
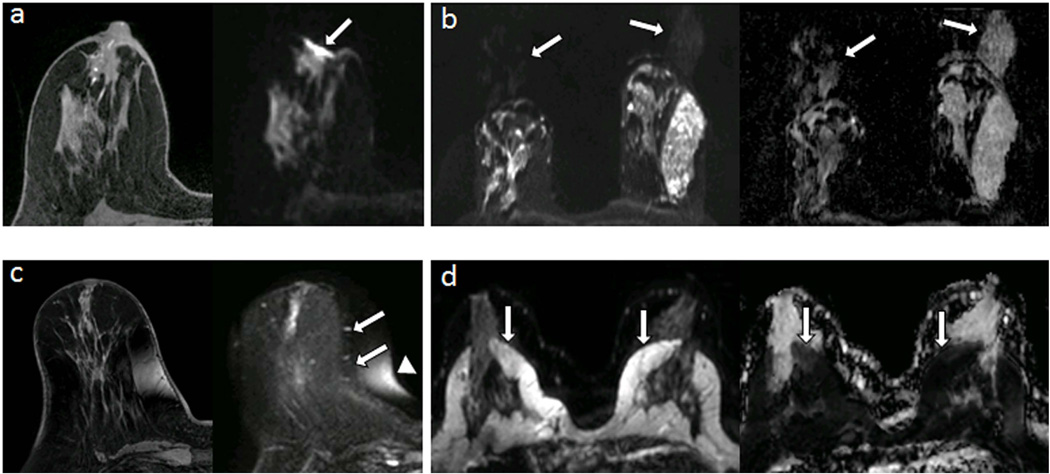
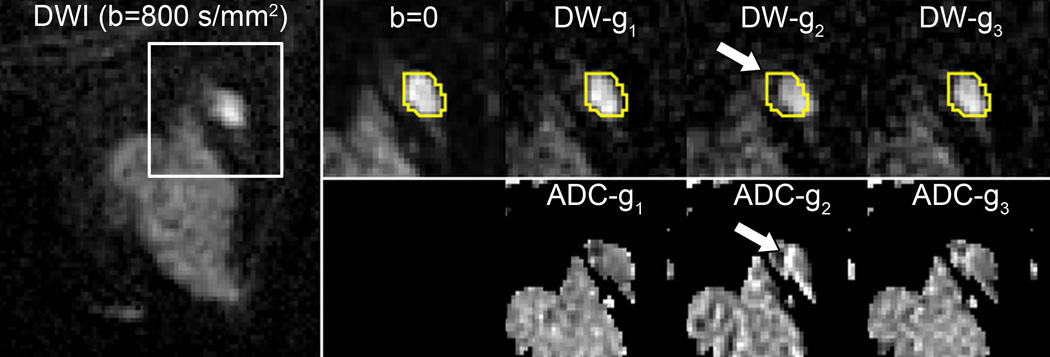
Diffusion-weighted MRI (DWI) holds potential to improve the detection and biological characterization of breast cancer. DWI is increasingly being incorporated into breast MRI protocols to address some of the shortcomings of routine clinical breast MRI. Potential benefits include improved differentiation of benign and malignant breast lesions, assessment and prediction of therapeutic efficacy, and noncontrast detection of breast cancer. The breast presents a unique imaging environment with significant physiologic and inter-subject variations, as well as specific challenges to achieving reliable high quality diffusion-weighted MR images. Technical innovations are helping to overcome many of the image quality issues that have limited widespread use of DWI for breast imaging. Advanced modeling approaches to further characterize tissue perfusion, complexity, and glandular organization may expand knowledge and yield improved diagnostic tools.

Level of evidence: 5 J. Magn. Reson. Imaging 2016 J. Magn. Reson. Imaging 2017;45:337-355.

Keywords: breast DWI artifacts; breast cancer diagnostics; breast diffusion-weighted MRI; breast physiology; diffusion tensor imaging; intravoxel incoherent motion.


Figures

Figure 1
Figure 1
Pulse-sequence diagram of a diffusion-weighted spin-echo sequence based on a Stejskal-Tanner encoding scheme. Two precisely matched diffusion-sensitizing gradients are inserted before and after a 180° radiofrequency refocusing pulse. Important factors defining the degree of diffusion sensitization (‘b value’) are the gradient amplitude (G), duration (δ), and the time between the two sensitizing gradients (Δ). The resulting signal is reduced in proportion to the water mobility, with less restricted environments exhibiting larger decreases in signal.
Figure 2
Figure 2
Example breast images obtained with DWI. Shown are corresponding slices from (a) DCE post-contrast image as reference (b) S0 with b = 0 s/mm2 (primarily T2-weighted), (c) SD with b = 1000 s/mm2, (d) apparent diffusion coefficient (ADC) map. Invasive tumors (arrows) exhibit reduced diffusivity on DW imaging, appearing hyperintense on SD image (c) and hypointense on the ADC map (d).
Figure 3
Figure 3
Common artifacts of breast DWI, illustrated in separate subjects. (a) Magnetic susceptibility artifact (arrow) causing distortion at air/tissue skin surface on DWI (right) compared with undistorted T1-weighted image (left). (b) Nyquist ghost artifact, appearing at N/4 due to parallel imaging undersampling, duplicating signal from the parenchyma on DWI (left) and resulting ADC map (right). (c) Spatial distortion (arrows) and chemical shift artifact (arrowhead) of DWI due to poor shimming compared with undistorted T1-weighted image (left) (d) Detrimental chemical shift artifacts on DWI (left, arrows) due to poor fat suppression, causing artifactual reductions of ADC within the breast parenchyma (right, arrows).
Figure 4
Figure 4
Spatial misregistration between images within a DWI sequence owing to motion and/or eddy-current artifacts. A breast lesion is visible in the lateral breast on the averaged DW image (b=800 s/mm2, left). White box shows region of magnification. A contour of the lesion defined on b=0 and propagated to the individual gradient direction DW images for the same slice shows the lesion is shifted (arrow) in the DW-g2 image (obtained with diffusion gradients applied in the g2 direction) with respect to the b = 0 s/mm2 image and other b = 800 s/mm2 images (obtained with gradients in the orthogonal g1 and g3 directions), owing to eddy-current effects. This misalignment causes an artifactual increase in ADC at the edge of the lesion on the corresponding ADC map (below).
Figure 5
Figure 5
Examples of different breast lesion pathologies shown on DCE and DWI. Each exhibits hyperintensity on DWI (arrows). (a) 32-mm invasive ductal carcinoma (mean ADC = 1.24 ×10⁻³ mm2/s). (b) 34-mm ductal carcinoma in situ (mean ADC = 1.42 ×10⁻³ mm2/s). (c) 8-mm fibroadenoma (mean ADC = 1.91 ×10⁻³mm2/s). (d) simple cyst (mean ADC = 2.23 ×10⁻³ mm2/s).
Figure 6
Figure 6
Axillary metastasis. A 31-year-old woman underwent staging MR imaging after newly diagnosed invasive ductal carcinoma in the left breast. Multiple abnormal level 1 axillary lymph nodes with biopsy proven axillary node metastasis are present in the left axilla, seen as enhancement on the post-contrast T1-weighted image and as hyperintense on the DW (b = 1000 s/mm2) image due to restricted diffusion. The ADC map demonstrates corresponding low values, with ADC = 0.83 ×10⁻³ mm2/s and ADC = 1.17 ×10⁻³ mm2/s for the anterior and posterior nodes, respectively (arrows).
Figure 7
Figure 7
Serial DWI tumor measures in a 32-year-old woman undergoing chemotherapy for invasive ductal carcinoma. DCE MR images (left) are shown for reference, along with DW (b= 1000 s/mm2) images (middle) and ADC maps (right) for the corresponding location. (a) Pretreatment, the tumor region exhibits restricted diffusion, with hypointensity on the ADC map (arrow) and mean ADC = 1.01 ×10⁻³ mm2/s. (b) Mid-treatment after 2 months (4 cycles) of chemotherapy, the tumor region has decreased in size on DCE and increased in ADC (mean ADC = 1.63 ×10⁻³ mm2/s) suggesting effective treatment. The subject showed a complete pathologic response at the end of neoadjuvant therapy.
Figure 8
Figure 8
58-year-old women with dense breasts and mammographically occult invasive ductal carcinoma. Patient underwent high-risk screening MRI because of a strong family history of breast cancer. Shown are (a,b) negative x-ray mammogram (a) cranio-caudal and (b) mediolateral oblique views; DCE (c) maximum intensity projection and (d) T1-weighted dynamic contrast-enhanced MR image, showing an enhancing 8-mm mass (arrow); (e) axial DW image (b value = 800 s/mm2) showing hyperintensity (arrow), and (f) apparent diffusion coefficient (ADC) map showing low diffusivity of lesion (arrow) (mean ADC = 1.45 ×10⁻³ mm2/s). (Adapted from McDonald ES, Hammersley JA, Chou SS, et al. Performance of DWI as a Rapid Unenhanced Technique for Detecting Mammographically Occult Breast Cancer in Elevated-Risk Women With Dense Breasts. AJR 2016;207:1–12; with permission.)
Figure 9
Figure 9
Comparison of readout-segmented and single-shot EPI breast DWI images in 37-year-old woman with breast cancer (invasive ductal carcinoma, grade 3). (a) Contrast-enhanced T1-weighted MR image, (b) T2-weighted short inversion time inversion recovery image, and DW images with b = 850 sec/mm2 obtained with (c) single-shot echo-planar imaging, and (d) readout-segmented echo-planar imaging. Significantly stronger geometric distortion artifacts can be seen on (c) single-shot echo-planar image compared with (d) readout-segmented echo-planar image and (b) distortion-free reference STIR image. (d) Readout-segmented echo-planar image also provides significantly higher anatomic detail than (c) single-shot echo-planar image because of reduced T2* blurring. Arrow = malignant lesion. (Adapted from Bogner W, Pinker-Domenig K, Bickel H, et al. Readout-segmented echo-planar imaging improves the diagnostic performance of diffusion-weighted MR breast examinations at 3.0 T. Radiology. 2012;263(1):64–76; with permission.)
Figure 10
Figure 10
Reduced field of view (rFOV) diffusion-weighted imaging in a patient with locally advanced breast cancer. Shown are rFOV (a) T2-weighted (T2w) b = 0 image, (b) diffusion-weighted (DW) b=600 s/mm2 image, and (c) ADC map compared to standard-FOV (d) T2w b=0 image, (e) DW b=600 s/mm2 image, and ADC map. The rFOV images provide improved depiction of morphologic detail, intra-tumor heterogeneity, and lesion conspicuity. Arrows = malignant lesion. (Adapted from Singer L, Wilmes L, Saritas E, et al. High-Resolution Diffusion-Weighted Magnetic Resonance Imaging in Patients with Locally Advanced Breast Cancer. Acad Radiol. 2012; 19(5): 526–534; with permission.)
Figure 11
Figure 11
Example breast DTI analysis. Images and parametric maps of a 57-year-old patient with two lesions of high grade DCIS. T2-weighted, DCE-derived three-time-point (3TP) images and DTI-derived parametric maps of λ1, ADC, λ1- λ3 and FA. λ1, ADC and λ13 are in units of 10−3 (mm2/s) and presented using a parametric threshold. Corresponding λ1 vector map depicts direction of maximal diffusivity for each voxel.
Figure 12
Figure 12
Summary of lesion measures in multiple breast DTI studies. Plots show mean diffusivity (MD) and fractional anisotropy (FA) values for FGT, benign, and malignant breast tissue across multiple studies. Parameters from showing significant differences between FGT and malignant (†), FGT and benign (‡), and benign and malignant (*) tissue are indicated. MD plot indicates differences between FGT values from patients (‘+’ square) than those from controls (open square). **Values shown for Wiederer study are weighted averages of reported ‘low’ and ‘high’ metrics based on provided values and volume fractions.
Figure 13
Figure 13
Intravoxel incoherent motion (IVIM) MRI of an invasive lobular carcinoma (ILC) lesion. (a) Post contrast T1-weighted image, providing background for overlaid (b) apparent diffusion coefficient (ADC), (b) perfusion fraction (fp), (c) pseudodiffusivity (Dp), and tissue diffusivity (Dt) parametric maps. Full lesion volume histograms for each parameter are shown under the corresponding panels. The lesion shows high central cell density (low ADC, Dt) and high peripheral vascularity (high fp), in agreement with the appearance in T1 post-contrast imaging (a).
Figure 14
Figure 14
Summary of lesion measures in multiple breast IVIM studies. Plots show tissue diffusivity (Dt) and perfusion fraction (fp) values for FGT, benign, and malignant breast tissue across multiple studies. Parameters from showing significant differences between FGT and malignant (†), FGT and benign (‡), and benign and malignant (*) tissue are indicated.
Figure 15
Figure 15
Example breast IVIM/DKI analysis. Images and parametric maps in two patients with breast lesions. Upper row: Fibroadenoma in a 34-year-old woman. (a) Dynamic contrast-enhanced image shows weak and heterogeneous enhancement in the lesion (white box, area covered by parametric maps). (b) The f map shows very low perfusion in the lesion center, with slightly higher values visible in the left bottom and the upper parts. (c) The ADC0map shows high and homogeneous values throughout the lesion center, while the K map (d) shows very low values in the center. Such a high ADC0/low K pattern highly suggests the presence of a free-diffusion tissue component. Lower row: Invasive ductal carcinoma in a 74-year-old woman. (a) Dynamic contrast-enhanced image shows strong and heterogeneous enhancement in the lesion (white box, area covered by parametric maps). (b) High f values are observed in the peripheral area of the tumor. (c) The ADC0 values are low in the lesion, reflecting high tumor cellularity. In contrast, the K map (d) shows very high values, suggesting some diffusion hindrance effect (possibly from cellular membrane) of the lesion. (Courtesy of Mami Iima, MD, PhD, and Masako Kataoka, MD, PhD, Department of Diagnostic Imaging and Nuclear Medicine, Graduate School of Medicine, Kyoto University, Japan.)

References

    1. Partridge SC, McDonald ES. Diffusion weighted magnetic resonance imaging of the breast: protocol optimization, interpretation, and clinical applications. Magn Reson Imaging Clin N Am. 2013;21(3):601–624. PubMed PMID: 23928248; PubMed Central PMCID: PMC3740446. - PMC - PubMed
    1. Stejskal EOTJ. Spin diffusion measurements:spin echoes in the presence of a time-dependent field gradient. J Chem Phys. 1965;(42):288–292.
    1. Le Bihan D, Breton E, Lallemand D, Grenier P, Cabanis E, Laval-Jeantet M. MR imaging of intravoxel incoherent motions: application to diffusion and perfusion in neurologic disorders. Radiology. 1986;161(2):401–407. Epub 1986/11/01. PubMed PMID: 3763909. - PubMed
    1. Le Bihan D, Breton E, Lallemand D, Aubin ML, Vignaud J, Laval-Jeantet M. Separation of diffusion and perfusion in intravoxel incoherent motion MR imaging. Radiology. 1988;168(2):497–505. PubMed PMID: 3393671. - PubMed
    1. Guo Y, Cai YQ, Cai ZL, Gao YG, An NY, Ma L, et al. Differentiation of clinically benign and malignant breast lesions using diffusion-weighted imaging. J Magn Reson Imaging. 2002;16(2):172–178. PubMed PMID: 12203765. - PubMed

Publication types

MeSH terms