Meta-Analysis
. 2016 Sep 28;8(9):1844-1865.
doi: 10.18632/aging.101020.

DNA methylation-based measures of biological age: meta-analysis predicting time to death

Brian H Chen  1   2   3 Riccardo E Marioni  4   5   6 Elena Colicino  7 Marjolein J Peters  8 Cavin K Ward-Caviness  9 Pei-Chien Tsai  10 Nicholas S Roetker  11 Allan C Just  7 Ellen W Demerath  11 Weihua Guan  12 Jan Bressler  13 Myriam Fornage  13   14 Stephanie Studenski  1 Amy R Vandiver  15 Ann Zenobia Moore  1 Toshiko Tanaka  1 Douglas P Kiel  16   17 Liming Liang  18   19 Pantel Vokonas  18 Joel Schwartz  18 Kathryn L Lunetta  2   20 Joanne M Murabito  2   21 Stefania Bandinelli  22 Dena G Hernandez  23 David Melzer  24 Michael Nalls  23 Luke C Pilling  24 Timothy R Price  23 Andrew B Singleton  23 Christian Gieger  9   25 Rolf Holle  26 Anja Kretschmer  9   25 Florian Kronenberg  27 Sonja Kunze  9   25 Jakob Linseisen  9 Christine Meisinger  9 Wolfgang Rathmann  28 Melanie Waldenberger  9   25 Peter M Visscher  4   6   29 Sonia Shah  6   29 Naomi R Wray  6 Allan F McRae  6   29 Oscar H Franco  30 Albert Hofman  18   30 André G Uitterlinden  8   30 Devin Absher  31 Themistocles Assimes  32 Morgan E Levine  33 Ake T Lu  33 Philip S Tsao  32   34 Lifang Hou  35   36 JoAnn E Manson  37 Cara L Carty  38 Andrea Z LaCroix  39 Alexander P Reiner  40   41 Tim D Spector  10 Andrew P Feinberg  15   3 Daniel Levy  2   42 Andrea Baccarelli  7   43 Joyce van Meurs  8 Jordana T Bell  10 Annette Peters  9 Ian J Deary  4   44 James S Pankow  11 Luigi Ferrucci  1 Steve Horvath  33   44
Affiliations
Meta-Analysis

DNA methylation-based measures of biological age: meta-analysis predicting time to death

Brian H Chen et al. Aging (Albany NY). .

Abstract

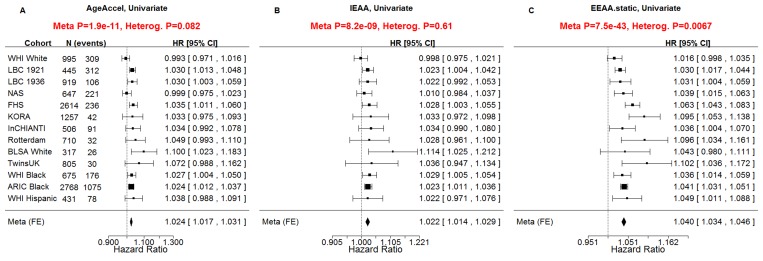
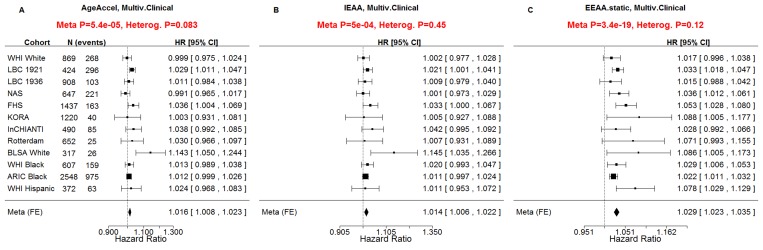
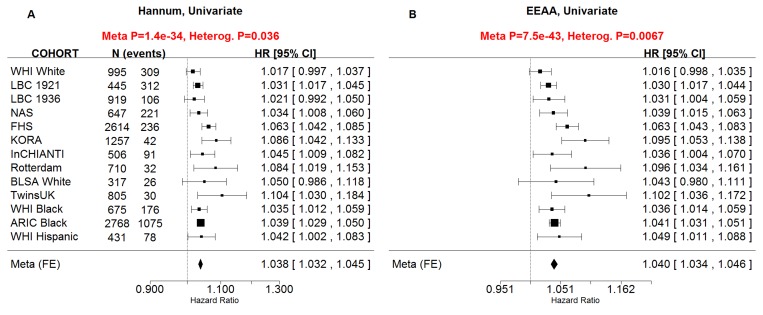
Estimates of biological age based on DNA methylation patterns, often referred to as "epigenetic age", "DNAm age", have been shown to be robust biomarkers of age in humans. We previously demonstrated that independent of chronological age, epigenetic age assessed in blood predicted all-cause mortality in four human cohorts. Here, we expanded our original observation to 13 different cohorts for a total sample size of 13,089 individuals, including three racial/ethnic groups. In addition, we examined whether incorporating information on blood cell composition into the epigenetic age metrics improves their predictive power for mortality. All considered measures of epigenetic age acceleration were predictive of mortality (p≤8.2x10⁻⁹), independent of chronological age, even after adjusting for additional risk factors (p<5.4x10⁻⁴), and within the racial/ethnic groups that we examined (non-Hispanic whites, Hispanics, African Americans). Epigenetic age estimates that incorporated information on blood cell composition led to the smallest p-values for time to death (p=7.5x10-43). Overall, this study a) strengthens the evidence that epigenetic age predicts all-cause mortality above and beyond chronological age and traditional risk factors, and b) demonstrates that epigenetic age estimates that incorporate information on blood cell counts lead to highly significant associations with all-cause mortality.

Keywords: DNA methylation; all-cause mortality; epigenetic clock; epigenetics; lifespan; mortality.


Conflict of interest statement

The Regents of the University of California is the sole owner of a provisional patent application directed at the invention of measures of epigenetic age acceleration for which SH is a named inventor. The other authors declare no conflicts of interest.

Figures

Figure 1
Figure 1. Epigenetic age acceleration in blood versus that in breast or saliva
(A-D) Epigenetic age acceleration in healthy female breast tissue (y-axis) versus various measures of epigenetic age acceleration in blood: (A) universal measure of age acceleration in blood, (B) intrinsic epigenetic age acceleration based on the Horvath estimate of epigenetic age, (C) extrinsic epigenetic age acceleration, (D) intrinsic epigenetic age acceleration based on the Hannum estimate of epigenetic age. (E-H) analogous plots for epigenetic age acceleration in saliva (y-axis) and (E) AgeAccel, (F) IEAA based on Horvath, (G) EEAA, (H) IEAA based on the Hannum estimate. The y-axis of each plot represents the universal measure of age acceleration defined as the raw residual resulting from regressing epigenetic age (based on Horvath) on chronological age.
Figure 2
Figure 2. Univariate Cox regression meta-analysis of all-cause mortality
A univariate Cox regression model was used to relate the censored survival time (time to all-cause mortality) to (A) the universal measure of age acceleration (AgeAccel), (B) intrinsic epigenetic age acceleration (IEAA), (C) extrinsic epigenetic age acceleration (EEAA). The rows correspond to the different cohorts. Each row depicts the hazard ratio and a 95% confidence interval. The coefficient estimates from the respective studies were meta-analyzed using a fixed-effect model weighted by inverse variance (implemented in the metafor R package [34]). It is not appropriate to compare the hazard ratios and confidence intervals of the different measures directly because the measures have different scales/distributions. However, it is appropriate to compare the meta analysis p values (red sub-title of each plot). The p-value of the heterogeneity test (Cochran's Q-test) is significant if the cohort-specific estimates differed substantially.
Figure 3
Figure 3. Multivariate Cox regression meta-analysis adjusted for clinical covariates
A multivariate Cox regression model was used to relate the censored survival time (time to all-cause mortality) to (A) the universal measure of age acceleration (AgeAccel), (B) intrinsic epigenetic age acceleration (IEAA), (C) extrinsic epigenetic age acceleration (EEAA). The multivariate Cox regression model included the following additional covariates: chronological age, body mass index (category), educational level (category), alcohol intake, smoking pack years, prior history of diabetes, prior history of cancer, hypertension status, recreational physical activity (category). The rows correspond to the different cohorts. Each row depicts the hazard ratio and a 95% confidence interval. The coefficient estimates from the respective studies were meta-analyzed using a fixed-effect model weighted by inverse variance (implemented in the metafor R package [34]). The sub-title of each plot reports the meta-analysis p-value and a heterogeneity test p-value (Cochran's Q-test).
Figure 4
Figure 4. Hazard ratio of death versus cohort characteristics
Each circle corresponds to a cohort (data set). Circle sizes correspond to the square root of the number of observed deaths, because the statistical power of a Cox model is determined by the number of observed deaths. (A-C) The y-axis of each panel corresponds to the natural log of the hazard ratio (ln HR) of a univariate Cox regression model for all-cause mortality. Each panel corresponds to a different measure of epigenetic age acceleration (A) universal age acceleration, (B) intrinsic age acceleration, (C) extrinsic age acceleration. Panels (D-F) are analogous to those in A-C but the x-axis corresponds to the median age of the subjects at baseline (Table 1). The title of each panel reports the Wald test statistic (T) and corresponding p-value resulting from a weighted linear regression model (y regressed on x) where each point (data set) is weighted by the square root of the number of observed deaths. The dotted red line represents the regression line. The black solid line represents the line of identify (i.e., no association).

Similar articles

Cited by

References

    1. Bocklandt S, Lin W, Sehl ME, Sánchez FJ, Sinsheimer JS, Horvath S, Vilain E. Epigenetic predictor of age. PLoS One. 2011;6:e14821. doi: 10.1371/journal.pone.0014821. - DOI - PMC - PubMed
    1. Hannum G, Guinney J, Zhao L, Zhang L, Hughes G, Sadda S, Klotzle B, Bibikova M, Fan JB, Gao Y, Deconde R, Chen M, Rajapakse I, et al. Genome-wide methylation profiles reveal quantitative views of human aging rates. Mol Cell. 2013;49:359–67. doi: 10.1016/j.molcel.2012.10.016. - DOI - PMC - PubMed
    1. Horvath S. DNA methylation age of human tissues and cell types. Genome Biol. 2013;14:R115. doi: 10.1186/gb-2013-14-10-r115. - DOI - PMC - PubMed
    1. Lin Q, Weidner CI, Costa IG, Marioni RE, Ferreira MR, Deary IJ, Wagner W. DNA methylation levels at individual age-associated CpG sites can be indicative for life expectancy. Aging (Albany NY) 2016;8:394–401. doi: 10.18632/aging.100908. - DOI - PMC - PubMed
    1. Marioni RE, Shah S, McRae AF, Chen BH, Colicino E, Harris SE, Gibson J, Henders AK, Redmond P, Cox SR, Pattie A, Corley J, Murphy L, et al. DNA methylation age of blood predicts all-cause mortality in later life. Genome Biol. 2015;16:25. doi: 10.1186/s13059-015-0584-6. - DOI - PMC - PubMed

Publication types

Grants and funding