Review
. 2017 Jan;109(1):24-38.
doi: 10.1111/boc.201600044. Epub 2016 Nov 14.

Mesoscale imaging with cryo-light and X-rays: Larger than molecular machines, smaller than a cell

Affiliations
Review

Mesoscale imaging with cryo-light and X-rays: Larger than molecular machines, smaller than a cell

Axel A Ekman et al. Biol Cell. 2017 Jan.

Abstract

In the context of cell biology, the term mesoscale describes length scales ranging from that of an individual cell, down to the size of the molecular machines. In this spatial regime, small building blocks self-organise to form large, functional structures. A comprehensive set of rules governing mesoscale self-organisation has not been established, making the prediction of many cell behaviours difficult, if not impossible. Our knowledge of mesoscale biology comes from experimental data, in particular, imaging. Here, we explore the application of soft X-ray tomography (SXT) to imaging the mesoscale, and describe the structural insights this technology can generate. We also discuss how SXT imaging is complemented by the addition of correlative fluorescence data measured from the same cell. This combination of two discrete imaging modalities produces a 3D view of the cell that blends high-resolution structural information with precise molecular localisation data.

Keywords: Correlated imaging; Cryogenic; Fluorescence; Soft X-ray; Tomography.


Conflict of interest statement

statement The authors have declared no conflict of interest.

Figures
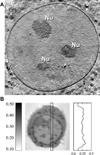
Figure 1
Figure 1. SXT imaging and resolution
(A) An overview of a nucleus containing three nucleoli (Nu) showing the clarity with which the nuclear membrane can be visualized using a 25nm zone plate objective. Image taken from (Muller et al. 2012). (B) An orthoslice from a SXT reconstruction of a B-cell (center) and a representative profile of the variation of LAC within a cell (right). Dark features in the image correspond with structures containing higher concentration of carbon and thus have higher LAC values. LAC values are in units of µm−1.
Figure 2
Figure 2. SXT of a fibrosarcoma cell
(A) An orthoslice through a SXT reconstruction of a HT1080 fibrosarcoma cell. (Nu, Nucleus; >, Lipid; *, Mitochondria). Image is comprised of tomographic reconstructions from two adjacent fields computationally stitched together. (B) 3D volume rendering based on organelles’ linear absorption coefficient (LAC) and morphology. Red: Nucleus, Turquoise: Mitochondria, Blue: Lipids, Gray: cell membrane. Scale bar = 1.5 µm.
Figure 3
Figure 3. Recent example of correlated CFT-SXT
Taken from Elgass et al. (2015) (A) (a) Fluorescence confocal slice, (b) virtual section of the SXT-generated reconstruction and (c) correlative CFT–SXT overlay are shown at four different planes, or virtual sections, within the cell volume. (d) The rightmost panels show magnifications of the boxed areas in c, which indicate ER–mitochondria contact sites that overlap with MiD51–GFP fluorescence foci (white arrowheads). Scale bars: 2 µm (a–c). (B) (a) Two-dimensional computer-generated slice from a reconstruction of a mouse lymphoblastoid cell expressing MiD51–GFP (green), generated using correlated CFT–SXT. (b) The same computer-generated slice from the SXT reconstruction as presented in a without fluorescence overlay. The orange rectangle outlines the area of concentrated MiD51–GFP fluorescence. (c) Magnification of the area shown in a and b containing a concentration of MiD51–GFP. White arrowheads indicate positions of ER–mitochondria contact sites. (d) Maximum intensity projection of the full 3D SXT reconstruction with the contrast reversed so that features that are low-absorbing are shaded black and features that are highly absorbent are shaded white. (e) ER (green) and mitochondria (red) segmented out and overlaid with the reconstruction. (f) Surface-rendering of segmented cellular features, including the nucleus (orange), lipid droplets (blue), ER (green) and mitochondria (red). (g) Three-dimensional cutaway of the SXT-generated reconstruction reveals the same 3D location of the MiD51–GFP fluorescence of that shown in a. (h) Detailed view of small ER extensions contacting the mitochondria at the MiD51 foci. Scale bars: 2 µm (a, b, d–f); 400 nm (c); 1 µm (h).
Figure 4
Figure 4. A comprehensive view of the mesoscale
Image taken from Johnson et al. (2015) shows the potential end-result of merging various types of data with a SXT mesoscale reconstruction of a cell.

References

    1. Al-Amoudi A, Dubochet J, Gnaegi H, Luthi W, Studer D. An oscillating cryo-knife reduces cutting-induced deformation of vitreous ultrathin sections. J. Microsc. 2003;212:26–33. - PubMed
    1. Al-Amoudi A, Norlen LPO, Dubochet J. Cryo-electron microscopy of vitreous sections of native biological cells and tissues. J. Struct. Biol. 2004;148:131–135. - PubMed
    1. Alivisatos AP, Gu WW, Larabell C. Quantum dots as cellular probes. Annu. Rev. Biomed. Eng. 2005;7:55–76. - PubMed
    1. Ashcroft JM, Gu W, Zhang T, Hughes SM, Hartman KB, Hofmann C, Kanaras AG, Kilcoyne DA, Le Gros M, Yin Y, Alivisatos AP, Larabell CA. TiO2 nanoparticles as a soft X-ray molecular probe. Chem. Commun. (Camb.) 2008;21:2471–2473. - PMC - PubMed
    1. Attwood DT. Soft X-Rays and Extreme Ultraviolet Radiation: Principles and Applications. Cambridge, New York: Cambridge University Press; 1999.