. 2016 Sep 30;11(9):e0163233.
doi: 10.1371/journal.pone.0163233. eCollection 2016.

Central Nervous System Injury - A Newly Observed Bystander Effect of Radiation

Affiliations

Central Nervous System Injury - A Newly Observed Bystander Effect of Radiation

Caitlin Feiock et al. PLoS One. .

Abstract

The unintended side effects of cancer treatment are increasing recognized. Among these is a syndrome of long-term neurocognitive dysfunction called cancer/chemotherapy related cognitive impairment. To date, all studies examining the cognitive impact of cancer treatment have emphasized chemotherapy. Radiation-induced bystander effects have been described in cell culture and, to a limited extent, in rodent model systems. The purpose of this study was to examine, for the first time, the impact of non-brain directed radiation therapy on the brain in order to elucidate its potential relationship with cancer/chemotherapy related cognitive impairment. To address this objective, female BALB/c mice received either a single 16 gray fraction of ionizing radiation to the right hind limb or three doses of methotrexate, once per week for three consecutive weeks. Mice were sacrificed either 3 or 30 days post-treatment and brain injury was determined via quantification of activated astrocytes and microglia. To characterize the effects of non-brain directed radiation on brain glucose metabolism, mice were evaluated by fluorodeoxygluocose positron emission tomography. A single fraction of 16 gray radiation resulted in global decreases in brain glucose metabolism, a significant increase in the number of activated astrocytes and microglia, and increased TNF-α expression, all of which lasted up to 30 days post-treatment. This inflammatory response following radiation therapy was statistically indistinguishable from the neuroinflammation observed following methotrexate administration. In conclusion, non-brain directed radiation was sufficient to cause significant brain bystander injury as reflected by multifocal hypometabolism and persistent neuroinflammation. These findings suggest that radiation induces significant brain bystander effects distant from the irradiated cells and tissues. These effects may contribute to the development of cognitive dysfunction in treated human cancer patients and warrant further study.


Conflict of interest statement

The authors have declared that no competing interests exist.

Figures

Fig 1
Fig 1. Summary of Experimental Design.
Green arrows indicate methotrexate (MTX) injection. Blue arrows indicate FDG-PET. Red arrows indicate non-brain directed radiation therapy (NBRT). Sham-treated mice are indicated by CONT. Black arrows indicate sacrifice. Multi-colored arrows indicate multiple procedures occurring within the indicated time frame.
Fig 2
Fig 2. Non-brain directed radiation results in global brain glucose hypometabolism.
(A) FDG-PET region of interest (ROI) selection subdivided the mouse brain into 19 areas. (B). When [18F]FDG uptake was normalized by blood, significant hypometabolism was noted across all areas, * = p < 0.05. Error bars = standard error of the mean. R/LSTR = Right/Left Striatum; CTX = Cortex; R/LHIP = Right/Left Hippocampus; THA = Thalamus; CB = Cerebellum; BFS = Basal forebrain; HYP = Hypothalamus; R/LAMY = Right/Left Amygdala; BS = Brainstem; CG = Cingulum; SC = Superior colliculi; OLF = Olfactory bulb; R/LMID = Right/Left Midbrain; R/LIC = Right/Left Inferior colliculi.
Fig 3
Fig 3. The rostral cortex of NBRT-treated mice reveals early astrocytosis and microgliosis.
In the rostral cortex of mice administered NBRT sacrificed at day 3, increased numbers of GFAP+ astrocytes (C, black arrow) were identified as compared to CONT mice (A, black arrow). No significant differences in astrocyte numbers were noted when MTX mice (E, black arrow) were compared to the NBRT mice (C). Increased numbers of Iba1+ microglia (red, white arrow) (D) were identified in NBRT mice as compared to CONT mice (B, gray arrow). No significant differences were noted when MTX mice (F, white arrow) were compared to the NBRT mice (D, white arrows). In contrast to the small, minimally ramified microglia in the CONT mice (B, gray arrows), the microglia in the NBRT and MTX treated mice demonstrated features consistent with activation (D and F, white arrows).
Fig 4
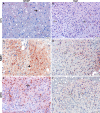
Fig 4. The striatum of NBRT treated mice reveals early astrocytosis and microgliosis.
In the striatum of the mice administered NBRT sacrificed at day 3, increased numbers of GFAP+ astrocytes (C, black arrow) were identified as compared to CONT mice (A, black arrow). No significant differences in astrocytes were noted when MTX mice (E, black arrow) were compared to the NBRT mice. Increased numbers of Iba1+ microglia (D, white arrows) were identified in the NBRT mice as compared to CONT mice (B, gray arrows). No significant differences were noted when MTX mice (F, white arrows) were compared to the NBRT mice (D). In contrast to the small, minimally ramified microglia in the CONT mice (B, gray arrows), the microglia in the NBRT and MTX treated mice demonstrated features consistent with activation (D and F, white arrows).
Fig 5
Fig 5. The cerebellum of NBRT treated mice reveals early astrocytosis and microgliosis.
In the cerebellum of the mice administered NBRT sacrificed at day 3, increased numbers of GFAP+ astrocytes (C, black arrow) were identified as compared to CONT mice (A, black arrow). No significant differences in astrocytes were noted when MTX mice (E, black arrow) were compared to NBRT mice. Increased numbers of Iba1+ microglia (D, white arrows) were identified as compared to CONT mice (B, gray arrows). No significant differences were noted when MTX mice (F, white arrows) were compared to the NBRT mice (D). In contrast to the small, minimally ramified microglia in the CONT mice (B, gray arrows), the microglia in the NBRT and MTX treated mice demonstrated features consistent with activation (D and F, white arrows).
Fig 6
Fig 6. Non-brain directed radiation therapy results in a multifocal, early and persistent astrocytosis and microgliosis.
(A) Log (Average) Number of GFAP+ cells in NBRT (sacrifice days 3 and 30), MTX, and CONT (C) mice. * = p < 0.05, ** = p < 0.01, compared to controls; § = p < 0.05, compared to NBRT Day 30. (B) Log (Average) Number of Iba1+ cells in NBT (sacrifice days 3 and 30), MTX, and CONT (C) mice. * = p < 0.05, ** = p < 0.01, compared to controls; § = p < 0.05, compared to NBRT Day 30.
Fig 7
Fig 7. The hippocampus of NBRT treated mice demonstrates early microgliosis, but not astrocytosis.
In the hippocampus of the mice administered NBRT sacrificed at day 3, there was no statistical difference in the numbers of GFAP+ astrocytes (C, black arrow) as compared to CONT mice (A, black arrow). No significant differences were noted when MTX mice (E, black arrow) were compared to the NBRT mice. Increased numbers of Iba1+ microglia were identified in the NBRT mice (D, white arrows) as compared to CONT mice (B, gray arrows). No significant difference in astrocyte numbers were noted when MTX mice (F, white arrows) were compared to NBRT mice (D). In contrast to the small, minimally ramified microglia in the CONT mice (B, gray arrows), the microglia in the NBRT and MTX treated mice demonstrated features consistent with activation (D and F, white arrows).
Fig 8
Fig 8. The medulla of NBRT treated mice demonstrates early microgliosis, but not astrocytosis.
In the medulla of the mice administered NBRT sacrificed at day 3, there was no statistical difference in the numbers of GFAP+ astrocytes (C, black arrow) as compared to CONT mice (A, black arrow). No significant difference in astrocyte numbers were noted when MTX mice (E, black arrow) were compared to the NBRT mice. Increased numbers of Iba1+ microglia were identified in the NBRT mice (D, white arrows) as compared to CONT mice (B, gray arrows). No significant differences in microglia numbers were noted when MTX mice (F, white arrows) were compared to NBRT mice (D). No appreciable difference in microglia morphology was noted between the CONT (B, gray arrows), NBRT, and MTX mice (D and F, white arrows).
Fig 9
Fig 9. The caudal cortex of NBRT treated mice demonstrates early astrocytosis, but not microgliosis.
In the caudal cortex of the mice administered NBRT sacrificed at day 3, increased numbers of GFAP+ astrocytes (C, black arrow) were identified as compared to CONT mice (A, black arrow). No significant differences in astrocyte numbers were noted when MTX mice (E) were compared to NBRT mice. Similarly not significant differences in Iba1+ microglia (D, white arrows) numbers were identified as compared to CONT mice (B, gray arrow). No significant differences in microglia numbers were noted when MTX mice (F) were compared to the NBRT mice (D). In contrast to the small, minimally ramified microglia in the CONT mice (B, gray arrows), the microglia in the NBRT and MTX treated mice demonstrated features consistent with activation (D and F, white arrows).
Fig 10
Fig 10. The NBRT treated mice demonstrate persistent multifocal astrocytosis.
In NBRT mice sacrificed at day 30, increased numbers of GFAP+ astrocytes were identified in the rostral cortex, caudal cortex, and striatum (A-C, black arrows).
Fig 11
Fig 11. The NBRT treated mice demonstrate persistent multifocal microgliosis.
In NBRT mice sacrificed at day 30, increased numbers of Iba1+ microglia were identified in the cerebellum and medulla (A-B, white arrows).
Fig 12
Fig 12. NBRT and MTX mice demonstrate increased hippocampal TNF-α expression.
Increased TNF-α immunoreactivity (red) was identified in the hippocampus of NBRT (B, black arrows) and MTX (D, black arrows) mice sacrificed at day 3 as compared to CONT (A, black arrow). In contrast, the level of TNF-α immunoreactivity in mice administered NBRT sacrificed at day 30 (C, black arrow) appears similar to CONT (A).

Similar articles

Cited by

References

    1. Janelsins MC, Kesler SR, Ahles TA, Morrow GR (2014) Prevalence, mechanisms, and management of cancer-related cognitive impairment. Int Rev Psychiatry 26: 102–113. 10.3109/09540261.2013.864260 - DOI - PMC - PubMed
    1. Vardy J, Wefel JS, Ahles T, Tannock IF, Schagen SB (2008) Cancer and cancer-therapy related cognitive dysfunction: an international perspective from the Venice cognitive workshop. Ann Oncol 19: 623–629. 10.1093/annonc/mdm500 - DOI - PubMed
    1. Seigers R, Timmermans J, van der Horn HJ, de Vries EF, Dierckx RA, et al. (2010) Methotrexate reduces hippocampal blood vessel density and activates microglia in rats but does not elevate central cytokine release. Behav Brain Res 207: 265–272. 10.1016/j.bbr.2009.10.009 - DOI - PubMed
    1. Fardell JE, Zhang J, De Souza R, Vardy J, Johnston I, et al. (2014) The impact of sustained and intermittent docetaxel chemotherapy regimens on cognition and neural morphology in healthy mice. Psychopharmacology (Berl) 231: 841–852. 10.1007/s00213-013-3301-8 - DOI - PubMed
    1. Dubois M, Lapinte N, Villier V, Lecointre C, Roy V, et al. (2014) Chemotherapy-induced long-term alteration of executive functions and hippocampal cell proliferation: role of glucose as adjuvant. Neuropharmacology 79: 234–248. 10.1016/j.neuropharm.2013.11.012 - DOI - PubMed

LinkOut - more resources