. 2016 Nov;28(4pt2):1347-1365.
doi: 10.1017/S0954579416000894. Epub 2016 Oct 3.

Resilience to adversity and the early origins of disease

Affiliations

Resilience to adversity and the early origins of disease

Gene H Brody et al. Dev Psychopathol. 2016 Nov.

Abstract

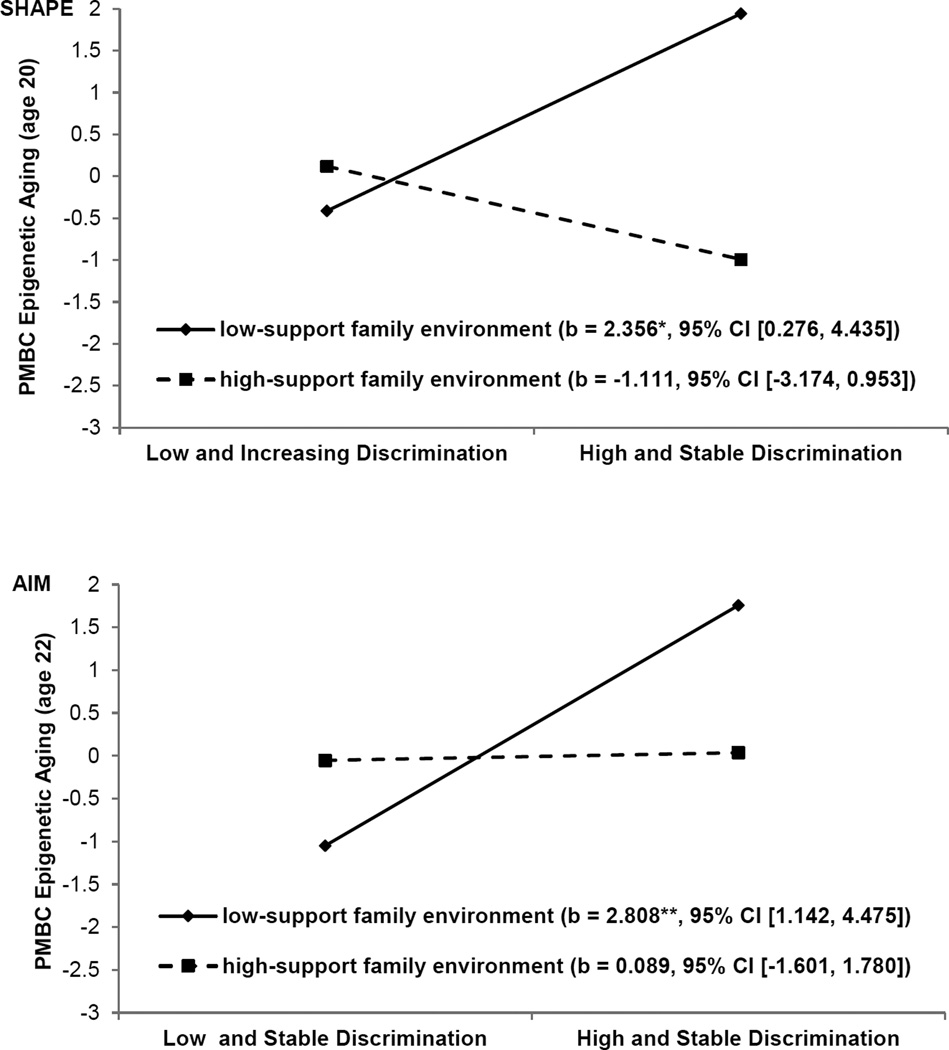
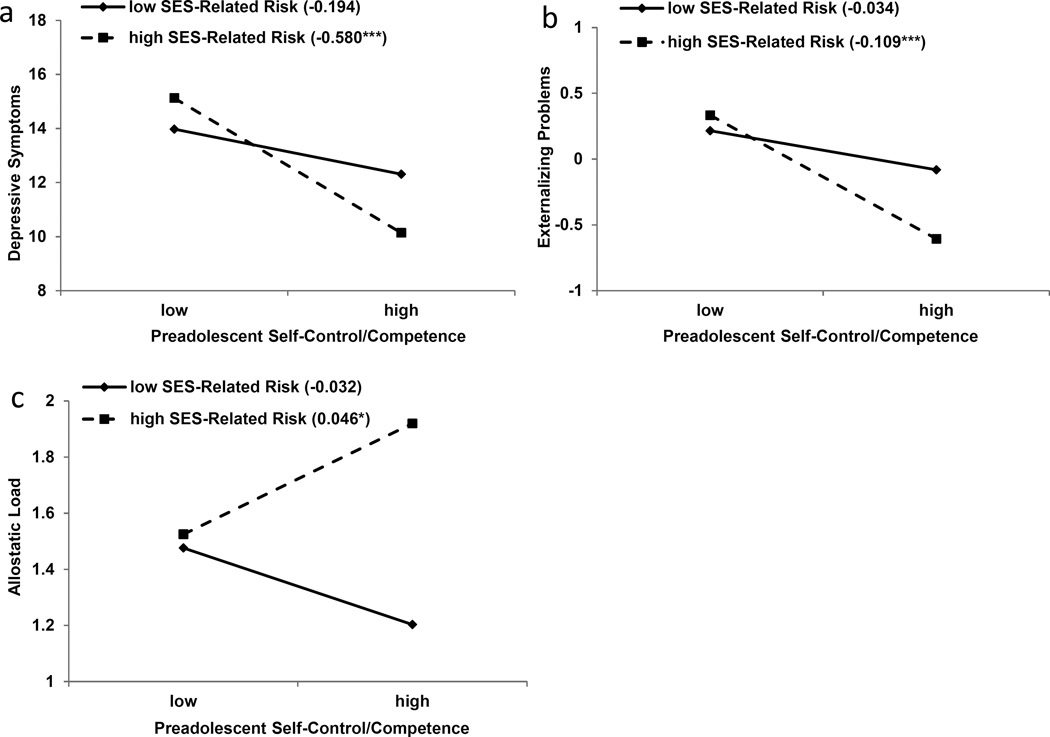
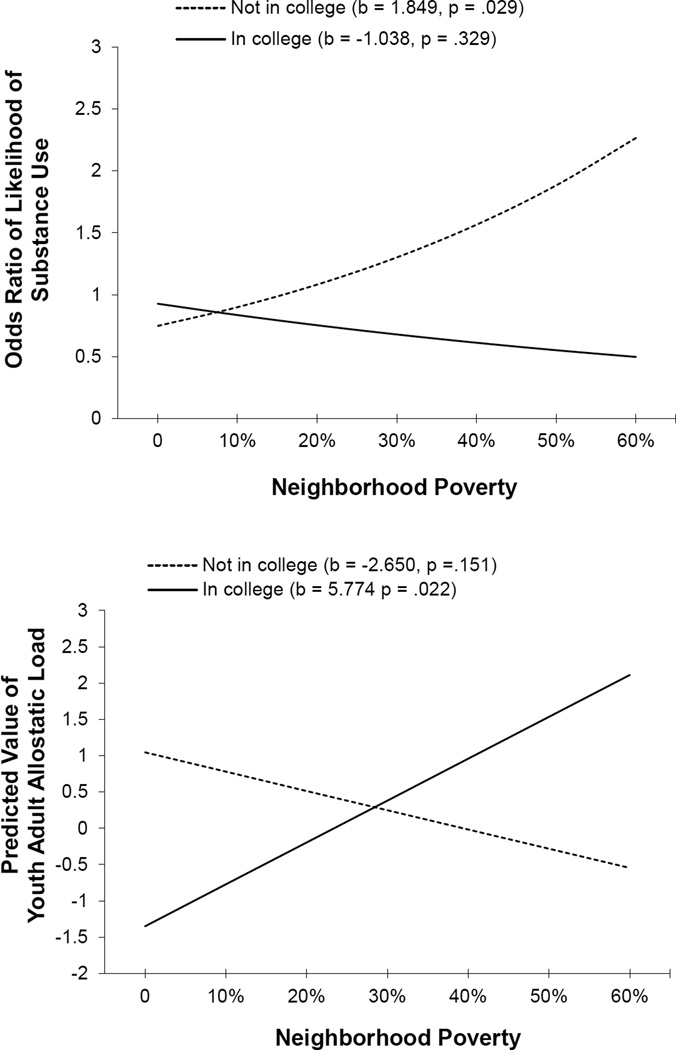
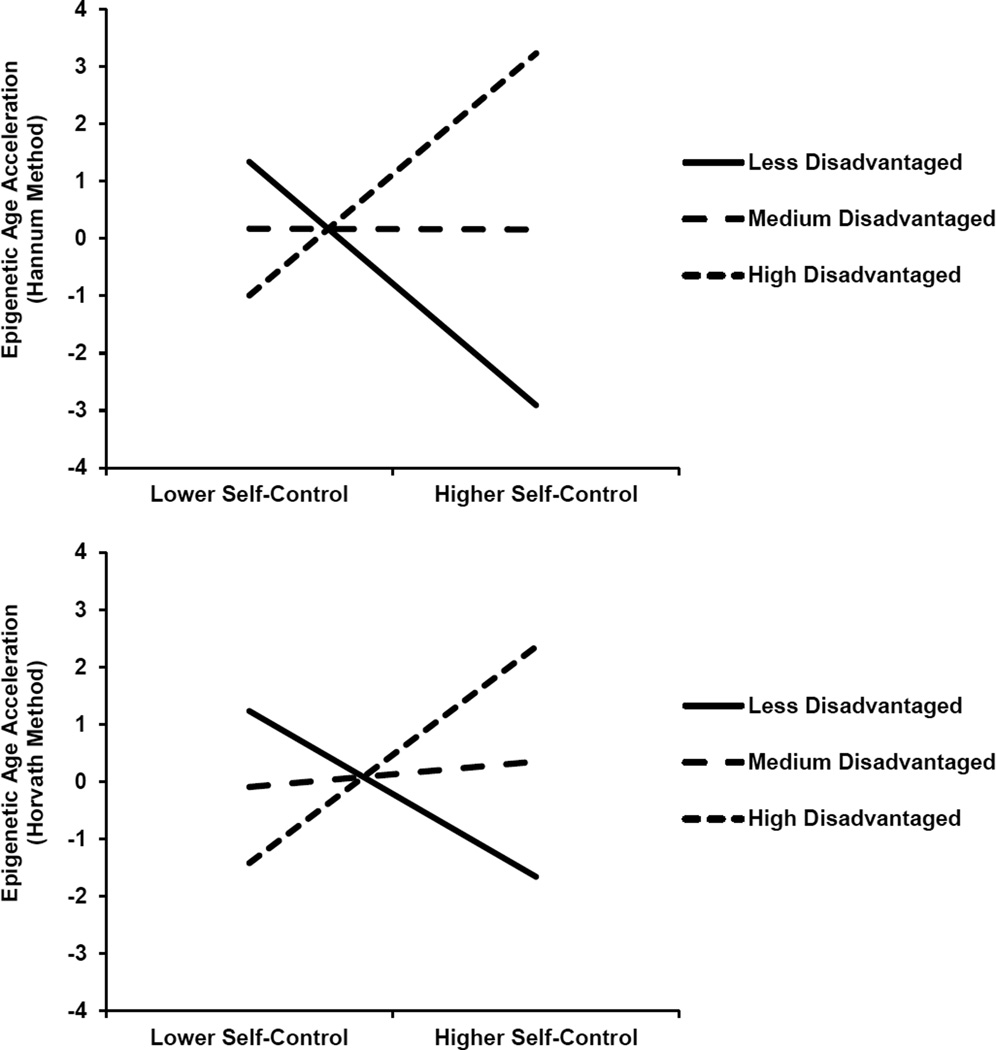
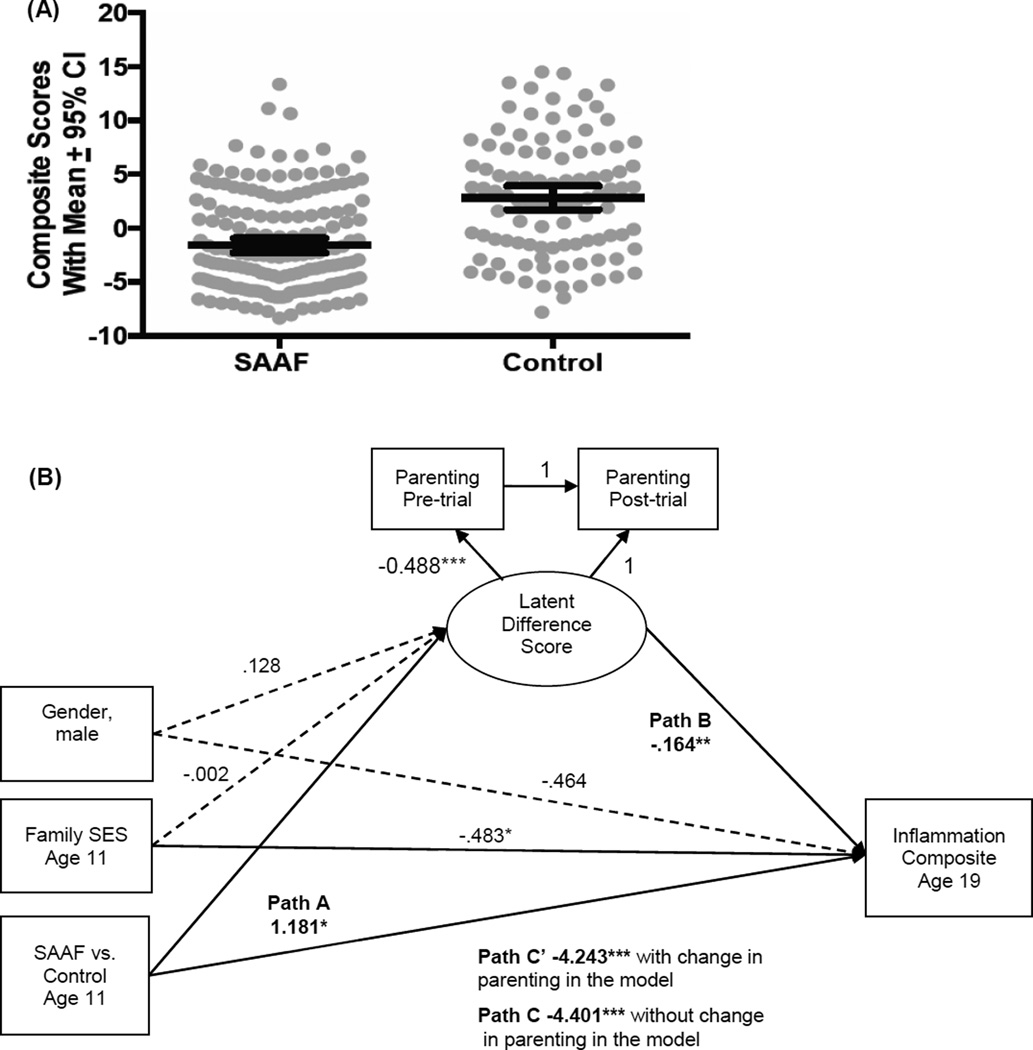
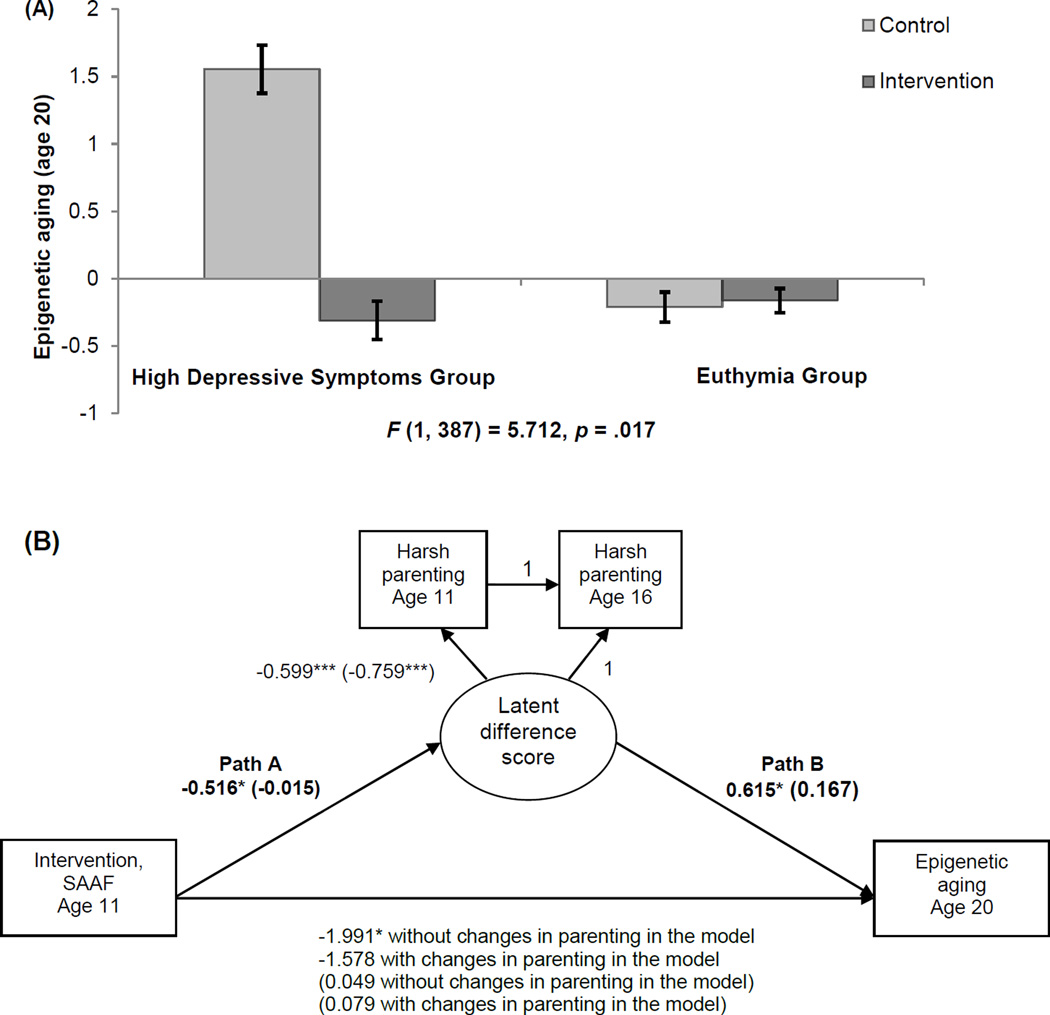
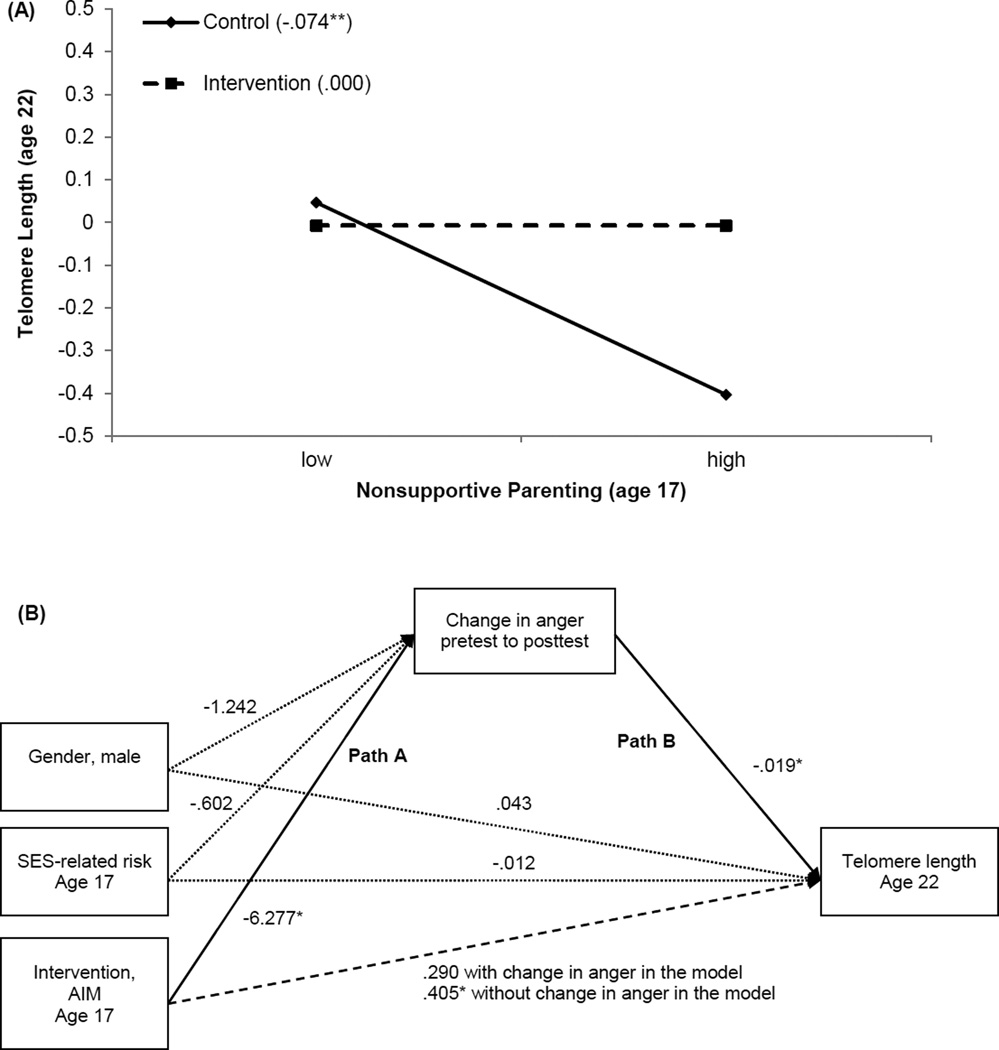
For the past quarter century, scientists at the Center for Family Research at the University of Georgia have conducted research designed to promote understanding of normative developmental trajectories among low socioeconomic status African American children, youths, and young adults. In this paper, we describe a recent expansion of this research program using longitudinal, epidemiological studies and randomized prevention trials to test hypotheses about the origins of disease among rural African American youths. The contributions of economic hardship, downward mobility, neighborhood poverty, and racial discrimination to allostatic load and epigenetic aging are illustrated. The health benefits of supportive family relationships in protecting youths from these challenges are also illustrated. A cautionary set of studies is presented showing that some psychosocially resilient youths demonstrate high allostatic loads and accelerated epigenetic aging, suggesting that, for some, "resilience is just skin deep." Finally, we end on an optimistic note by demonstrating that family-centered prevention programs can have health benefits by reducing inflammation, helping to preserve telomere length, and inhibiting epigenetic aging.


Figures

Figure 1
Figure 1
Latent profile membership standardized scores for the study sample. Adapted from “Cumulative Socioeconomic Status Risk, Allostatic Load, and Adjustment: A Prospective Latent Profile Analysis with Contextual and Genetic Protective Factors,” by G. H. Brody, T. Yu, Y. Chen, et al., 2013, Developmental Psychology, 49, p. 921. Copyright 2012 by the American Psychological Association. Adapted with permission.
Figure 2
Figure 2
Differences in Adolescent Outcomes by Economic Trajectory Across the Great Recession. Means of allostatic load (Panel A), epigenetic aging using the Hannum method (Panel B), epigenetic aging using the Horvath method (Panel C), and overall health status (Panel D; higher numbers indicate poorer health) by family economic hardship groups; n = 131 for stable low hardship group, 105 for downward mobility group, and 82 for stable high hardship group. Significant differences are indicated by difference in letters a and b (p < .05). Error bars = +1 standard error. Adapted from “The Great Recession and Health Risks in African American Youth,” by E. Chen, G. E. Miller, T. Yu, and G. H. Brody, 2015, Brain, Behavior, and Immunity, DOI:10.1016/j.bbi.2015.12.015. Copyright 2015 by Elsevier Inc. Adapted with permission.
Figure 3
Figure 3
The effect of neighborhood poverty at age 19 years on predicted AL by level of neighborhood poverty at age 11 years and emotional support assessed by using a multilevel Poisson regression model. The analysis controlled for family poverty, gender, diet, smoking, binge drinking, perceived stress, unemployment, and financial stress. The lines represent the regression lines for different levels of neighborhood poverty (low: 1 SD below the mean; high: 1 SD above the mean) and emotional support (low: 1 SD below the mean; high: 1 SD above the mean). Numbers in parentheses refer to simple slope for each group. Adapted from “Neighborhood Poverty and Allostatic Load in African American Youth,” by G. H. Brody, M. K. Lei, E. Chen and G. E. Miller, 2014, Pediatrics, 134, p. e1367. Copyright 2014 by the American Academy of Pediatrics. Adapted with permission.
Figure 4
Figure 4
The effect of perceived racial discrimination on young adults’ allostatic load by level of emotional support. The lines represent the regression lines for different levels of emotional support (low: 1 SD below the mean; high: 1 SD above the mean). Numbers in parentheses refer to simple slopes. Adapted from “Perceived Discrimination Among African American Adolescents and Allostatic Load: A Longitudinal Analysis With Buffering Effects,” by G. H. Brody, M. K. Lei, D. H. Chae, T. Yu, S. M. Kogan, and S. R. H. Beach, 2014, Child Development, 85, p. 997. Copyright 2014 by the authors.
Figure 5
Figure 5
The effect of racial discrimination on youths’ epigenetic aging by supportive family environments for SHAPE (top) and AIM (bottom). The lines represent the regression lines for different levels of support from the family environment (low: 1 SD below the mean; high: 1 SD above the mean). Numbers in parentheses refer to simple slopes. For the outcome, higher values reflect immune cells that are epigenetically older than expected based on chronological age. Adapted from “Supportive Family Environments Ameliorates the Link Between Racial Discrimination and Epigenetic Aging: A Replication Across Two Longitudinal Cohorts,” by G. H. Brody, G. E. Miller, T. Yu, S. R. Beach, and E. Chen, in press, Psychological Science. Copyright 2016 by the authors.
Figure 6
Figure 6
Young adults’ (a) depressive symptoms, (b) externalizing problems, and (c) allostatic load as a function of their socioeconomic status (SES)-related risk and self-control/competence in preadolescence (low = 1 SD below the mean; high = 1 SD above the mean). The lines represent the results of regression analyses at low and high levels of SES-related risk, and the numbers in parentheses refer to the simple slopes (***p < .001, *p < .05). Adapted from “Is Resilience Only Skin Deep? Rural African Americans’ Socioeconomic Status-Related Risk and Competence in Preadolescence and Psychological Adjustment and Allostatic Load at Age 19,” by G. H. Brody, T. Yu, E. Chen, G. E. Miller, S. M. Kogan, and S. R. H. Beach, 2013, Psychological Science, 24, p. 1290. Copyright 2013 by the authors.
Figure 7
Figure 7
Effect of neighborhood poverty on substance use (top) and allostatic load (bottom) by college attendance. Adapted from “Neighborhood Poverty, College Attendance, and Diverging Profiles of Substance Use and Allostatic Load in Rural African American Youth,” by E. Chen, G. E. Miller, G. H. Brody, and M. K. Lei, 2015, Clinical Psychological Science, 3, p. 681. Copyright 2014 by the authors.
Figure 8
Figure 8
Self-control’s association with epigenetic age acceleration varies according to SES. Depiction of estimated Hannum values (top) and Horvath values (bottom) at lower (−1.5 SD) and higher (+1.5 SD) levels of self-control and socioeconomic disadvantage. Adapted from “Self-Control Forecasts Better Psychosocial Outcomes But Faster Epigenetic Aging in Low-SES Youth,” by G. E. Miller, T. Yu, E. Chen, and G. H. Brody, 2015, Proceedings of the National Academy of Sciences of the United States of America, 112, pp. 10326–10327. Copyright 2015 by the authors.
Figure 9
Figure 9
(A): Youth whose families participated in SAAF had less inflammation than did controls. The endpoint is a composite indicator of inflammation, formed by summing each subject’s z-scored values for interleukins-1β, 6, 8, and 10, plus tumor necrosis factor-α and IFN-γ. Dots represent individual data points. Within each group, the wide horizontal bar is the mean composite score, and the error bars reflect 95% confidence intervals. (B): Results are consistent with the hypothesis that SAAF’s ability to reduce inflammation is partially attributable to improved parenting. The figure shows results from a mediation model with latent difference scores. Solid and dashed lines reflect significant and nonsignificant paths, respectively. Unstandardized coefficients are shown. *p < 0.05; **p < 0.01; ***p < 0.001. Adapted from “A Family-Oriented Psychosocial Intervention Reduces Inflammation in Low-SES African American Youth,” by G. E. Miller, G. H. Brody, T. Yu, and E. Chen, 2014, Proceedings of the National Academy of Sciences of the United States of America, 111, pp. 11289–11290. Copyright 2014 by the authors.
Figure 10
Figure 10
(A): Means of epigenetic aging at age 20 for the control and intervention groups by parent-reported depression status. High depressive symptoms group, n = 111: control group = 42, SAAF group = 69. Euthymia group, n = 288: control group = 115, SAAF group = 173. Error bars = ±1 standard error. (B): A moderated-mediation model of intervention status, changes in harsh parenting from age 11 to age 16, and epigenetic aging at age 20 for the high depressive symptoms group versus the euthymic group. Family socioeconomic-related risk, gender, BMI, smoking, unhealthful behaviors, and batch assignment were controlled (not shown). Unstandardized coefficients are presented. Numbers in parentheses refer to coefficients for the euthymic group. *p < .05, two-tailed. ***p < .001, two-tailed. Adapted from “Family-Centered Prevention Ameliorates the Longitudinal Association Between Risky Family Processes and Epigenetic Aging,” by G. H. Brody, T. Yu, E. Chen, S. R. H. Beach, and G. E. Miller, 2015, Journal of Child Psychology and Psychiatry, DOI:10.1111/jcpp.12495. Copyright 2015 by the Association for Child and Adolescent Mental Health. Adapted with permission.
Figure 11
Figure 11
(A): The contribution of nonsupportive parenting to youths’ telomere length by intervention status. Numbers in parentheses refer to simple slopes for control group and intervention group. **p < 0.01. (B): A moderated-mediation model of intervention status, change in anger from pretest to posttest, and telomere length at age 22 with socioeconomic-related risk and gender controlled. Unstandardized coefficients are presented; n = 65. *p < 0.05. Adapted from “Prevention Effects Ameliorate the Prospective Association Between Nonsupportive Parenting and Diminished Telomere Length,” by G. H. Brody, T. Yu, S. R. H. Beach, and R. A. Philibert, 2015, Prevention Science, 16, pp. 176–177. Copyright 2014 by the Society for Prevention Research. Adapted with permission.

Similar articles

Cited by

References

    1. Adams RE, Santo JB, Bukowski WM. The presence of a best friend buffers the effects of negative experiences. Developmental Psychology. 2012;47:1786–1791. - PubMed
    1. Antoni MH, Lehman JM, Klibourn KM, Boyers AE, Culver JL, Alferi SM, Carver CS. Cognitive-behavioral stress management intervention decreases the prevalence of depression and enhances benefit finding among women under treatment for early-stage breast cancer. Health Psychology. 2001;20:20–32. - PubMed
    1. Avitsur R, Hunzeker J, Sheridan JF. Role of early stress in the individual differences in host response to viral infection. Brain, Behavior, and Immunity. 2006;20:339–348. - PubMed
    1. Bishop SR. What do we really know about Mindfulness-Based Stress Reduction? Psychosomatic Medicine. 2002;64:71–83. - PubMed
    1. Blackburn EH. Telomeres and telomerase: Their mechanisms of action and the effects of altering their functions. FEBS Letters. 2005;579:859–862. - PubMed