. 2016 Oct 26;3(4):385-394.e3.
doi: 10.1016/j.cels.2016.09.002. Epub 2016 Sep 29.

A Single-Cell Transcriptome Atlas of the Human Pancreas

Affiliations

A Single-Cell Transcriptome Atlas of the Human Pancreas

Mauro J Muraro et al. Cell Syst. .

Abstract

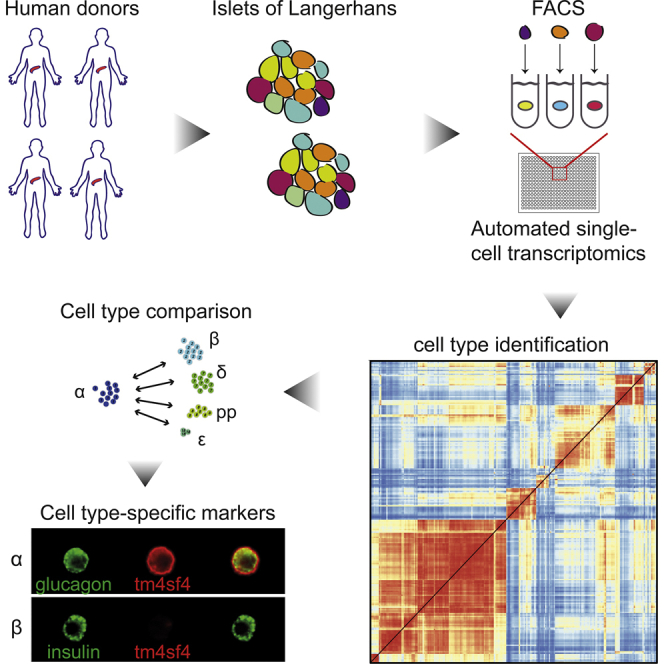
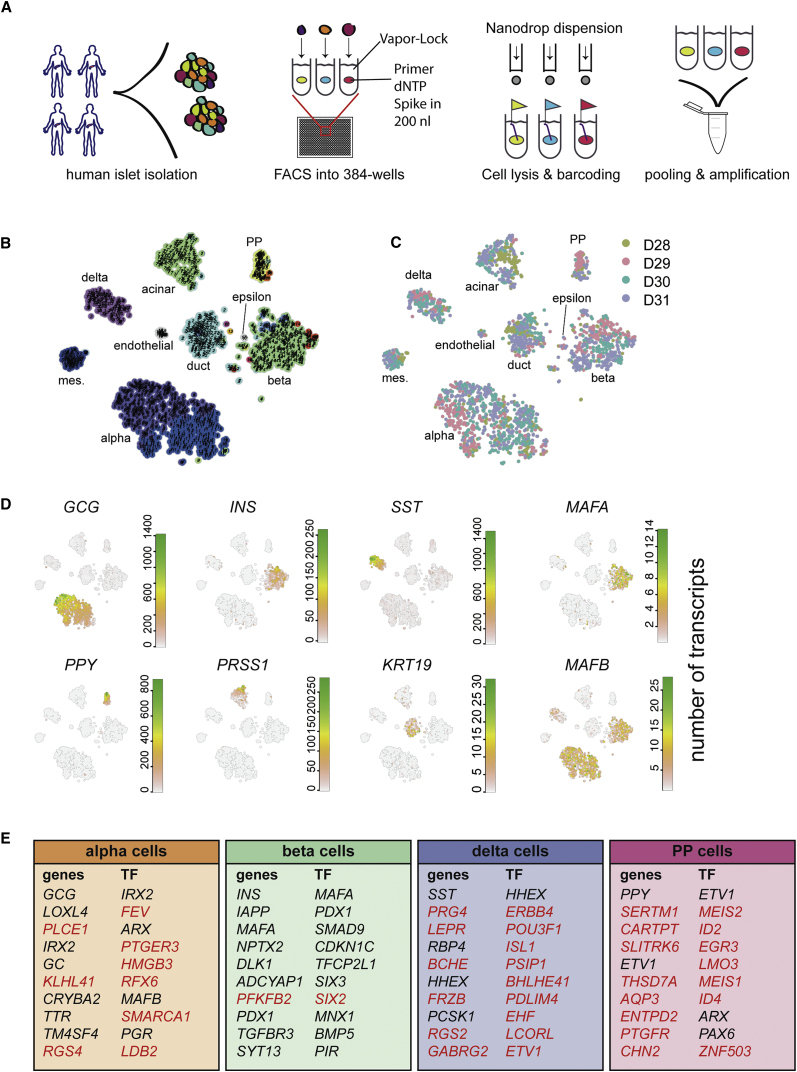
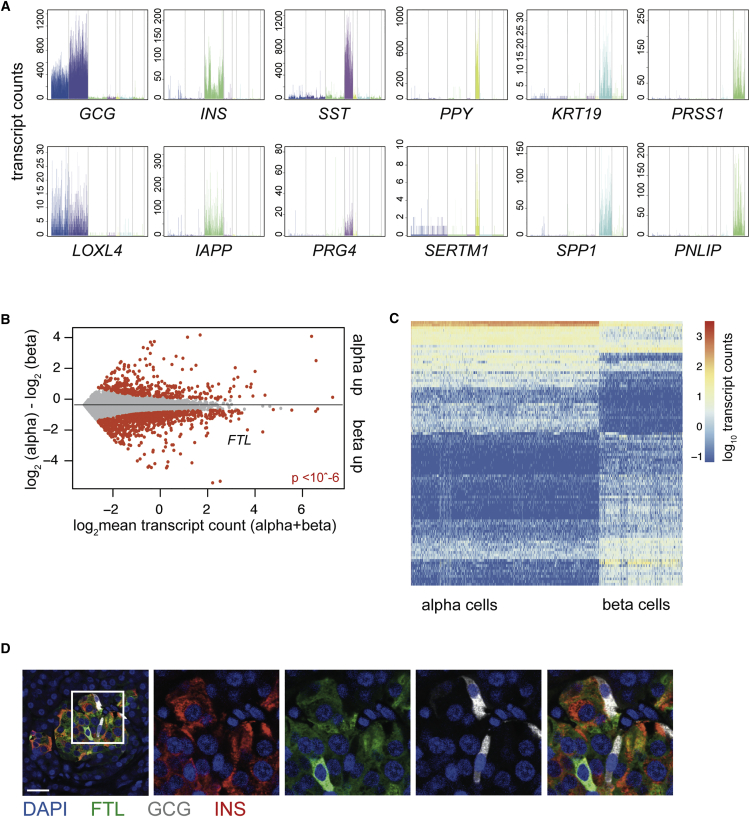
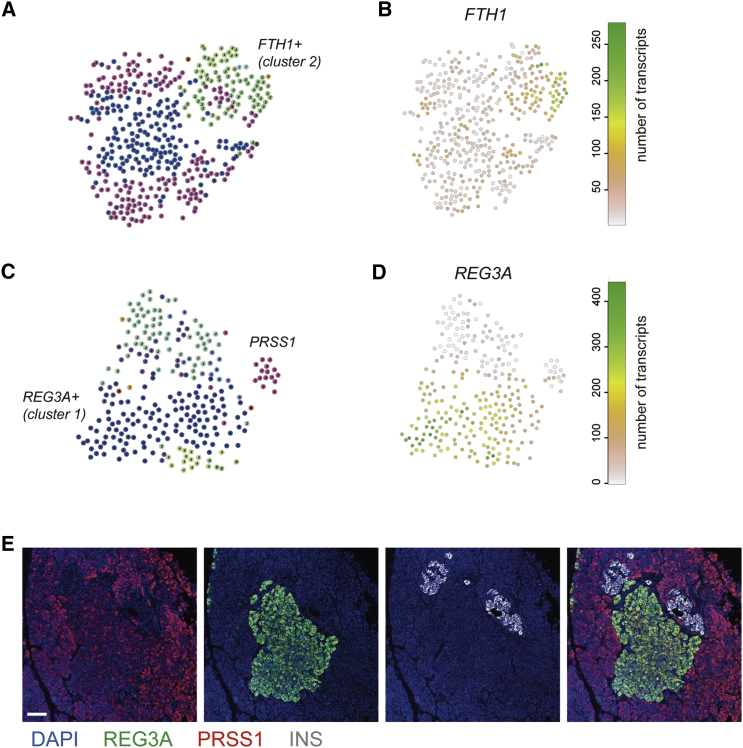
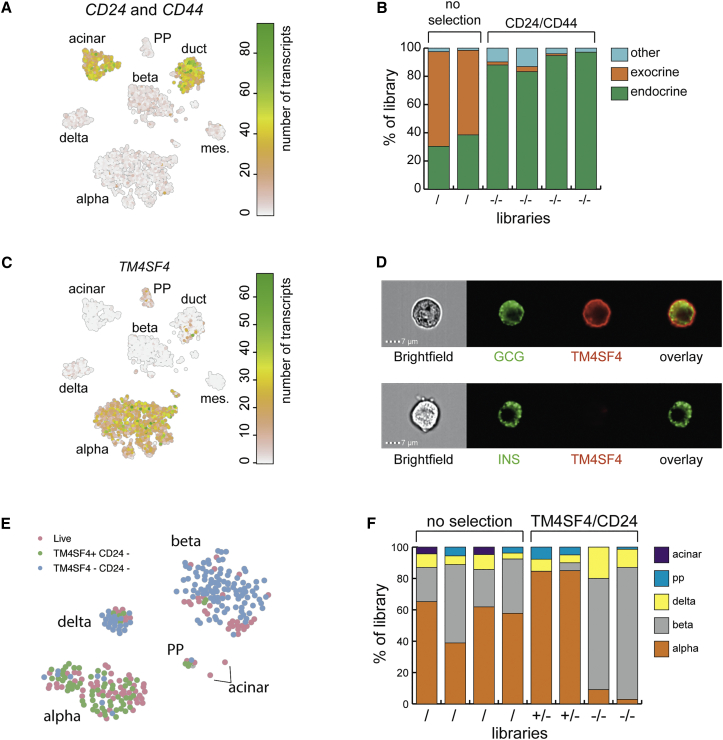
To understand organ function, it is important to have an inventory of its cell types and of their corresponding marker genes. This is a particularly challenging task for human tissues like the pancreas, because reliable markers are limited. Hence, transcriptome-wide studies are typically done on pooled islets of Langerhans, obscuring contributions from rare cell types and of potential subpopulations. To overcome this challenge, we developed an automated platform that uses FACS, robotics, and the CEL-Seq2 protocol to obtain the transcriptomes of thousands of single pancreatic cells from deceased organ donors, allowing in silico purification of all main pancreatic cell types. We identify cell type-specific transcription factors and a subpopulation of REG3A-positive acinar cells. We also show that CD24 and TM4SF4 expression can be used to sort live alpha and beta cells with high purity. This resource will be useful for developing a deeper understanding of pancreatic biology and pathophysiology of diabetes mellitus.

Keywords: islets of Langerhans; pancreas; sequencing; single-cell transcriptomics.


Figures

None
Graphical abstract
Figure 1
Figure 1
SORT-Seq Allows for Deep Sequencing of Human Pancreas Cells (A) Experimental workflow for SORT-seq. Islets were isolated from human donors. Cells were dispersed and sorted into 384-well plates with mineral oil, containing 100 nL of CEL-seq2 primers, dNTPs, and spike-ins. The RT mix was then distributed by Nanodrop II. After second-strand synthesis, material was pooled and amplified before RNA library preparation. (B) Visualization of k-medoid clustering and cell-to-cell distances using t-SNEs. Each dot represents a single cell. Colors and numbers indicate clusters, and cell-type names are indicated with their corresponding cluster or clusters. (C) t-SNE map highlighting donor source. Each color represents one donor. (D) t-SNE maps highlighting the expression of marker genes for each of the six main pancreatic cell types. Transcript counts are given in a linear scale. (E) Tables denoting the top ten differentially expressed genes and transcription factors (TFs) when comparing one cell type to all other cells in the dataset (p < 10−6). Genes whose cell-type specificity was previously unknown in the human pancreas are marked in red.
Figure 2
Figure 2
Cluster-Restricted Gene Expression Patterns and Identification of Cell-Type-Specific Genes (A) Expression of well-known marker genes (top) and the most differentially expressed gene (bottom) in each of the six main pancreatic cell types. If the most differentially expressed gene is also a canonical marker gene, the next most differentially expressed gene is shown. Gene expression values are plotted on the y axis. Each bar represents a cell, and cells are grouped by cluster with a specific color in the following order: alpha, beta, delta, PP, duct, and acinar. (B) Differential gene expression analysis between alpha and beta cells reveals 1,376 differentially expressed genes. Gray dots indicate genes; red dots indicate significant genes (p < 10−6). The y axis indicates the log2 fold change, and the x axis shows the mean transcript count over both groups of cells. (C) Heatmap of the top 100 differentially expressed genes between alpha and beta cells. Rows are genes, and columns are cells. Log2 expression of transcript counts for genes is plotted. Columns are ordered based on cell type (alpha on the left and beta on the right). Genes are grouped based on hierarchical clustering. (D) Immunohistochemistry for ferritin light subunit (FTL, green) glucagon (GCG, gray), and insulin (INS, red) with counterstaining for DAPI (blue) on human pancreatic tissue sections. Scale bar represents 25 μM.
Figure 3
Figure 3
Outlier Identification Reveals Heterogeneity within Acinar and Beta Cells (A) t-SNE map of RaceID clusters after clustering of only beta cells. (B) t-SNE map highlighting the expression of FTH1. (C) t-SNE map of RaceID clusters after clustering of only acinar cells. (D) t-SNE map highlighting the expression of REG3A. (E) Immunohistochemistry for REG3A (green), trypsin (red), and insulin (gray), with counterstaining for DAPI (blue). Scale bar represents 75 μM.
Figure 4
Figure 4
Enrichment of Alpha and Beta Cells Based on Cell-Surface Markers (A) t-SNE map highlighting the combined expression of CD24 and CD44. (B) Results of FACS enrichment based on selection against CD24/CD44. Two libraries were selected for live staining (/), and four were selected against CD24 and CD44 expression (−/−). The y axis indicates the portion of the library consisting of a particular cell type. Colors indicate cell types. (C) t-SNE map highlighting the expression of TM4SF4. (D) Imagestream analysis of dispersed, fixed single-cells from human pancreas. The left panels show a bright field image of the cell and then immunostaining against glucagon (green) and Tm4sf4 (red). The lower panel shows insulin in green. (E) t-SNE map highlighting libraries from a TM4SF4/CD24 sort. Cells that were not stained are in pink. Cells sorted for TM4SF4+/CD24− are in green and for TM4SF4−/CD24− are in blue. (F) Results of FACS enrichment based on selection for TM4SF4/CD24. Four libraries were selected for live staining (/). Two libraries were TM4SF4+/CD24− (+/−), and two were TM4SF4−/CD24− (−/−). The y axis indicates the portion of the library consisting of a particular cell type. Colors indicate cell types.

References

    1. Ackermann A.M., Wang Z., Schug J., Naji A., Kaestner K.H. Integration of ATAC-seq and RNA-seq identifies human alpha cell and beta cell signature genes. Mol. Metab. 2016;5:233–244. - PMC - PubMed
    1. Åkerfeldt M.C., Laybutt D.R. Inhibition of Id1 augments insulin secretion and protects against high-fat diet-induced glucose intolerance. Diabetes. 2011;60:2506–2514. - PMC - PubMed
    1. Anders S., Huber W. Differential expression analysis for sequence count data. (2010) Genome Biol. 2010;11:R106. - PMC - PubMed
    1. Anderson K.R., Singer R.A., Balderes D.A., Hernandez-Lagunas L., Johnson C.W., Artinger K.B., Sussel L. The L6 domain tetraspanin Tm4sf4 regulates endocrine pancreas differentiation and directed cell migration. Development. 2011;138:3213–3224. - PMC - PubMed
    1. Arden C., Hampson L.J., Huang G.C., Shaw J.A.M., Aldibbiat A., Holliman G., Manas D., Khan S., Lange A.J., Agius L. A role for PFK-2/FBPase-2, as distinct from fructose 2,6-bisphosphate, in regulation of insulin secretion in pancreatic beta-cells. Biochem. J. 2008;411:41–51. - PubMed

Publication types