. 2016 Oct 10;30(4):578-594.
doi: 10.1016/j.ccell.2016.08.017. Epub 2016 Sep 29.

Expression of Idh1R132H in the Murine Subventricular Zone Stem Cell Niche Recapitulates Features of Early Gliomagenesis

Affiliations

Expression of Idh1R132H in the Murine Subventricular Zone Stem Cell Niche Recapitulates Features of Early Gliomagenesis

Chiara Bardella et al. Cancer Cell. .

Abstract

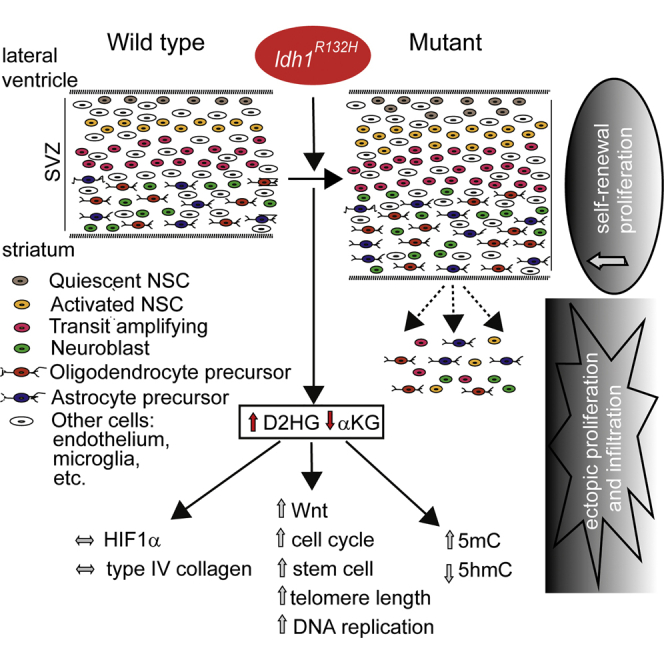
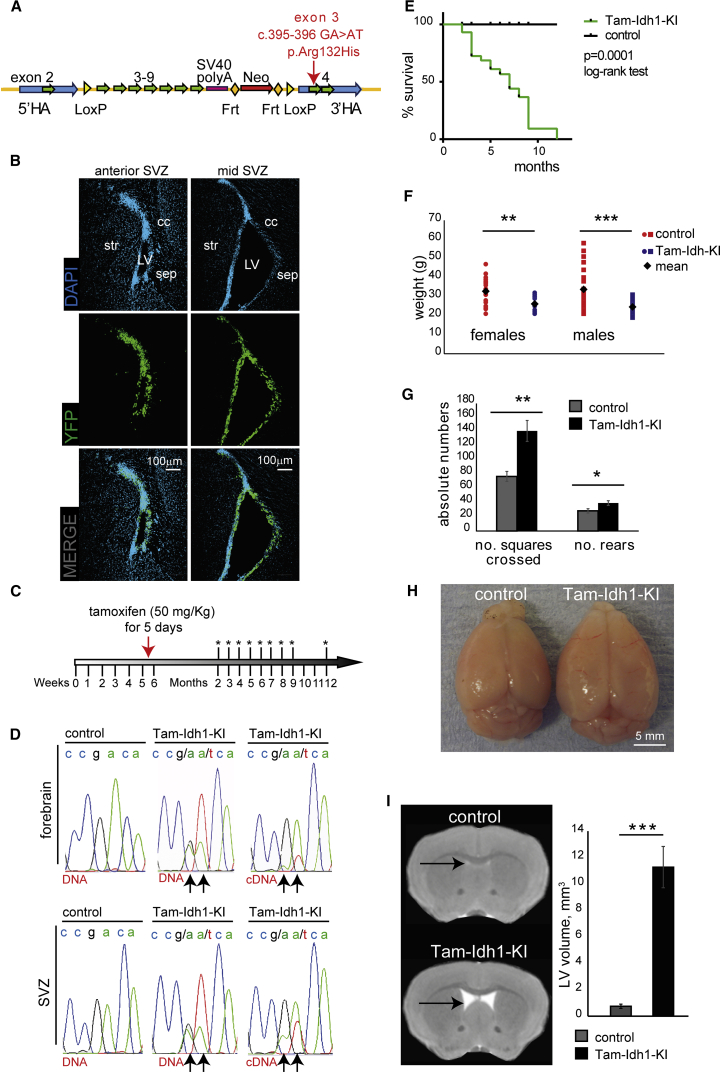
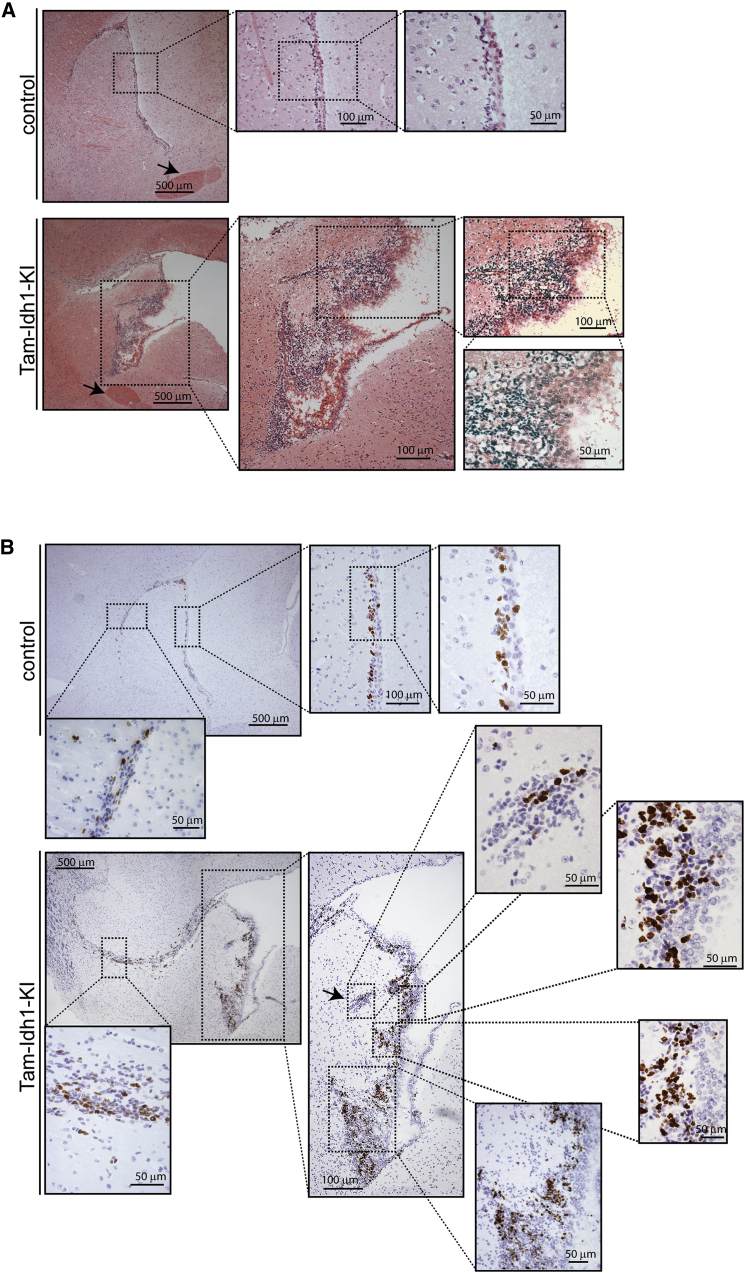
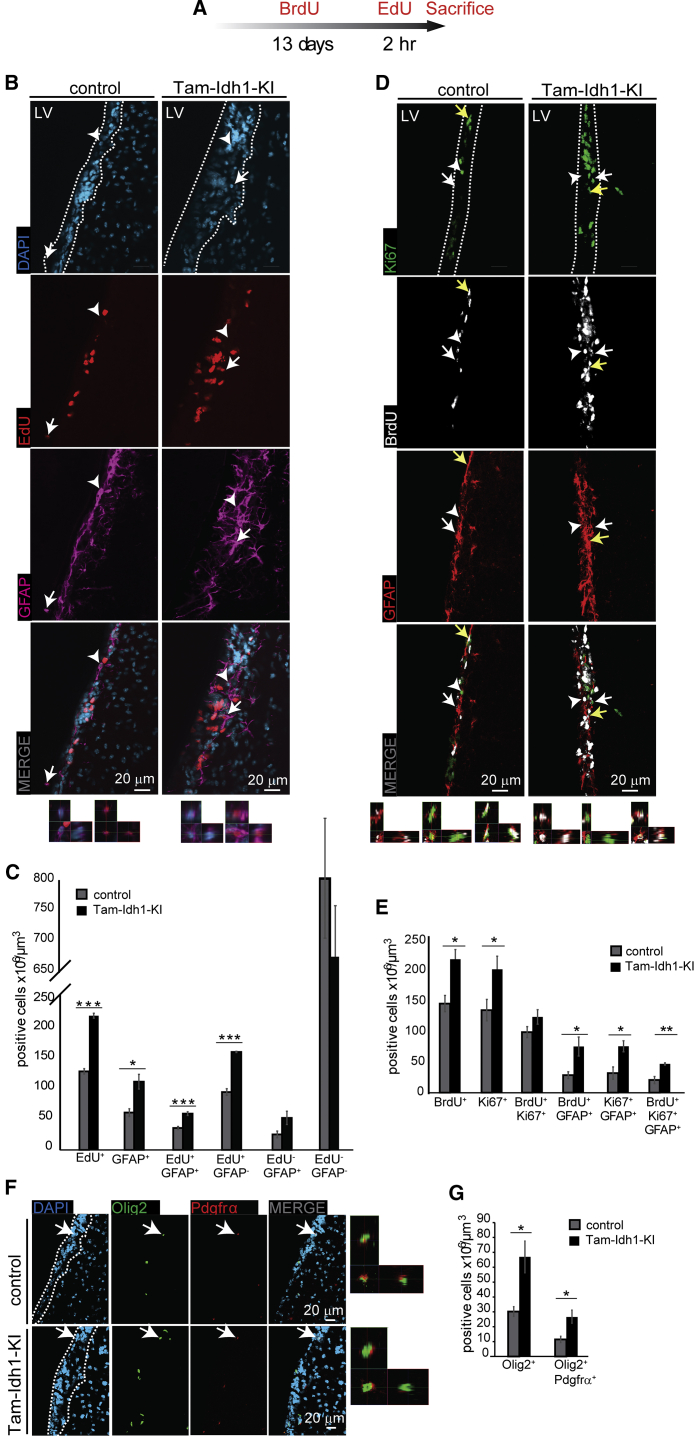
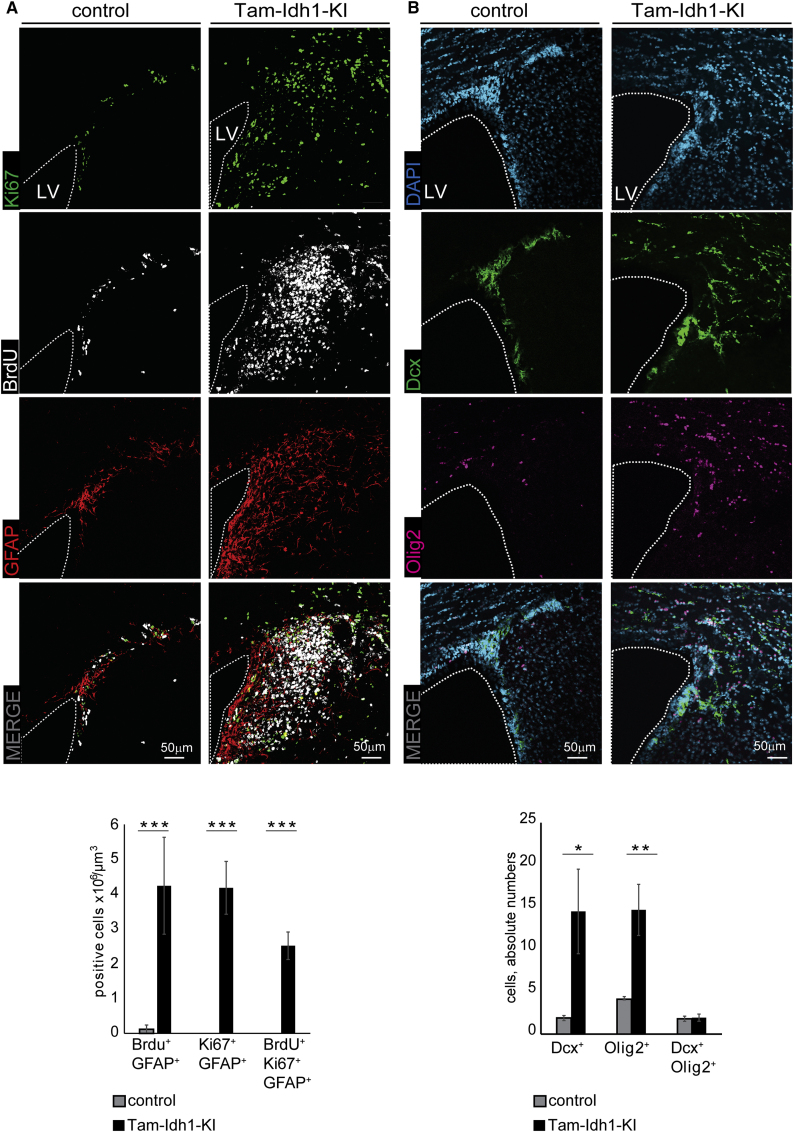
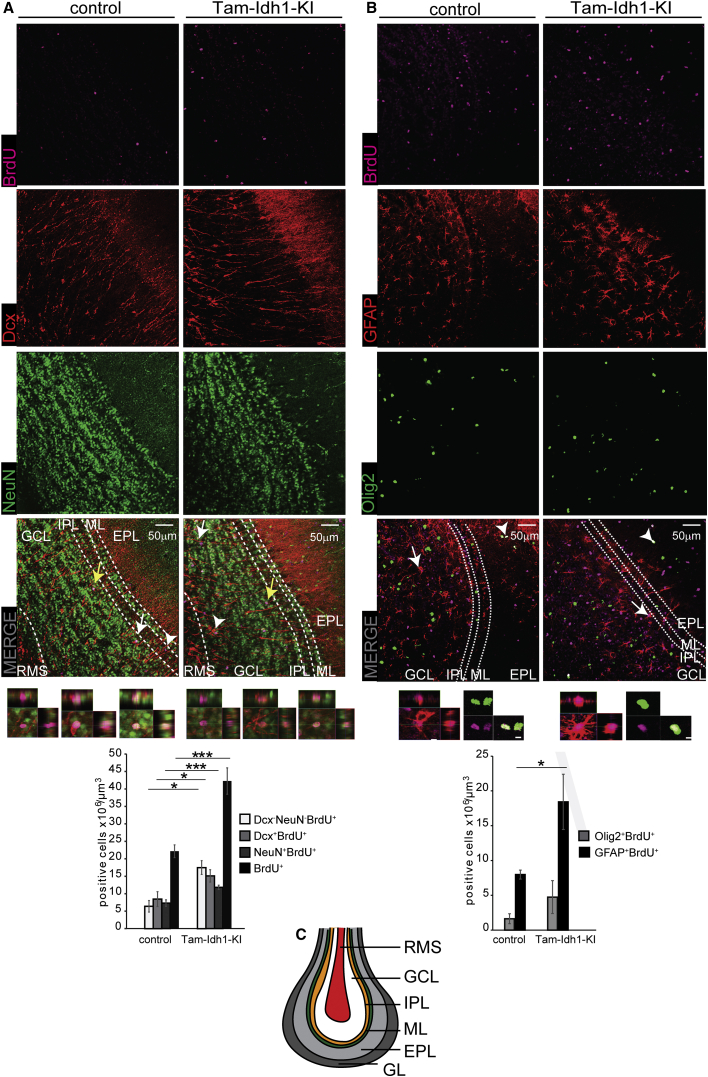
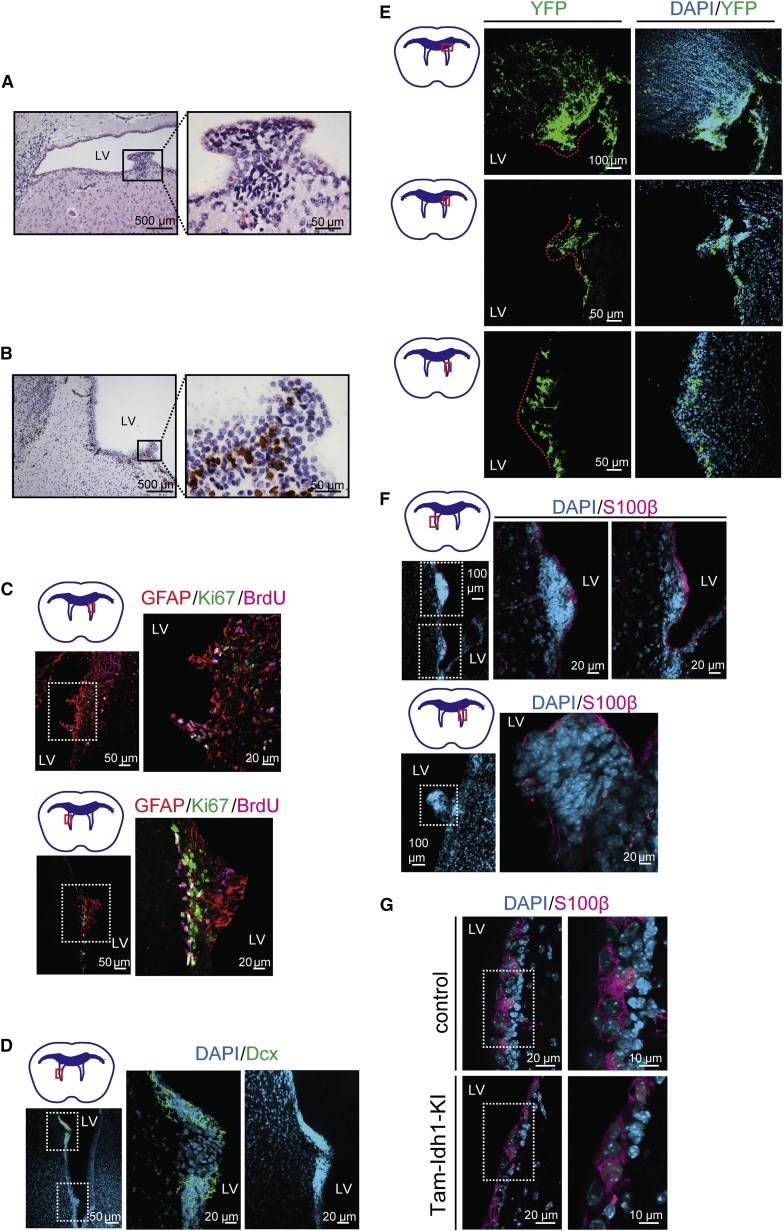
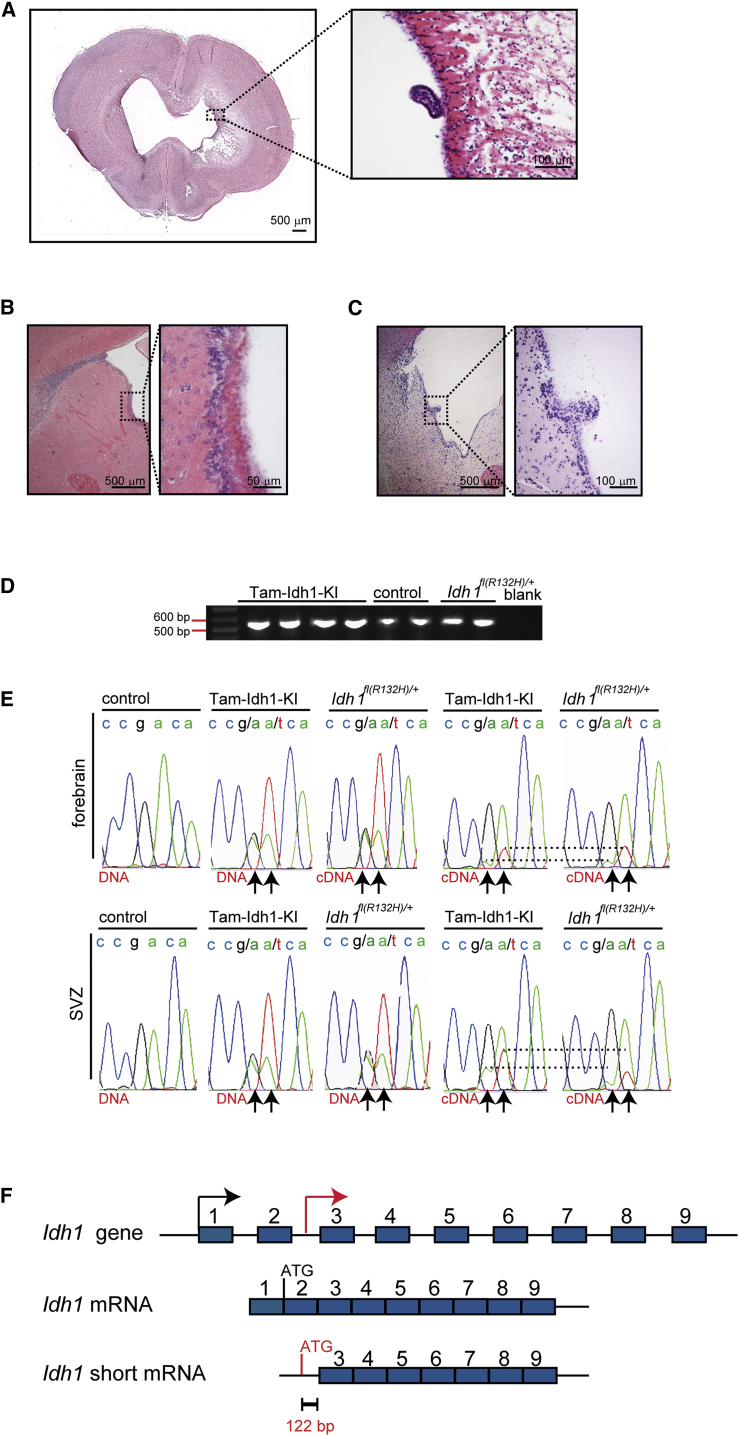
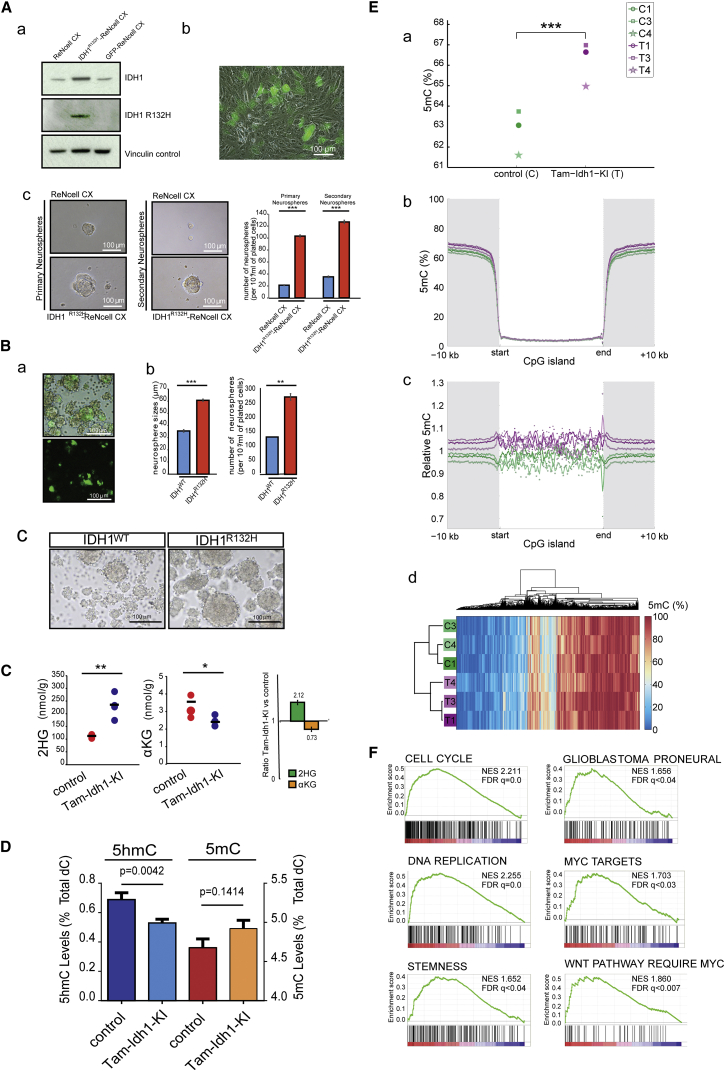
Isocitrate dehydrogenase 1 mutations drive human gliomagenesis, probably through neomorphic enzyme activity that produces D-2-hydroxyglutarate. To model this disease, we conditionally expressed Idh1R132H in the subventricular zone (SVZ) of the adult mouse brain. The mice developed hydrocephalus and grossly dilated lateral ventricles, with accumulation of 2-hydroxyglutarate and reduced α-ketoglutarate. Stem and transit amplifying/progenitor cell populations were expanded, and proliferation increased. Cells expressing SVZ markers infiltrated surrounding brain regions. SVZ cells also gave rise to proliferative subventricular nodules. DNA methylation was globally increased, while hydroxymethylation was decreased. Mutant SVZ cells overexpressed Wnt, cell-cycle and stem cell genes, and shared an expression signature with human gliomas. Idh1R132H mutation in the major adult neurogenic stem cell niche causes a phenotype resembling gliomagenesis.

Keywords: DNA (hydroxy)methylation; Wnt; glioma; hydroxyglutarate; hydroxylase; isocitrate dehydrogenase; oncometabolite; stem cell; subventricular zone; α-ketoglutarate.


Figures

None
Graphical abstract
Figure 1
Figure 1
Idh1R132H Expression in the SVZ and Its Effects on Weight, Behavior, and Lateral Ventricle Size in Adult Mice (A) The construct used to generate Tam-Idh1-KI mice is shown. After homologous recombination into the endogenous Idh1 locus, expression of Cre causes deletion of (1) a mini-gene containing Idh1 wild-type exons 3–9; (2) termination codon and SV40 polyA signal; and (3) NeoR cassette. Idh1R132H is then expressed from the native promoter. The following features are shown: loxP and Frt sites; 5′ and 3′ homology arms (HAs); wild-type mini-gene (exons 3–9) and SV40 polyA signal; neomycin resistance cassette (NeoR); location of the R132H mutation. (B) The panels show expression of the YFP reporter in the anterior SVZ (left) and mid-SVZ (right) of Nes-CreER(T2);R26R-EYFP mice 29 weeks after tamoxifen induction. cc, corpus callosum; str, striatum; sep, septum; LV, lateral ventricle. (C) Tamoxifen dosage schedule is shown. Asterisks indicate time points of brain collections. (D) Sequencing chromatogram shows genomic DNA or cDNA of a region around Idh1 codon 132 from forebrain or SVZ of control or Tam-Idh1-KI mice as indicated. Arrows indicate nucleotides altered in Idh1R132H (c. 395–396 CGA > CAT). (E) Kaplan-Meier plots show the survival of Tam-Idh1-KI (n = 28) and control (n = 32) mice from 18 litters. (F) Body weights of paired Tam-Idh1-KI and control mice are shown. (G) Open field test measures of locomotion (no. of squares crossed) and activity (no. of rears) are shown. (H) Whole-brain dissections show frontal and parietal lobe morphology in Tam-Idh1-KI and control animals. (I) MRI illustrates LV volumes (arrows) in Tam-Idh1-KI mice and controls. Sections were taken at comparable locations. Estimated LV volumes of three Tam-Idh1-KI mice and three controls are shown in the chart. All data are presented as mean ± SD (p < 0.05, ∗∗p < 0.01, ∗∗∗p < 0.005). See also Figure S1.
Figure 2
Figure 2
Histology and Proliferation of SVZ in Tam-Idh1-KI and Control Mice (A) H&E staining of sagittal sections from control and Tam-Idh1-KI mice is shown. The anterior commissure is indicated by arrows. (B) Ki67 immunohistochemistry is shown in sagittal sections at comparable medio-lateral positions from Tam-Idh1-KI and control mice. Ki67+ cell clusters ectopic to the SVZ are arrowed. Areas in the insets are magnified.
Figure 3
Figure 3
The Effect of Idh1R132H on Label-Retaining Cells, Proliferating Cells, and Oligodendrocytes in the SVZ (A) The time course of BrdU and EdU injections is shown. (B) For the analysis of rapidly cycling cells, EdU and GFAP expression in the SVZ was determined. Representative images showing EdU and GFAP expression were derived from coronal sections from four Tam-Idh1-KI and four control mice. The left-hand image at the bottom of each panel is a magnified orthogonal 3D view of the GFAP+EdU cell marked by an arrowhead; and the adjacent right-hand image is the equivalent view of the GFAP+EdU+ cell marked by an arrow. Dashed lines outline the SVZ. (C) Z stack quantifications of each cellular population from (B) are shown in the chart as “density”, which is a measure of the proportion of each cell type. Total EdU+ and GFAP+ cells are shown, followed by a breakdown of these into the component categories and an EdUGFAP- group. (D) For analysis of label-retaining cells, BrdU, Ki67, and GFAP expression was assessed. The left-hand image at the bottom of each panel is a magnified orthogonal 3D view of the GFAP+BrdU+ cell marked by a white arrow; the adjacent middle image is the equivalent view of the GFAP+Ki67+ cell marked by a white arrowhead; and the adjacent right-hand image is the equivalent view of the GFAP+BrdU+Ki67+ cell marked by a yellow arrow. Other annotation is as per (B). (E) The chart shows quantification of each directly counted, marker-positive cell population from (D). Note that BrdU+ cells may have any Ki67 and GFAP status and BrdU+Ki67+ cells include both GFAP+ and GFAP cells. (F) Olig2+ (pan-oligodendrocyte) and Pdgfrα+ (progenitors) expression are shown. The image at the extreme right of each panel is a magnified orthogonal 3D view of the Olig2+Pdgfrα+ cell indicated by a white arrow. Other annotation is as per (B). (G) The chart shows quantification of cell populations from (F). Note that Olig2+ includes cells with any Pdgfrα status. All data are presented as mean ± SD (p < 0.05, ∗∗p < 0.01, ∗∗∗p < 0.005). See also Figure S2.
Figure 4
Figure 4
The Effect of Idh1R132H on Tissues Surrounding the Dorsolateral Corner of the SVZ (A) Ki67, BrdU, and GFAP expression are shown in coronal sections of Tam-Idh1-KI and control brains. Dashed lines outline the LV, around which the SVZ usually forms a ribbon of cells. The data are quantitated in the bar chart below. (B) Cells expressing oligodendocyte (Olig2+) and neuroblast (Dcx+) markers are shown. The data are quantitated in the bar chart below. All data are presented as mean ± SD (p < 0.05, ∗∗p < 0.01, ∗∗∗p < 0.005). See also Figure S3.
Figure 5
Figure 5
The Effect of Idh1R132H on Neurogenesis and Astrocyte Genesis in the Olfactory Bulb (A) BrdU, Dcx, and NeuN expressing cells (neurogenesis) are shown in representative images from Tam-Idh1-KI (n = 4) and control (n = 4) OBs. The left-hand image at the bottom of each panel is a magnified orthogonal 3D view of the BrdU+DcxNeuN- cell marked by a white arrow; the adjacent middle image is the equivalent view of the BrdU+Dcx+NeuN cell marked by a white arrowhead; and the adjacent right-hand image is the equivalent view of the BrdU+DcxNeuN+ cell marked by a yellow arrow. RMS, rostral migratory stream; GCL, granule cell layer; IPL, internal plexiform layer; ML, mitral layer; EPL, external plexiform layer. The cell counts are quantitated in the bar chart. (B) BrdU, GFAP, and Olig2 (astrocyte genesis) data are shown from the same mice as in (A). The left-hand image at the bottom of each panel is a magnified orthogonal 3D view of the BrdU+GFAP+ cell marked by a white arrow; and the adjacent right-hand image is the equivalent view of the BrdU+DcxNeuN+ cell marked by a white arrowhead. Other annotations are as per (A). (C) A schematic of the multi-layered cellular architecture of a mouse OB is shown. GL, glomerular layer. Other annotations are as per (A). All data are presented as mean ± SD (p < 0.05, ∗∗∗p < 0.005). See also Figure S4.
Figure 6
Figure 6
Nodule Formation in the SVZ (A) Typical morphology of a nodule protruding into the lateral ventricle (LV) is shown in an H&E-stained section from a Tam-Idh1-KI animal. (B) Ki67 expression was assessed in a nodule and at other sites along the LV wall. (C) Nodule proliferation was assessed by immunofluorescence for Ki67 and BrdU. Two nodules are shown (left), magnified in the inset (right). The astrocyte lineage marker GFAP is also shown. (D) Immature neuroblast differentiation in nodules was assessed using Dcx. (E) The origin of nodules from nestin-expressing cells was assessed using the YFP reporter. The dashed lines outline the nodules. YFP+ cells infiltrating the corpus callosum are also marked. (F) Ependymal cell-specific S100β expression indicates the extent of the continuity of the ependymal cell layer overlying the nodules and potential origins of the nodules from ependymal cells. Three nodules are shown (left), magnified in the insets (right). (G) A high-power view compares the ependymal cell layer in Tam-Idh1-KI and control mice.
Figure 7
Figure 7
Leaky Phenotype in a Minority of Idh1fl(R132H)/+ Mice without Nes-Cre (A) A coronal full-brain section from a symptomatic Idh1fl(R132H)/+ mouse 6 weeks old is shown. A nodule is outlined and magnified. (B) Detailed SVZ morphology of an asymptomatic 4 month old Idh1fl(R132H)/+mouse is shown (sagittal section). (C) A nodule is present in an asymptomatic 13 month old mouse (sagittal section). (D) The Idh1 transcript lacking exons 1 and 2 was amplified from cDNA by endpoint RT-PCR (amplicon size 562 bp). (E) DNA sequencing chromatogram shows genomic DNA or cDNA specifically derived from the short transcript in the Idh1 region around codon 132 (samples from mouse forebrain). Arrows indicate nucleotides altered in Tam-Idh1-KI and Idh1fl(R132H)/+; dashed lines provide an indication of the relative dosages of wild-type and mutant short transcript in each case. (F) Schematic of short in-frame Idh1 transcript lacking exons 1 and 2 shows the putative translational origin in intron 2.
Figure 8
Figure 8
Assessment of Functional Mechanisms Underlying the Tam-Idh1-KI Phenotype (A) The experiments determined the effects of IDH1R132H expression in ReNcell CX neuronal progenitor cells. (a) western blot shows expression of total and mutant IDH1 in cells transduced by IDH1R132H or GFP lentiviral vectors compared with untransduced cells. (b) GFP expression indicates transduction efficiency. (c) Representative bright-field images are shown for ReNcell CX cells (IDH1R132H-transduced or untransduced controls) grown as primary or secondary neurospheres at low density. The chart shows quantification of neurospheres grown at a low density. Data are representative of three independent experiments, one using high and two using low density cultures, giving consistent results. Results are presented as means ± SEM (∗∗∗p < 0.005). (B) Tertiary neurospheres were derived from primary SVZ cells transduced with lentiviruses expressing IDH1 wild-type (WT) or R132H. (a) GFP expression shows representative transduction efficiency. (b) After 4 days in culture, the size and number of WT and IDH1R132H neurospheres were measured to assess proliferation and self-renewal capacity. The chart shows a representative experiment of three independent experiments, two using high and one using low density cultures. Results are presented as means ± SEM (∗∗p < 0.01, ∗∗∗p < 0.005). (c) Representative images of IDH1-wild-type and IDH1R132H neurosphere cultures grown at high density are shown. (C) Mass spectrometric assessment of the effect of Idh1R132H on 2HG and αKG levels was performed. Brain tissue extracts from Tam-Idh1-KI mice (n = 4) and controls (n = 3) aged 4–9 months were assayed for total 2HG (D and L isomers). Data are shown as dot plots and summarized as relative expression in the bar chart, presented as means ± SD. p < 0.05, ∗∗p < 0.01, from ANOVA. (D) Total 5hmC and 5mC levels of forebrain were assessed using denaturing HPLC. Data are presented as means ± SD. (E) 5mC genome sequencing was performed on SVZ DNAs. (a) Levels of cytosine methylation at CpG dinucleotides in Tam-Idh1-KI (T) and controls (C) paired by age and sex are shown, ∗∗∗p = 0.0163, from Kolmogorov-Smirnov test. (b, c) Absolute (b) and relative (c) differences in CpG methylation within CpG islands and flanking regions. (d) Hierarchical cluster analysis of top 2,000 differentially methylated CpGs to assess whether mutants and controls clustered separately. (F) mRNA expression GSEA analysis is shown for selected gene sets enriched in Tam-Idh1-KI brains. See also Figures S5 and S6, Table S1.

References

    1. Aghili M., Zahedi F., Rafiee E. Hydroxyglutaric aciduria and malignant brain tumor: a case report and literature review. J. Neurooncol. 2009;91:233–236. - PubMed
    1. Akbay E.A., Moslehi J., Christensen C.L., Saha S., Tchaicha J.H., Ramkissoon S.H., Stewart K.M., Carretero J., Kikuchi E., Zhang H. D-2-hydroxyglutarate produced by mutant IDH2 causes cardiomyopathy and neurodegeneration in mice. Genes Dev. 2014;28:479–490. - PMC - PubMed
    1. Amary M.F., Damato S., Halai D., Eskandarpour M., Berisha F., Bonar F., McCarthy S., Fantin V.R., Straley K.S., Lobo S. Ollier disease and Maffucci syndrome are caused by somatic mosaic mutations of IDH1 and IDH2. Nat. Genet. 2011;43:1262–1265. - PubMed
    1. Borger D.R., Tanabe K.K., Fan K.C., Lopez H.U., Fantin V.R., Straley K.S., Schenkein D.P., Hezel A.F., Ancukiewicz M., Liebman H.M. Frequent mutation of isocitrate dehydrogenase (IDH)1 and IDH2 in cholangiocarcinoma identified through broad-based tumor genotyping. Oncologist. 2012;17:72–79. - PMC - PubMed
    1. Chowdhury R., Yeoh K.K., Tian Y.M., Hillringhaus L., Bagg E.A., Rose N.R., Leung I.K., Li X.S., Woon E.C., Yang M. The oncometabolite 2-hydroxyglutarate inhibits histone lysine demethylases. EMBO Rep. 2011;12:463–469. - PMC - PubMed

Publication types

Substances