. 2016 Oct 6;167(2):405-418.e13.
doi: 10.1016/j.cell.2016.08.032. Epub 2016 Sep 29.

Loss of the HVEM Tumor Suppressor in Lymphoma and Restoration by Modified CAR-T Cells

Affiliations

Loss of the HVEM Tumor Suppressor in Lymphoma and Restoration by Modified CAR-T Cells

Michael Boice et al. Cell. .

Abstract

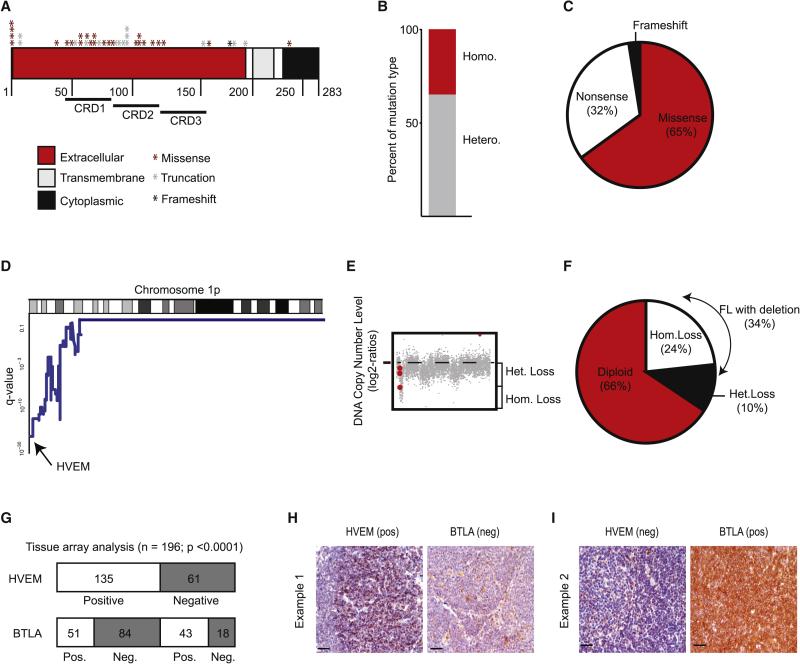
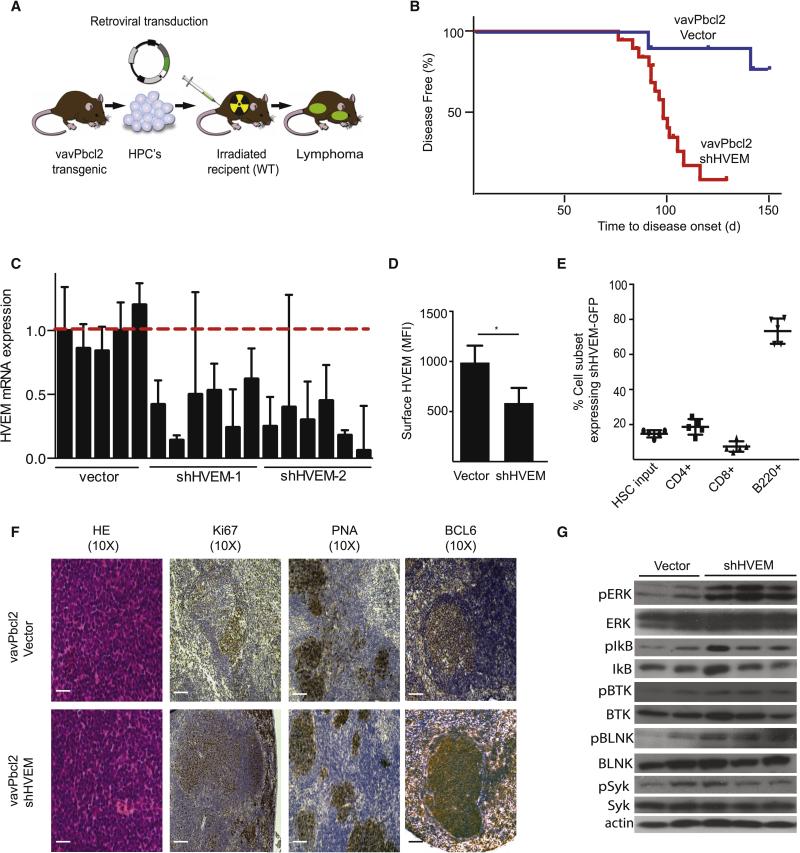
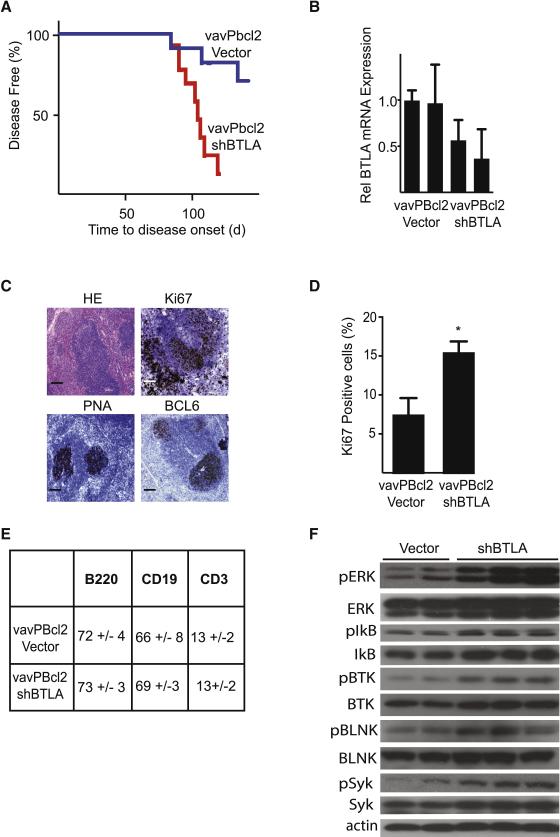
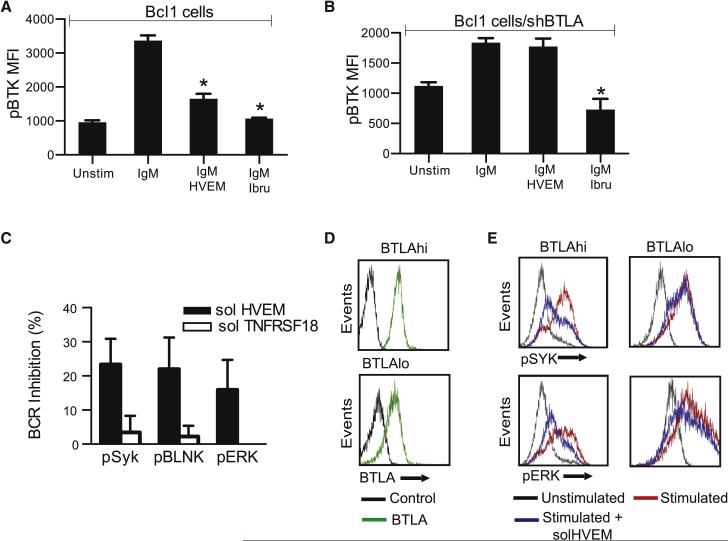
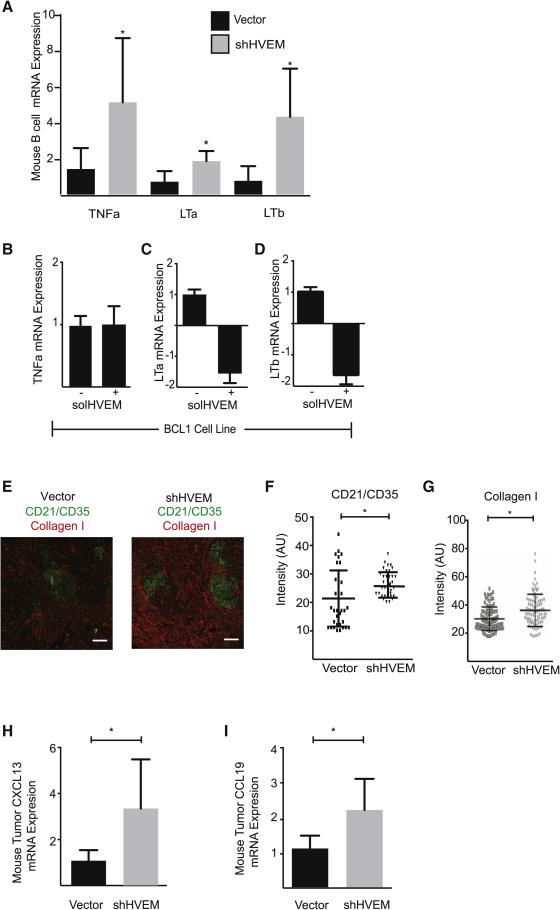
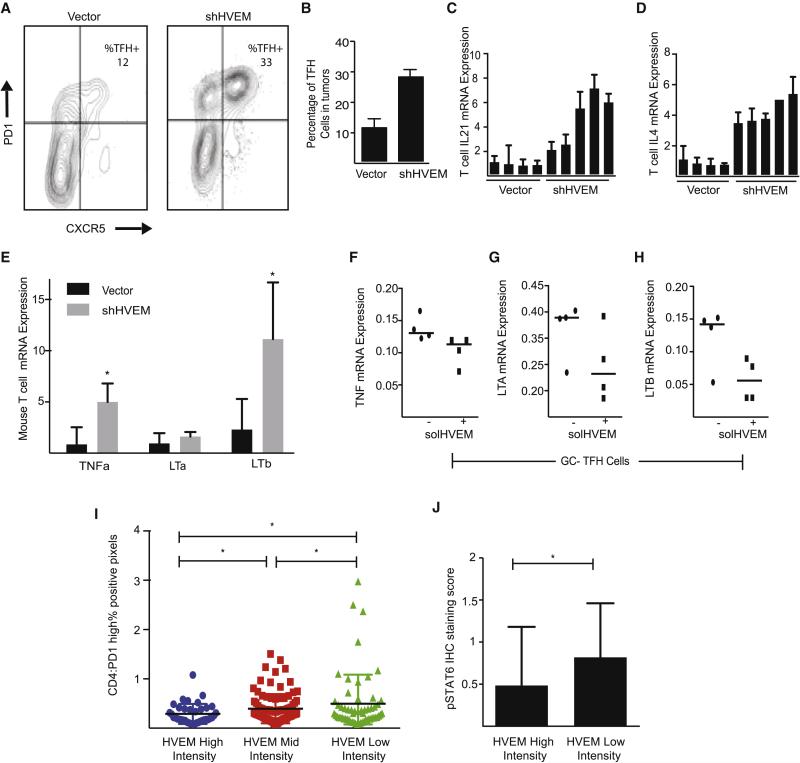
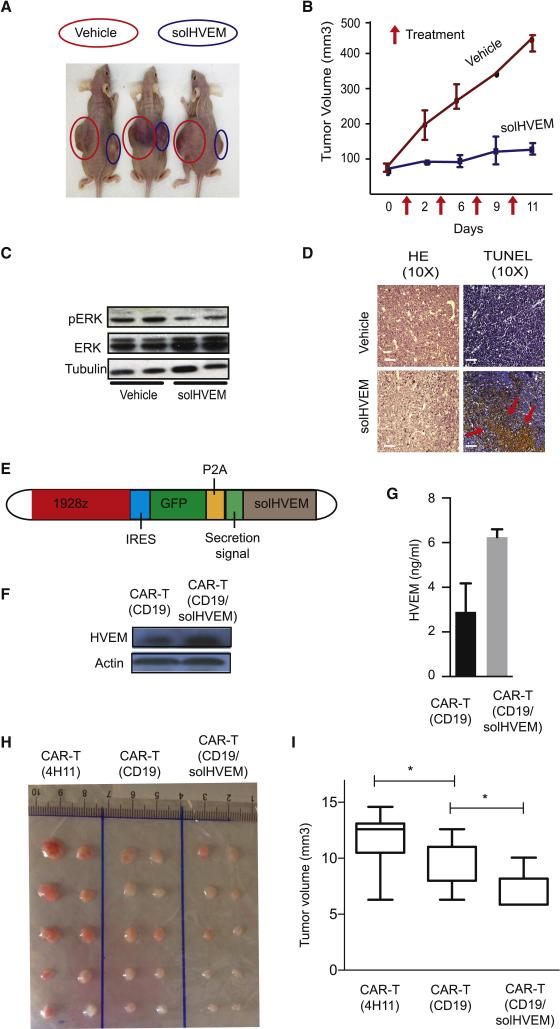
The HVEM (TNFRSF14) receptor gene is among the most frequently mutated genes in germinal center lymphomas. We report that loss of HVEM leads to cell-autonomous activation of B cell proliferation and drives the development of GC lymphomas in vivo. HVEM-deficient lymphoma B cells also induce a tumor-supportive microenvironment marked by exacerbated lymphoid stroma activation and increased recruitment of T follicular helper (TFH) cells. These changes result from the disruption of inhibitory cell-cell interactions between the HVEM and BTLA (B and T lymphocyte attenuator) receptors. Accordingly, administration of the HVEM ectodomain protein (solHVEM(P37-V202)) binds BTLA and restores tumor suppression. To deliver solHVEM to lymphomas in vivo, we engineered CD19-targeted chimeric antigen receptor (CAR) T cells that produce solHVEM locally and continuously. These modified CAR-T cells show enhanced therapeutic activity against xenografted lymphomas. Hence, the HVEM-BTLA axis opposes lymphoma development, and our study illustrates the use of CAR-T cells as "micro-pharmacies" able to deliver an anti-cancer protein.


Figures

Figure 1
Figure 1. The HVEM – BTLA interaction is disrupted in the majority of human FLs
A, Summary of HVEM mutations in 141 FL samples; B, Distribution of copy number (CN) status in the 41 patients harboring a HVEM CN alteration, red: homozygous deletions, grey: heterozygous deletions; C, Percentage of each type of mutation found in FL patients; D, Chr. 1p36 deletions affect the HVEM locus (MSKCC cohort, n=64); E, GISTIC analysis indicates frequent homozygous HVEM deletions; F, Frequency of deletions by zygosity in indolent FL; G, Quantification of positive and negative cases represented on TMAs stained for HVEM and BTLA; H and I, immunohistochemical staining. In the first panel (H) strong staining with an anti-HVEM antibody was observed in the malignant cell population whereas BTLA remained largely negative. The second panel (I) is negative for HVEM but shows strong positivity for BTLA in all tumor cells. Original magnification x400, scale bars equal 50 μm. (See also Figure S1, and Table S1-S5).
Figure 2
Figure 2. HVEM functions as a tumor suppressor in a mouse model of FL
A, Schematic representation of vavPBcl2 mosaic mouse model; B, Kaplan-Meier analysis of disease free survival (blue: Vector, n=11; red: shRNA against HVEM, n=19); C, qRT-PCR analysis for relative HVEM expression on murine lymphomas; D, FACS quantification of HVEM surface expression in mouse tumors (n = 5, mean ± SD, *p < 0.01); E, Tracking expression of the shHVEM/GFP construct in indicated mouse cell populations, HSCs indicates initial infection efficiency before injection into mouse, (n=5); F, Representative pathology and immunohistochemistry for control (vavPBcl2/vector) and HVEM deficient (vavPBcl2/shHVEM) lymphomas, scale bars = 100 μm; G, Immunoblots for indicated signaling molecules on control (vector) and HVEM deficient (shHVEM) lymphomas. (See also Figure S2, and Table S6).
Figure 3
Figure 3. BTLA deficiency recapitulates the effect of HVEM loss on lymphoma development in vivo
A, Kaplan-Meier analysis of disease free survival (blue: vector, n=11; red: shRNA against BTLA, n=16, p<0.01); B, qRT-PCR analysis of BTLA mRNA expression in control (vector) and BTLA (shBTLA) lymphomas; C, Pathological analysis of shBTLA tumors stained for representative sections including H&E, Ki67, PNA and BCL6, scale bars = 100 μm (control tumors are shown in Figure 2F); D, Quantification of Ki67 staining in shBTLA tumors (n=6, mean ± SD, *p<0.01); E, Surface analysis of vavPBcl2-vector and vavPBcl2-shBTLA tumors; F, Immunoblots for indicated signaling molecules on control (vector) and BTLA deficient (shBTLA) lymphomas. (See also Figure S3 and Table S6).
Figure 4
Figure 4. HVEM controls BCR signaling in lymphoma B cells
A and B, Quantification of FACS analysis of phosphorylated BTK (pBTK) expression in Bcl1 cells after stimulation with anti-IgM in the presence of solHVEM (10μg/ml) or ibrutinib (10nM) in parental Bcl1 cells (A) or in BTLA deficient (Bcl1 shBTLA) cells (B); C, Percent BCR inhibition of indicated signaling molecules upon treatment with the solHVEM or the solTNFRSF18 proteins (10μg/ml) (mean ± SD, *p<0.05); D, FACS analysis of BTLA expression in purified primary human FL B cells identifies samples with high (BTLAhi) and low (BTLAlo) surface BTLA expression; E, FACS analysis for the indicated signaling molecules in human primary FL B cells that were BTLAhi or BTLAlo and stimulated with anti-human IgG (3min; 10 μg/ml and H202 1mM) in the presence or absence of solHVEM (10 μg/ml). (See also Figure S4).
Figure 5
Figure 5. Lymphoid stroma activation in HVEM deficient lymphomas
A, Expression levels of stroma activating cytokines (LTα, LTβ, and TNFα) in B cells isolated from the spleens of vector and shHVEM mice (n=3, mean ± SD) by qRT-PCR; B-D, qRT-PCR expression analysis of TNFα (B), LTα (C), and LTβ (D) in Bcl1 cells 24h after treatment with solHVEM (10μg/ml); E, Immunohistofluorescence staining for the FDC marker CD21/35 and the FRC marker Collagen 1 on control lymphomas (vector) and HVEM knockdown lymphomas (shHVEM) (n=3, scale bars = 100 μm); F and G, Image quantification of CD21/35 (F) and collagen I (G) staining in control (Vector) and HVEM deficient (shHVEM) lymphomas based on 12 areas in the T-cell zone and 30 areas in the B cell zone per mice (cumulative number for 3 mice, * indicates p < 0.01 by parametric t-test; H and I, CXCL13 (H) and CCL19 (I) expression by qRT-PCR on control (vector) and HVEM knockdown (shHVEM) lymphomas (n=4, mean ± SD, * p< 0.05). (See also Figure S5).
Figure 6
Figure 6. Increased TFH cell recruitment in HVEM deficient lymphomas
A and B, Representative FACS measurement (A) and quantification (B) of intratumoral TFH cells in control (vector) and HVEM deficient (shHVEM) murine lymphomas (n=3, mean ± SD); C and D, qRT-PCR measurement of IL-21 (C), and IL-4 (D) in sorted intra-tumoral T cells (vector: n=4, shHVEM: n=5); E, qRT-PCR measurement of the LTα, LTβ, and TNFα mRNA expression in T cells isolated from the spleens of vector and shHVEM mice (mean ± SD, * p < 0.05); F-H, qRT-PCR measurement of TNFα (F), LTα (G), and LTβ (H) in sorted TFH cell cultures (n = 4) and cultured with anti-CD3/anti-CD28 antibodies in presence or absence of solHVEM (10 μg/ml); I, Quantification of TFH cells (PD1hi fraction of CD4+ cells) in human FL samples grouped by percentage of HVEM positive tumor cells: high (> 80% HVEM positive cells; n = 24), medium (20% - 80% positive cells; n = 105), and low (< 20% positive cells; n = 59), *indicates p < 0.05); J, Quantification of immunohistochemical stains for phosphorylated STAT6 in human FL TMA samples comparing HVEM high (n=24) and HVEM low/negative (n=59) tumors, * indicates p < 0.05. (See also Figure S6).
Figure 7
Figure 7. Restoring HVEM function for lymphoma therapy
A, Representative picture of in vivo treatment of engrafted Myc/Bcl2 murine lymphomas by intratumoral injection of solHVEM (10μg) or vehicle; B, quantification of tumor volume response data from treatment study as in (A), injection times indicated by arrows; C, Immunoblot on lysates from solHVEM or vehicle treated lymphomas probed; D, Microscopic pathology on solHVEM or vehicle treated lymphomas stained as indicated, scale bars = 100 μm; E, Schematic of the CAR-T (CD19/solHVEM) retroviral construct; F, SolHVEM expression by immunoblot on lysates from CD19-directed CAR-T cells (CAR-T/CD19) and solHVEM producing CAR-Ts (CAR-T/CD19/solHVEM); G, SolHVEM secretion into supernatant measured by ELISA from indicated CAR-T cell types; H and I, In vivo CAR-T treatment studies of xenografted DoHH2 lymphomas treated with a single intravenous injection of 105 CAR-T cells; CAR-T(4H11) target an unrelated prostate antigen, CART/CD19 are CD-19 directed CAR-T cells, CAR-T/CD19/solHVEM are the solHVEM producing CAR-T cells; (H) image of tumors collected 1 month after CAR-T treatment; (I) quantification of tumor volume responses at end of study; *indicated p < 0.05. (See also Figure S7).

Comment in

References

    1. Aguzzi A, Kranich J, Krautler NJ. Follicular dendritic cells: origin, phenotype, and function in health and disease. Trends Immunol. 2014;35:105–113. - PubMed
    1. Ame-Thomas P, Hoeller S, Artchounin C, Misiak J, Braza MS, Jean R, Le Priol J, Monvoisin C, Martin N, Gaulard P, et al. CD10 delineates a subset of human IL-4 producing follicular helper T cells involved in the survival of follicular lymphoma B cells. Blood. 2015;125:2381–2385. - PMC - PubMed
    1. Ame-Thomas P, Le Priol J, Yssel H, Caron G, Pangault C, Jean R, Martin N, Marafioti T, Gaulard P, Lamy T, et al. Characterization of intratumoral follicular helper T cells in follicular lymphoma: role in the survival of malignant B cells. Leukemia. 2012;26:1053–1063. - PMC - PubMed
    1. Ame-Thomas P, Maby-El Hajjami H, Monvoisin C, Jean R, Monnier D, Caulet-Maugendre S, Guillaudeux T, Lamy T, Fest T, Tarte K. Human mesenchymal stem cells isolated from bone marrow and lymphoid organs support tumor B-cell growth: role of stromal cells in follicular lymphoma pathogenesis. Blood. 2007;109:693–702. - PubMed
    1. Ame-Thomas P, Tarte K. The yin and the yang of follicular lymphoma cell niches: role of microenvironment heterogeneity and plasticity. Semin Cancer Biol. 2014;24:23–32. - PubMed

Publication types

MeSH terms

Substances