. 2016 Dec 8;128(23):2717-2728.
doi: 10.1182/blood-2016-03-707844. Epub 2016 Sep 30.

Inverse agonism at the P2Y12 receptor and ENT1 transporter blockade contribute to platelet inhibition by ticagrelor

Affiliations

Inverse agonism at the P2Y12 receptor and ENT1 transporter blockade contribute to platelet inhibition by ticagrelor

Riyaad Aungraheeta et al. Blood. .

Abstract

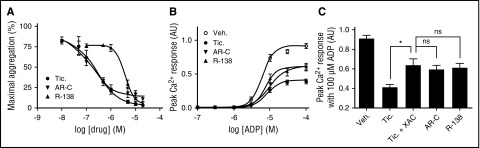
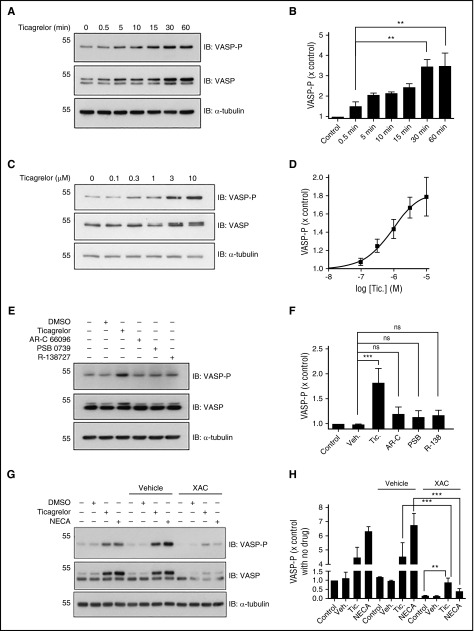
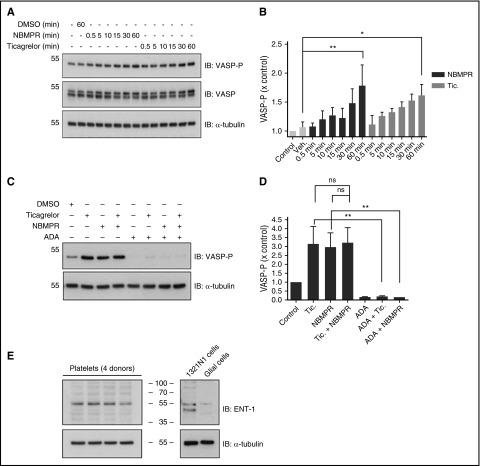
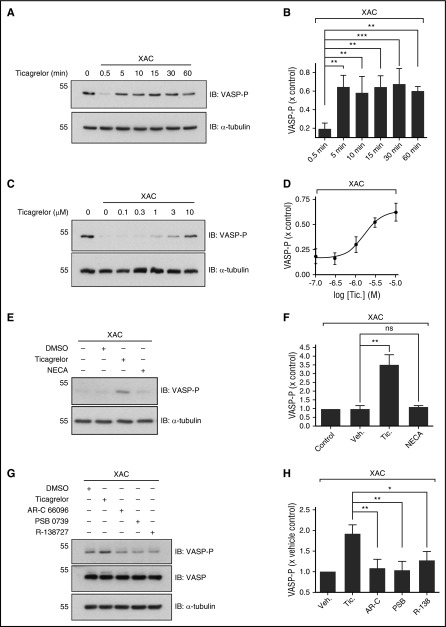
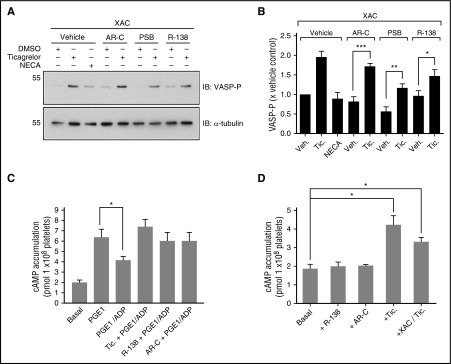
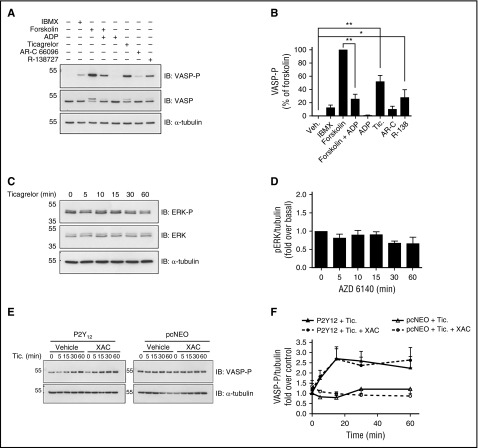
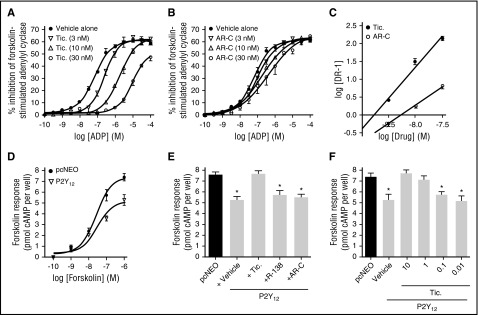
Ticagrelor is a potent antagonist of the P2Y12 receptor (P2Y12R) and consequently an inhibitor of platelet activity effective in the treatment of atherothrombosis. Here, we sought to further characterize its molecular mechanism of action. Initial studies showed that ticagrelor promoted a greater inhibition of adenosine 5'-diphosphate (ADP)-induced Ca2+ release in washed platelets vs other P2Y12R antagonists. This additional effect of ticagrelor beyond P2Y12R antagonism was in part as a consequence of ticagrelor inhibiting the equilibrative nucleoside transporter 1 (ENT1) on platelets, leading to accumulation of extracellular adenosine and activation of Gs-coupled adenosine A2A receptors. This contributed to an increase in basal cyclic adenosine monophosphate (cAMP) and vasodilator-stimulated phosphoprotein phosphorylation (VASP-P). In addition, ticagrelor increased platelet cAMP and VASP-P in the absence of ADP in an adenosine receptor-independent manner. We hypothesized that this increase originated from a direct effect on basal agonist-independent P2Y12R signaling, and this was validated in 1321N1 cells stably transfected with human P2Y12R. In these cells, ticagrelor blocked the constitutive agonist-independent activity of the P2Y12R, limiting basal Gi-coupled signaling and thereby increasing cAMP levels. These data suggest that ticagrelor has the pharmacological profile of an inverse agonist. Based on our results showing insurmountable inhibition of ADP-induced Ca2+ release and forskolin-induced cAMP, the mode of antagonism of ticagrelor also appears noncompetitive, at least functionally. In summary, our studies describe 2 novel modes of action of ticagrelor, inhibition of platelet ENT1 and inverse agonism at the P2Y12R that contribute to its effective inhibition of platelet activation.


Figures

Figure 1.
Figure 1.
ADP-induced platelet aggregation and intracellular Ca2+ release. (A) ADP (10 µM)–induced platelet aggregation in human PRP after 30-minute incubation at 30°C with ticagrelor (IC50 = 0.27 μM [0.14-0.51]; n = 3), AR-C 66096 (IC50 = 0.16 μM [0.08-0.33]; n = 4), or R-138727 (IC50 = 3.82 μM [3.03-4.82]; n = 6). The 95% confidence intervals for IC50 values are shown in square brackets. (B) ADP-induced Ca2+ peak responses in Fura-2 AM–loaded platelets in the presence of vehicle (n = 16) or 10 µM ticagrelor (n = 22), AR-C 66096 (n = 12), or R-138727 (n = 12). Baseline readings were recorded over a period of 5 cycles (each cycle ∼7 seconds) before ADP addition, after which recording was continued for a further 15 cycles. The peak Ca2+ response was determined by calculating the change in fluorescence ratio (340 nm/380 nm). (C) ADP (100 µM)–induced platelet peak Ca2+ responses in the presence of vehicle (0.1% DMSO), ticagrelor (10 µM), ticagrelor (10 µM) + XAC (10 µM), AR-C 66096 (10 µM), and R-138727 (10 µM). Data displayed as mean and standard error of the mean (SEM). *P < .05. IC50, 50% inhibitory concentration.
Figure 2.
Figure 2.
Time- and concentration-dependence of increases in platelet VASP-P. Representative immunoblots and bar/x-y charts showing VASP-P, VASP, and α-tubulin (internal control) levels in washed platelets after preincubation at 37°C with the following: (A-B) Ticagrelor (10 µM) for 0, 0.5, 5, 10, 15, 30, and 60 minutes; n = 5. (C-D) Vehicle (0.1% DMSO) and 0.1, 0.3, 1, 3, and 10 µM ticagrelor for 60 minutes; n = 5. (E-F) Untreated, vehicle (0.1% DMSO), ticagrelor (10 µM), AR-C 66096 (10 µM), PSB 0739 (10 µM), and R-138727 (10 µM) for 60 minutes; n = 4. (G-H) Untreated, vehicle (0.1% DMSO), ticagrelor (10 µM), and NECA (µM) for 60 minutes following preincubation at 37°C for 30 minutes with untreated, vehicle (0.1% DMSO), or XAC (1 µM); n = 6. Data displayed as mean and SEM. **P < .01; ***P < .001; ns, P > .05. Statistical analysis used was 2-way ANOVA (H). Kilodaltons of molecular size markers are reported on the left.
Figure 3.
Figure 3.
Role for platelet-expressed ENT1 in the ticagrelor-induced increase in platelet VASP-P. Representative immunoblots and bar charts showing VASP-P, VASP, and α-tubulin (internal control) levels in washed platelets after incubation at 37°C with the following: (A-B) No drug, vehicle (0.1% DMSO for 60 minutes), NBMPR (1 µM for 0.5, 5, 10, 15, 30, and 60 minutes), or ticagrelor (10 µM for 0.5, 5, 10, 15, 30, and 60 minutes); n = 5. (C-D) Vehicle (0.1% DMSO), ticagrelor (10 µM), NBMPR (1 µM), ticagrelor (10 µM) + NBMPR (1 µM), ADA (10 µg/mL), ADA (10 µg/mL) + ticagrelor (10 µM), and ADA + NBMPR (1 µM); n = 3. (E) Immunoblots showing expression of ENT1 in platelets and 1321N1 cells, with rat glial cells as negative control. Figure is representative of 3 replicates. Data displayed as mean and SEM. *P < .05; **P < .01; ns, P > .05. Statistical test used was 2-way ANOVA (B). Kilodaltons of molecular size markers are reported on the left or in the middle for panel E.
Figure 4.
Figure 4.
Identification of an adenosine receptor-independent component of the ticagrelor-induced increase in platelet VASP-P and cAMP. Representative immunoblots and bar/x-y charts showing VASP-P, VASP, and α-tubulin (loading control) levels in washed platelets after incubation at 37°C with the following: (A-B) Vehicle (0.1% DMSO for 60 minutes) or 10 µM ticagrelor for 0.5, 5, 10, 15, 30, and 60 minutes following preincubation of all samples (except vehicle control) with XAC (10 µM, at 37°C) for 90 minutes; n = 3. (C-D) Vehicle (0.1% DMSO), 0.1, 0.3, 1, 3, and 10 µM ticagrelor for 60 minutes following preincubation of all samples (except vehicle control) with XAC (10 µM at 37°C) for 90 minutes; n = 5. (E-F) No drug, vehicle (0.1% DMSO), ticagrelor (10 µM), and NECA (1 µM) for 60 minutes following preincubation of all samples (except vehicle control) with XAC (10 µM at 37°C) for 90 minutes; n = 5. (G-H) Vehicle (0.1% DMSO), ticagrelor (10 µM), AR-C 66096 (10 µM), PSB 0739 (10 µM), and R-138727 (10 µM) for 60 minutes. *P < .05; **P < .01; ***P < .001; ns, P > .05. Kilodaltons of molecular size markers are shown on left of blots.
Figure 5.
Figure 5.
Ticagrelor-mediated, adenosine receptor–independent increases in platelet VASP-P in the presence of other P2Y12 antagonists. (A-B) Representative immunoblots and bar charts showing VASP-P, VASP, and α-tubulin (internal control) levels in washed platelets after incubation (60 minutes) at 37°C with vehicle (0.1% DMSO), ticagrelor (10 µM), or NECA (1 µM). Preincubation conditions were either vehicle (0.1% DMSO) + XAC (10 µM), AR-C 66096 (10 µM) + XAC (10 µM), PSB 0739 (10 µM) + XAC (10 µM), or R-138727 (10 µM) + XAC (10 µM), all at 37°C for 30 minutes; n = 7. (C-D) cAMP accumulation in washed platelets. (C) Platelets were preincubated with either ticagrelor, AR-C 66096, and R-138727 (all at 10 μM; 60 minutes) or vehicle control. Platelets were stimulated with PGE1 (1 μM; 10 minutes) in the absence or presence of ADP (10 μM). (D) Effect of antagonists on basal cAMP levels. Incubation (60 minutes) at 37°C with vehicle (0.1% DMSO), ticagrelor (10 µM), PSB 0739 (10 µM), or R-138727 (10 µM) for 60 minutes and preincubation with XAC (10 μM; 60 minutes). All bar charts display mean and SEM. Statistical test used was 2-way ANOVA (excluding NECA data) (B). *P < .05; **P < .01; ***P < .001. Kilodaltons of molecular size markers are shown on blots.
Figure 6.
Figure 6.
Ticagrelor-mediated adenosine receptor-independent increases in VASP-P in 1321N1 cells expressing P2Y12R. Representative immunoblots and bar/x-y charts showing the following: (A-B) VASP-P, VASP, and α-tubulin (internal control) levels in P2Y12-transfected 1321N1 cells incubated with phosphodiesterase inhibitor IBMX (100 µM), adenylyl cyclase activator forskolin (100 nM), forskolin (100 nM) + ADP (10 µM), ADP (10 µM), ticagrelor (10 µM), AR-C 66096 (10 µM), or R-138727 (10 µM) for 5 minutes at 37°C; n = 5. (C-D) Extracellular signal–regulated kinases (ERK)-P, ERK, and α-tubulin (internal control) levels in P2Y12-transfected 1321N1 cells incubated with ticagrelor for 0, 5, 10, 15, 30, and 60 minutes, at 37°C; n = 5 (E-F) VASP-P and α-tubulin (internal control) levels in P2Y12-transfected (E, left) and vehicle vector pcNEO-transfected (E, right) 1321N1 cells, both preincubated with either XAC (1 µM) or vehicle (0.1% DMSO) for 15 minutes at 37°C before incubation with ticagrelor (10 µM) for 0, 5, 15, 30, and 60 minutes at 37°C. All bar/x-y charts display mean and SEM. Statistical test used was 2-way ANOVA (D). *P < .05; **P < .01. Kilodaltons of molecular size markers are reported on the left.
Figure 7.
Figure 7.
Ticagrelor-mediated attenuation of agonist-dependent and agonist-independent P2Y12R activity in 1321N1 cells. Inhibition of forskolin (1 µM; 10 minutes)–induced cAMP production by ADP (0.1 nM-100 µM; 10 minutes) in P2Y12R-transfected 1321N1 cells after preincubation with ticagrelor (3-30 nM; 15 minutes) (A) or AR-C 66096 (AR-C; 3-30 nM; 15 minutes) (B); n = 5. (C) Schild-plot analysis of data from panels A and B. (D) Forskolin (0.1 nM-1 µM; 10 minutes)–induced increases in cAMP levels in pcNEO-transfected and P2Y12R-transfected 1321N1 cells. (E) Forskolin (1 µM; 10 minutes)–induced cAMP production in pcNEO-transfected and P2Y12-transfected cells incubated with vehicle (0.1% DMSO), ticagrelor (10 µM), AR-C 66096 (10 µM), or R-138727 (10 µM) for 30 minutes. (F) Forskolin (1 µM; 10 minutes)–induced cAMP after preincuabtion with vehicle (0.1% DMSO) or ticagrelor (0.01 µM-10 μM; 30 minutes) in P2Y12R-transfected cells; n = 5. All graphs and bar charts display mean ± SEM. All cells were incubated with 0.2 U/mL apyrase (37°C; 60 minutes) prior to drug additions. *P < .05 vs pcNEO controls.

Comment in

References

    1. Pagidipati NJ, Gaziano TA. Estimating deaths from cardiovascular disease: a review of global methodologies of mortality measurement. Circulation. 2013;127(6):749-756. - PMC - PubMed
    1. Wallentin L, Becker RC, Budaj A, et al. ; PLATO Investigators. Ticagrelor versus clopidogrel in patients with acute coronary syndromes. N Engl J Med. 2009;361(11):1045-1057. - PubMed
    1. Wiviott SD, Braunwald E, McCabe CH, et al. ; TRITON-TIMI 38 Investigators. Prasugrel versus clopidogrel in patients with acute coronary syndromes. N Engl J Med. 2007;357(20):2001-2015. - PubMed
    1. Van Giezen JJJ, Nilsson L, Berntsson P, et al. . Ticagrelor binds to human P2Y(12) independently from ADP but antagonizes ADP-induced receptor signaling and platelet aggregation. J Thromb Haemost. 2009;7(9):1556-1565. - PubMed
    1. Paoletta S, Sabbadin D, von Kügelgen I, et al. . Modeling ligand recognition at the P2Y12 receptor in light of X-ray structural information. J Comput Aided Mol Des. 2015;29(8):737-756. - PMC - PubMed

MeSH terms