. 2016 Dec;112(3):702-713.
doi: 10.1093/cvr/cvw217. Epub 2016 Sep 30.

Role of lipid phosphate phosphatase 3 in human aortic endothelial cell function

Affiliations

Role of lipid phosphate phosphatase 3 in human aortic endothelial cell function

Zahia Touat-Hamici et al. Cardiovasc Res. 2016 Dec.

Abstract

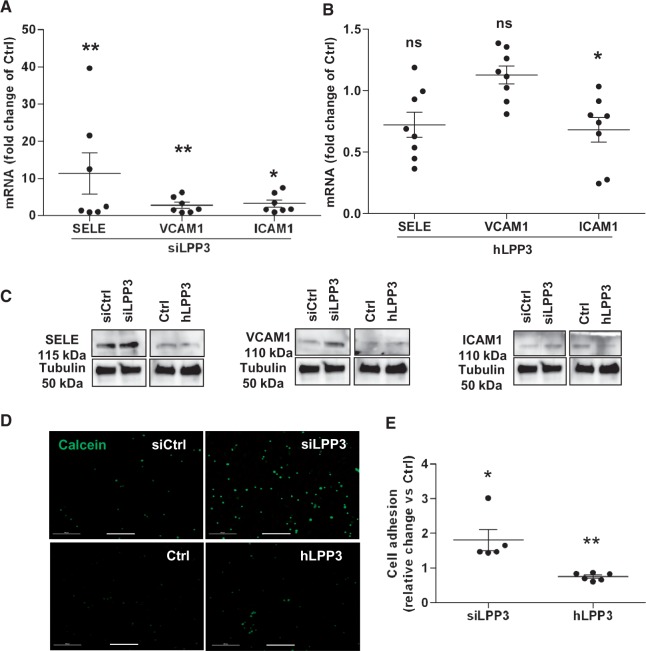
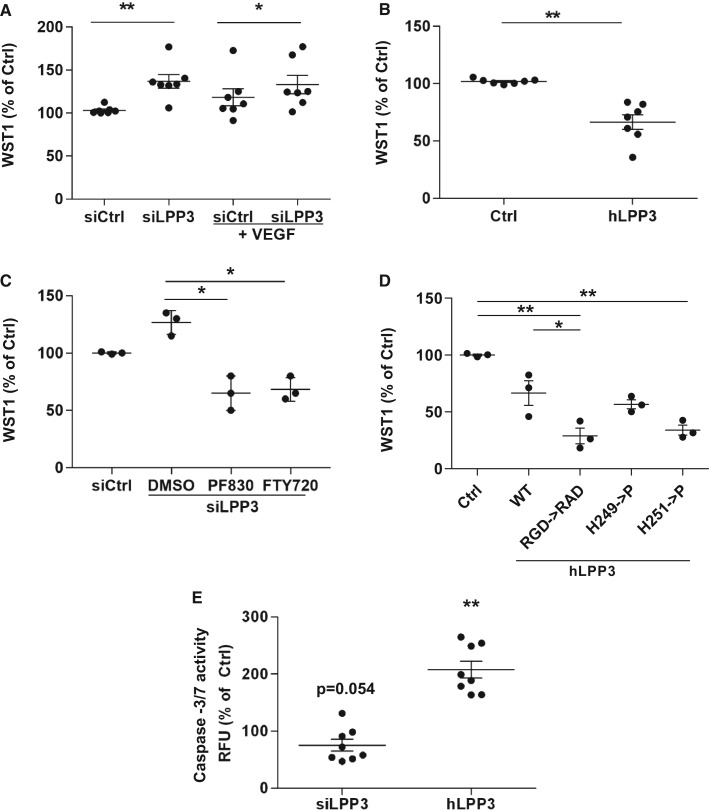
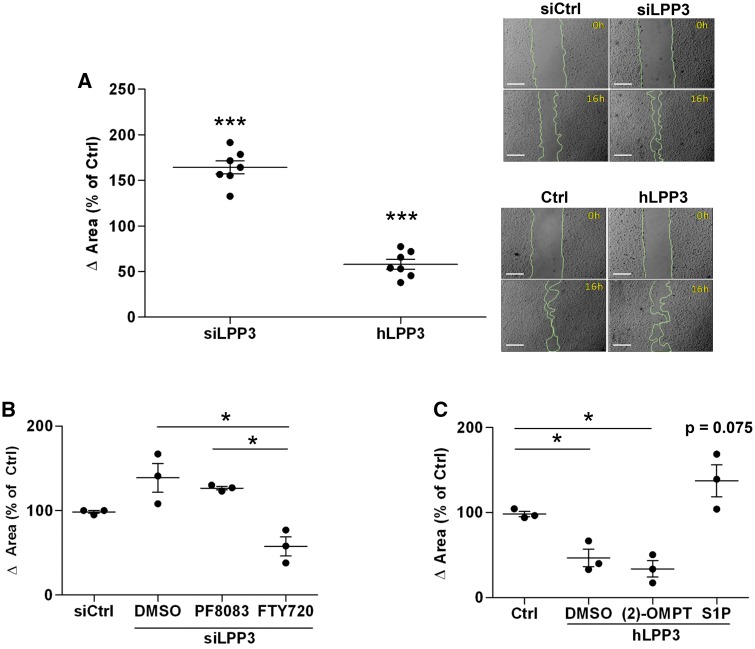
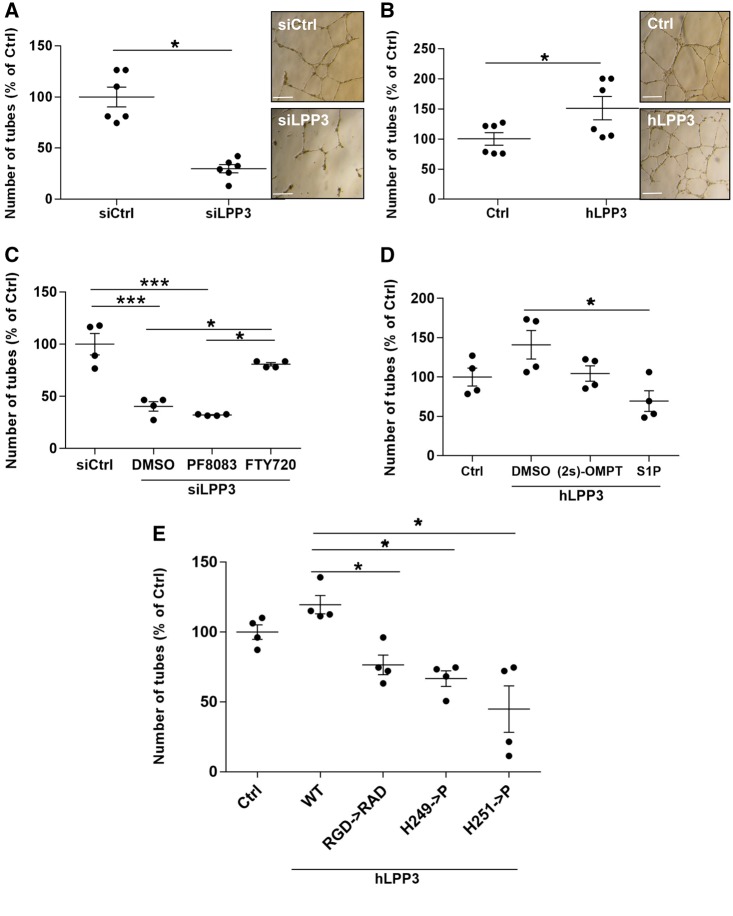
Aims: Lipid phosphate phosphatase 3; type 2 phosphatidic acid phosphatase β (LPP3; PPAP2B) is a transmembrane protein dephosphorylating and thereby terminating signalling of lipid substrates including lysophosphatidic acid (LPA) and sphingosine-1-phosphate (S1P). Human LPP3 possesses a cell adhesion motif that allows interaction with integrins. A polymorphism (rs17114036) in PPAP2B is associated with coronary artery disease, which prompted us to investigate the possible role of LPP3 in human endothelial dysfunction, a condition promoting atherosclerosis.

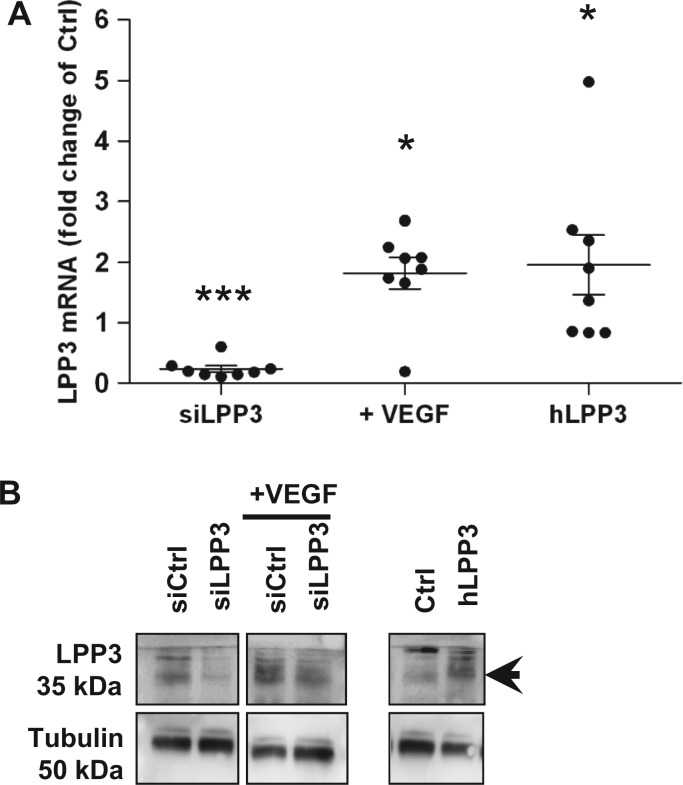
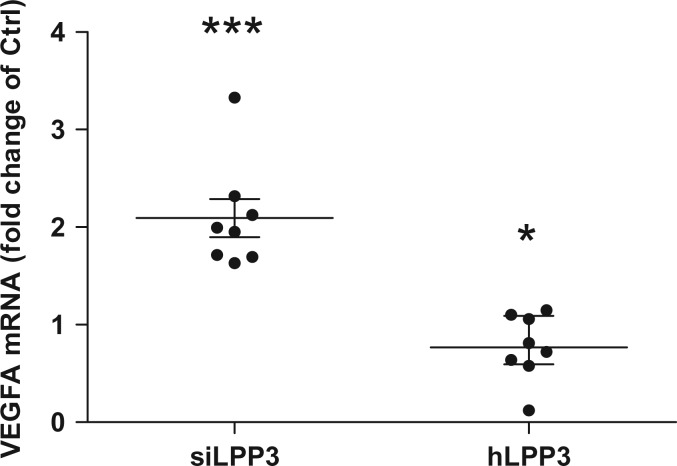
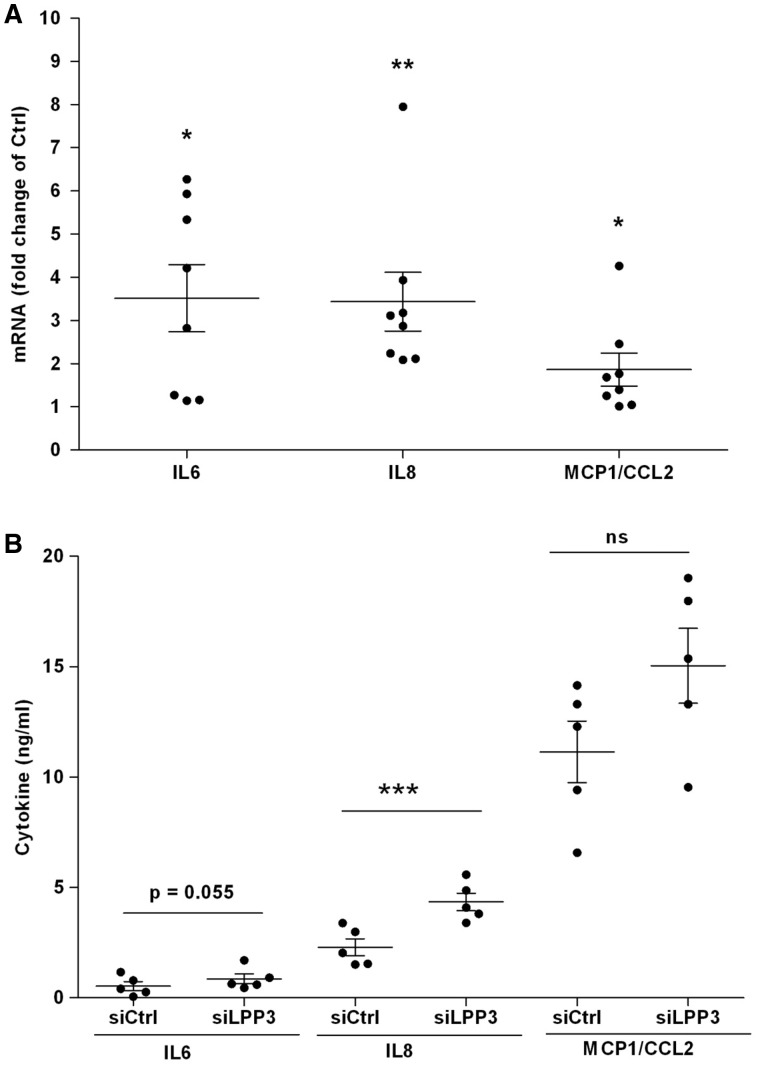
Methods and results: To study the role of LPP3 in endothelial cells we used human primary aortic endothelial cells (HAECs) in which LPP3 was silenced or overexpressed using either wild type or mutated cDNA constructs. LPP3 silencing in HAECs enhanced secretion of inflammatory cytokines, leucocyte adhesion, cell survival, and migration and impaired angiogenesis, whereas wild-type LPP3 overexpression reversed these effects and induced apoptosis. We also demonstrated that LPP3 expression was negatively correlated with vascular endothelial growth factor expression. Mutations in either the catalytic or the arginine-glycine-aspartate (RGD) domains impaired endothelial cell function and pharmacological inhibition of S1P or LPA restored it. LPA was not secreted in HAECs under silencing or overexpressing LPP3. However, the intra- and extra-cellular levels of S1P tended to be correlated with LPP3 expression, indicating that S1P is probably degraded by LPP3.

Conclusions: We demonstrated that LPP3 is a negative regulator of inflammatory cytokines, leucocyte adhesion, cell survival, and migration in HAECs, suggesting a protective role of LPP3 against endothelial dysfunction in humans. Both the catalytic and the RGD functional domains were involved and S1P, but not LPA, might be the endogenous substrate of LPP3.

Keywords: Angiogenesis; Apoptosis; Atherosclerosis; Endothelial dysfunction.


Figures

Figure 1
Figure 1
Modulation of lipid phosphate phosphatase 3 (LPP3) expression in HAECs. HAECs were transfected for 48 h with either siRNA (siCtrl or siLPP3) or with the expression plasmids (Ctrl or hLPP3); siCtrl transfected cells were treated or not with 100 nM VEGF for additional 24 h (A). The level of LPP3 mRNA was determined by RT–qPCR. The results (mean of duplicate measurements) are shown as relative LPP3 mRNA levels as compared with individual respective controls set at 1, each dot within vertical scatter plots represents a single donor (n = 8); the mean +/− standard error of mean (SEM) is depicted. *P < 0.05, ***P < 0.0001. Lysates from HAECs transfected either with siLPP3 or siCtrl (treated or not with VEGF) and either hLPP3 expression plasmids or Ctrl plasmids were analysed by immunoblotting using a rabbit polyclonal anti-LPP3 antibody and re-probed with anti-tubulin antibody to ensure equal loading and transfer. Immunoblot from one representative experiment out of two is shown (B).
Figure 2
Figure 2
LPP3 down-regulates VEGF expression in HAECs. HAECs were transfected with either siRNA (siCtrl or siLPP3) or with hLPP3 expression plasmids (Ctrl or LPP3) for 48 h. The level of VEGF mRNA was determined by RT–qPCR. The results (mean of duplicate measurements) are shown as relative VEGF mRNA levels as compared with individual respective controls set at 1, each dot within vertical scatter plots represents a single donor (n = 8); the mean +/− SEM is depicted. *P < 0.05, ***P < 0.0001.
Figure 3
Figure 3
siLPP3 up-regulates the expression of pro-inflammatory mediators in HAECs. HAECs were transfected with siRNA (siCtrl or siLPP3) for 48 h. mRNA relative levels of IL6, IL8, and MCP1 were determined by RT–qPCR (A). The results (mean of duplicates) are shown as relative mRNA levels as compared with individual respective controls set at 1, each dot within vertical scatter plots represents a single donor (n = 8); the mean +/− SEM is depicted. The IL6, IL8, and MCP1 concentrations were determined in supernatants of HAECs cultured for 24 h in serum-free media using ELISA (B). The results (mean of triplicates) are shown, each dot within vertical scatter plots represents a single donor (n = 5); the mean +/− SEM is depicted. *P < 0.05, **P < 0.001, ***P < 0.0001. In panel B we also give the P-value of 0.055 for IL6 to show the trend.
Figure 4
Figure 4
Correlation between PPAP2B/LPP3 expression and other genes for the AA and AG genotypes. (A) Circle plots of the correlations. Edges are coloured in red/blue for positive/negative correlations, respectively, and are weighted according to the correlation value. (B) Statistical comparison of the correlation coefficients between the two genotypes (red, positive and green, negative correlation). Values of the correlations are reported for each genotype, with the P-value into brackets. The P-value related to the comparison tests is given in the last column.
Figure 5
Figure 5
LPP3 down-regulates leucocyte recruitment to HAEC monolayers. HAECs were transfected with siRNA (siCtrl or siLPP3) or with hLPP3 expression plasmids (Ctrl or LPP3) for 48 h. mRNA relative levels of adhesion molecules SELE, VCAM-1, and ICAM-1 were determined by RT–qPCR (A, B). The results (mean of duplicates) are shown as relative mRNA levels as compared with individual respective controls set at 1, each dot within vertical scatter plots represents a single donor (n = 7–8); the mean +/− SEM is depicted. Lysates were analysed by immunoblotting with specific antibodies and re-probed with an anti-tubulin antibody (the SELE membrane) to ensure equal loading and transfer (C). Leucocyte adhesion was assessed using a hPBMC adhesion assay as described in Methods. HAECs were transfected with either siRNA (siCtrl or siLPP3) or with hLPP3 expression plasmids (Ctrl or LPP3) for 48 h, and then incubated with calcein-AM labelled hPBMC. Images of fluorescent cells were captured with an epi-fluorescence microscope (D) and the adherent cells were quantified by automated counting using ImageJ and represented as a relative change over the control (E). The results (mean of duplicates) are shown, each dot within vertical scatter plots represents a single leucocyte donor (n = 5–6) tested on three HAECs donors; the mean +/− SEM is depicted. *P < 0.05, **P < 0.001. Bar scale in panel D indicates 500 µm.
Figure 6
Figure 6
LPP3 affects viability of HAECs. HAECs were transfected with either siRNA (siCtrl or siLPP3) (A) or with hLPP3 expression plasmids (Ctrl or LPP3) (B) for 48 h. Cell viability was measured using the WST-1 assay and the results (percentage of respective controls; mean of duplicates) are shown, each dot within vertical scatter plots represents a single donor (n = 7); the mean +/− SEM is depicted. To show the variability of controls each point was calculated as percentage of the mean of controls set as 100%. HAECs transfected with either siLPP3 or siCtrl were treated with inhibitors of either LPA formation (PF8380) or S1P receptor (FTY720) (C). HAECs transfected with Ctrl- or LPP3-containing plasmids were treated with LPA mimic [(2S)-OMPT] or S1P (D). HAECs were transfected with either control plasmids, WT LPP3, or with mutants of the catalytic domain (H249P or H251P) or of the adhesion motif (RGD->RAD), subsequently the WST-1 assays were performed. The results (mean of triplicates) in panels C, D, and E (percentage of respective controls) are shown, each dot within vertical scatter plots represents a single donor (n = 3); the mean +/− SEM is depicted. Caspase-3 and -7 activity was assessed using Apo-ONE® Homogeneous Caspase-3/7 Assay (F) and the relative fluorescence was measured using a microplate reader. The results (mean of duplicates) are shown as percentage of respective controls set at 100%, each dot within vertical scatter plots represents a single donor (n = 8); the mean +/− SEM is depicted. *P < 0.05, **P < 0.001. When more than three groups were compared a global P-value is: panel A, P = 0.006; panel C, P = 0.08; panel D, P = 0.04. In panel A we also give the P-value of 0.072 for si Ctrl vs siCtrl + VEGF and in panel E the P = 0.054 for siLPP3 to show the trend.
Figure 7
Figure 7
LPP3 down-regulates HAECs migration. HAECs were transfected with either siRNA (siCtrl or siLPP3) or with hLPP3 expression plasmids (Ctrl or LPP3) for 48 h. Cell monolayers were wounded with 1000 µL pipette tips (right panel) and incubated for 16 h to assess cell migration. Wounded areas were imaged at 0 and 16 h. Results expressed in percentage of the respective controls (mean of duplicates) are shown, each dot within vertical scatter plots represents a single donor (n = 7); the mean +/− SEM is depicted (A). Bar scale in micrographs in panel A indicates 500 µm. siLPP3 and siCtrl transfected HAECs were treated with inhibitors of either LPA formation (PF8380) or S1P receptor (FTY720) (B). LPP3-containing plasmid or Ctrl plasmid transfected cells were treated with LPA mimics [(2S)-OMPT] or S1P (C). The results (mean of duplicates) in panel B and C are shown, each dot within vertical scatter plots represents a single donor (n = 3); the mean +/− SEM is depicted. To show the variability of controls each point was calculated as percentage of the mean of individual controls set as 100%. *P< 0.05, ***P< 0.0001. In panel C we give the P-value of 0.075 to show the trend. When more than three groups were compared a global P-value is: panel B, P = 0.02; panel C, P = 0.03
Figure 8
Figure 8
LPP3 is a positive regulator of angiogenesis. HAECs were transfected with either siRNA (siCtrl or siLPP3) (A) or with hLPP3 expression plasmids (Ctrl or LPP3) (B) for 48 h. Cells were harvested and seeded on Matrigel and incubated for an additional 48 h. Microphotographs of cultures were taken at 24 h and angiogenesis was quantified by counting the tube-like and branching point structures, using an automated ImageJ program. Bar scale in panel A and B indicates 500 µm. siLPP3 and siCtrl transfected HAECs were treated with inhibitors of either LPA formation (PF8380) or S1P receptor (FTY720) (C). HAECs transfected with either hLPP3 expression plasmids or Ctrl plasmids were treated with LPA mimics [(2S)-OMPT] or S1P (D). HAECs were transfected with control plasmid, wild-type LPP3 or mutants of the catalytic domain (H249P or H251P) or the adhesion motif RGD->RAD (E). The results expressed as percentage of respective controls (mean of duplicates) are shown, each dot within vertical scatter plots represents a single donor (n = 4–6); the mean +/− SEM is depicted. To show the variability of controls each point was calculated as percentage of the mean of individual controls set as 100%. *P < 0.05, ***P < 0.0001. When more than three groups were compared a global P-value is: panel C, P = 0.0002; panel D, P = 0.06, and panel E, P = 0.0004.

References

    1. Hopkins PN. Molecular biology of atherosclerosis. Physiol Rev 2013;93:1317–1542. - PubMed
    1. Schunkert H, König IR, Kathiresan S, Reilly MP, Assimes TL, Holm H, Preuss M, Stewart AFR, Barbalic M, Gieger C, Absher D, Aherrahrou Z, Allayee H, Altshuler D, Anand SS, Andersen K, Anderson JL, Ardissino D, Ball SG, Balmforth AJ, Barnes TA, Becker DM, Becker LC, Berger K, Bis JC, Boekholdt SM, Boerwinkle E, Braund PS, Brown MJ, Burnett MS, Buysschaert I, Cardiogenics, Carlquist JF, Chen L, Cichon S, Codd V, Davies RW, Dedoussis G, Dehghan A, Demissie S, Devaney JM, Diemert P, Do R, Doering A, Eifert S, Mokhtari NE, Ellis SG, Elosua R, Engert JC, Epstein SE, de Faire U, Fischer M, Folsom AR, Freyer J, Gigante B, Girelli D, Gretarsdottir S, Gudnason V, Gulcher JR, Halperin E, Hammond N, Hazen SL, Hofman A, Horne BD, Illig T, Iribarren C, Jones GT, Jukema JW, Kaiser MA, Kaplan LM, Kastelein JJ, Khaw KT, Knowles JW, Kolovou G, Kong A, Laaksonen R, Lambrechts D, Leander K, Lettre G, Li M, Lieb W, Loley C, Lotery AJ, Mannucci PM, Maouche S, Martinelli N, McKeown PP, Meisinger C, Meitinger T, Melander O, Merlini PA, Mooser V, Morgan T, Mühleisen TW, Muhlestein JB, Münzel T, Musunuru K, Nahrstaedt J, Nelson CP, Nöthen MM, Olivieri O, Patel RS, Patterson CC, Peters A, Peyvandi F, Qu L, Quyyumi AA, Rader DJ, Rallidis LS, Rice C, Rosendaal FR, Rubin D, Salomaa V, Sampietro ML, Sandhu MS, Schadt E, Schäfer A, Schillert A, Schreiber S, Schrezenmeir J, Schwartz SM, Siscovick DS, Sivananthan M, Sivapalaratnam S, Smith A, Smith TB, Snoep JD, Soranzo N, Spertus JA, Stark K, Stirrups K, Stoll M, Tang WH, Tennstedt S, Thorgeirsson G, Thorleifsson G, Tomaszewski M, Uitterlinden AG, van Rij AM, Voight BF, Wareham NJ, Wells GA, Wichmann HE, Wild PS, Willenborg C, Witteman JC, Wright BJ, Ye S, Zeller T, Ziegler A, Cambien F, Goodall AH, Cupples LA, Quertermous T, März W, Hengstenberg C, Blankenberg S, Ouwehand WH, Hall AS, Deloukas P, Thompson JR, Stefansson K, Roberts R, Thorsteinsdottir U, O'Donnell CJ, McPherson R, Erdmann J, CARDIoGRAM Consortium, Samani NJ. Large-scale association analysis identifies 13 new susceptibility loci for coronary artery disease. Nat Genet 2011;43:333–338. - PMC - PubMed
    1. Erbilgin A, Civelek M, Romanoski CE, Pan C, Hagopian R, Berliner JA, Lusis AJ. Identification of CAD candidate genes in GWAS loci and their expression in vascular cells. J Lipid Res 2013;54:1894–1905. - PMC - PubMed
    1. Wu C, Huang R-T, Kuo C-H, Kumar S, Kim CW, Lin Y-C, Chen Y-J, Birukova A, Birukov KG, Dulin NO, Civelek M, Lusis AJ, Loyer X, Tedgui A, Dai G, Jo H, Fang Y. Mechanosensitive PPAP2B regulates endothelial responses to atherorelevant hemodynamic forces. Circ Res 2015;117:e41–e53. - PMC - PubMed
    1. Reschen ME, Gaulton KJ, Lin D, Soilleux EJ, Morris AJ, Smyth SS, O’Callaghan CA. Lipid-induced epigenomic changes in human macrophages identify a coronary artery disease-associated variant that regulates PPAP2B expression through altered C/EBP-beta binding. PLoS Genet 2015;11:e1005061. - PMC - PubMed

MeSH terms