. 2016 Oct 18;113(42):E6457-E6466.
doi: 10.1073/pnas.1614529113. Epub 2016 Sep 30.

Activation of Notch1 synergizes with multiple pathways in promoting castration-resistant prostate cancer

Affiliations

Activation of Notch1 synergizes with multiple pathways in promoting castration-resistant prostate cancer

Tanya Stoyanova et al. Proc Natl Acad Sci U S A. .

Abstract

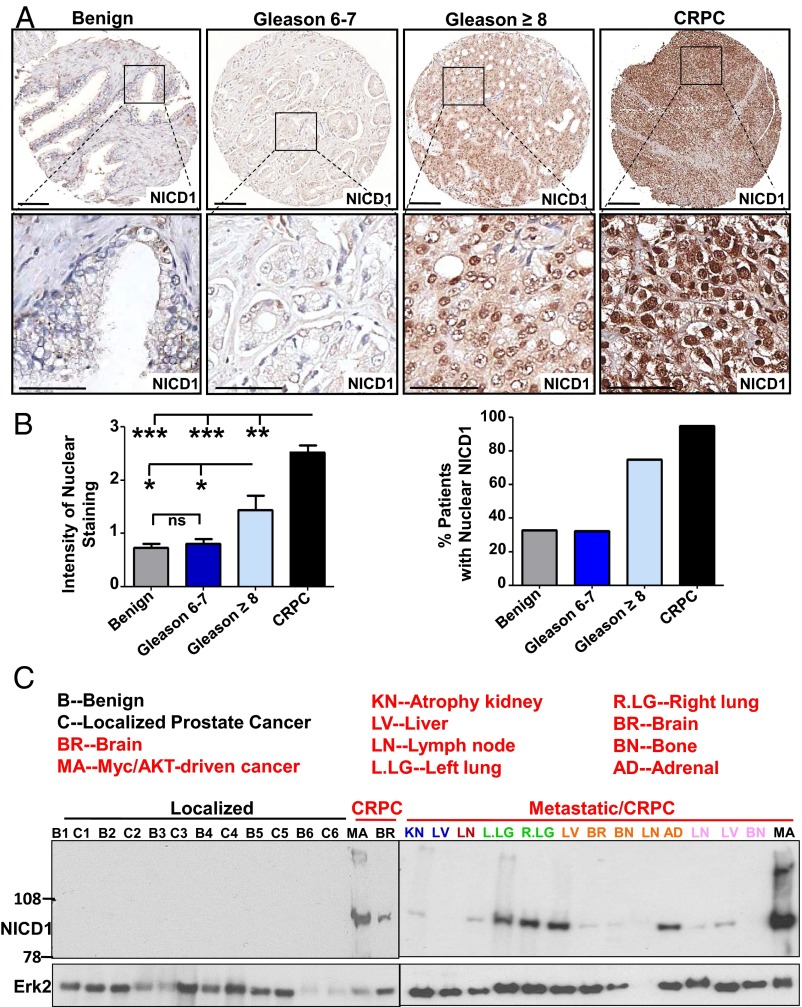
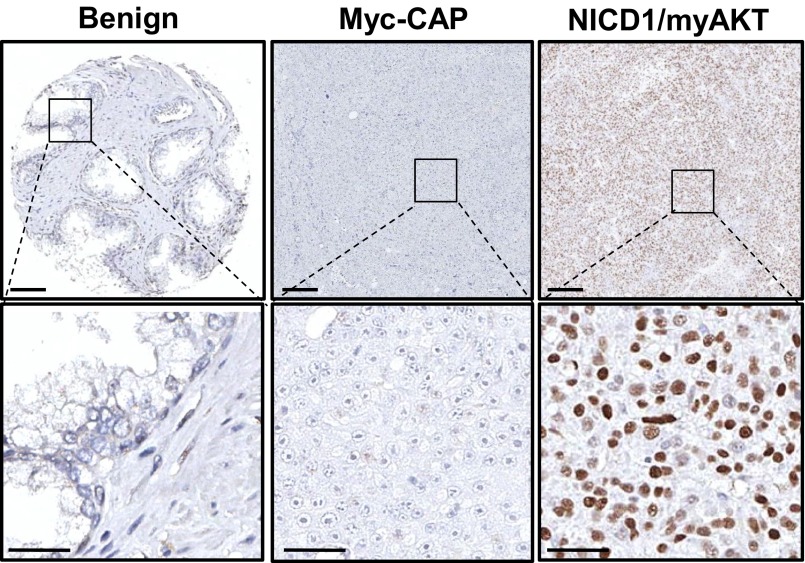
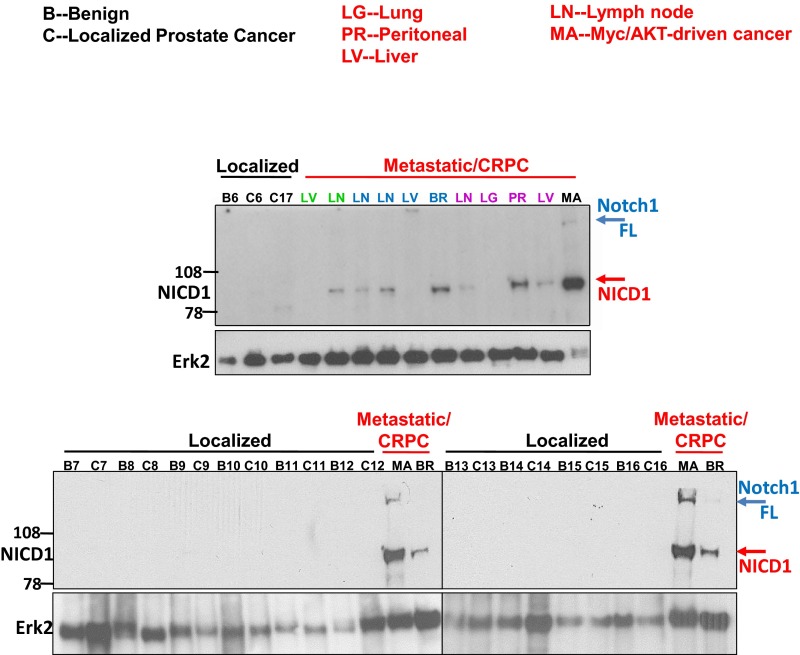
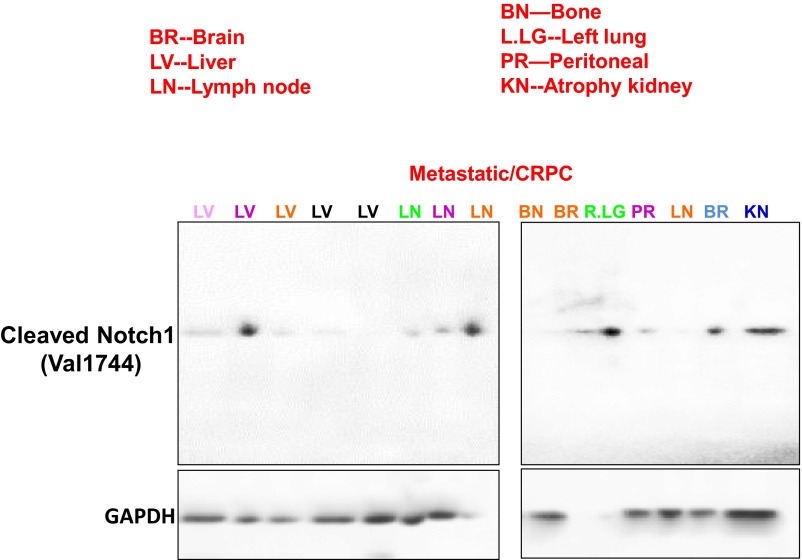
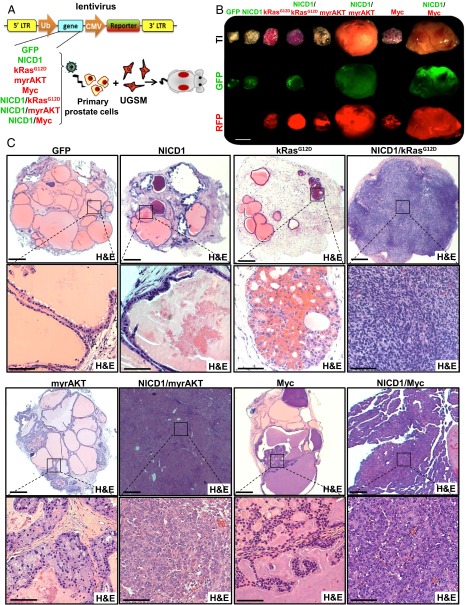
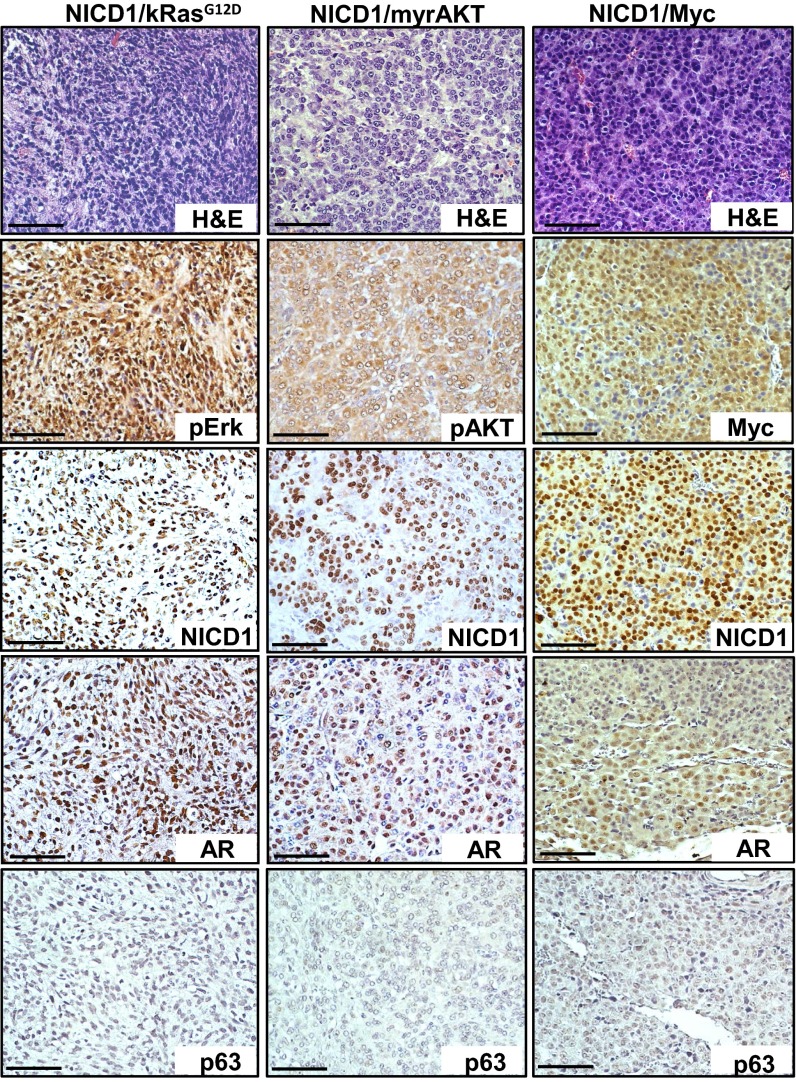
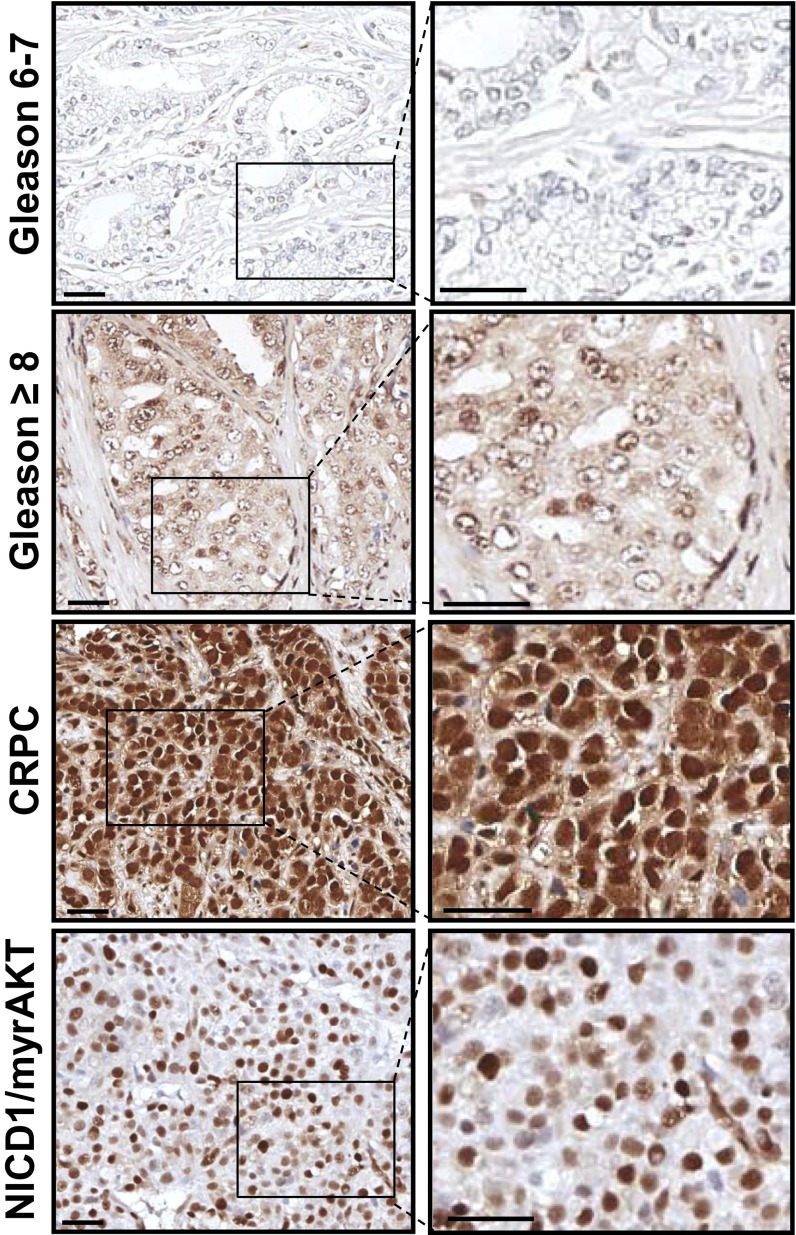
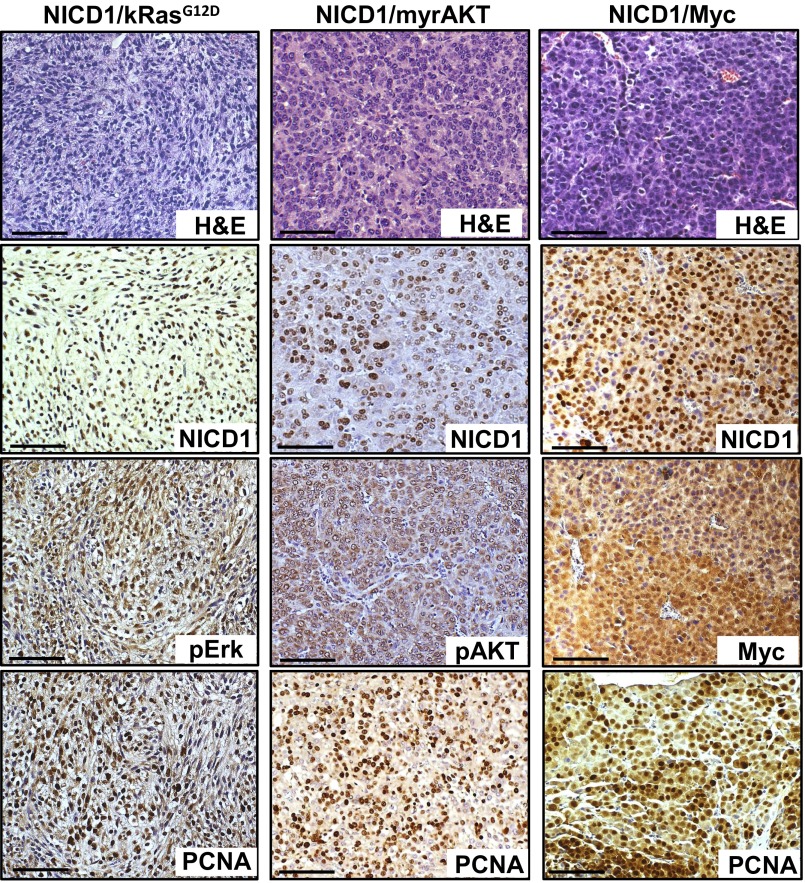
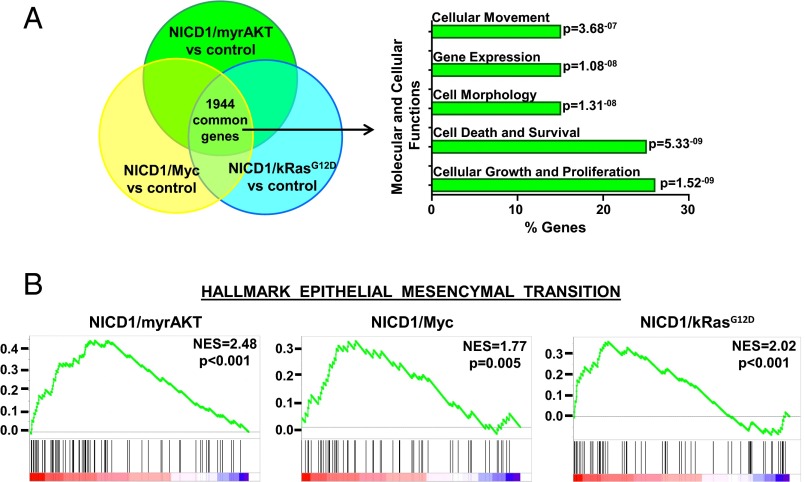
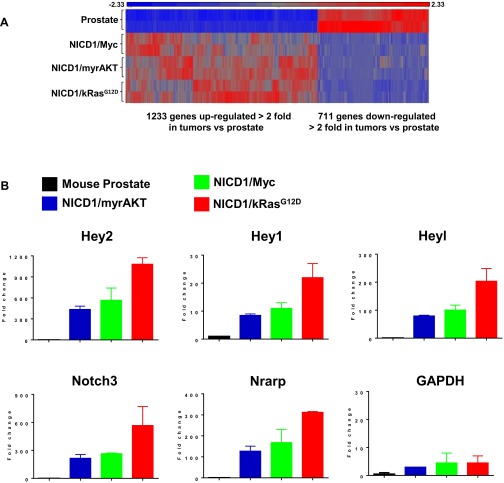
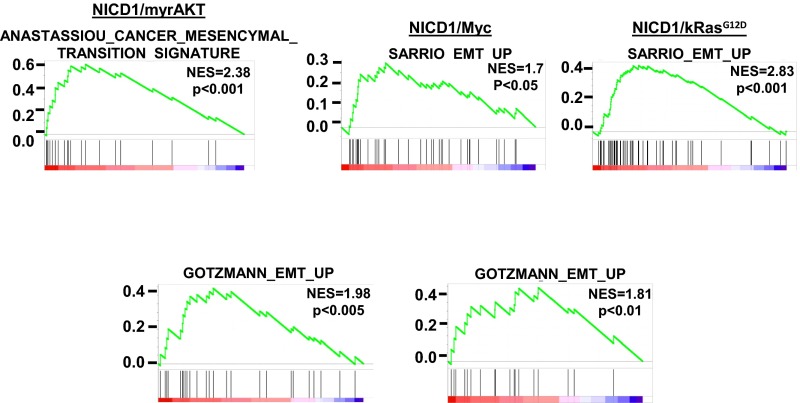
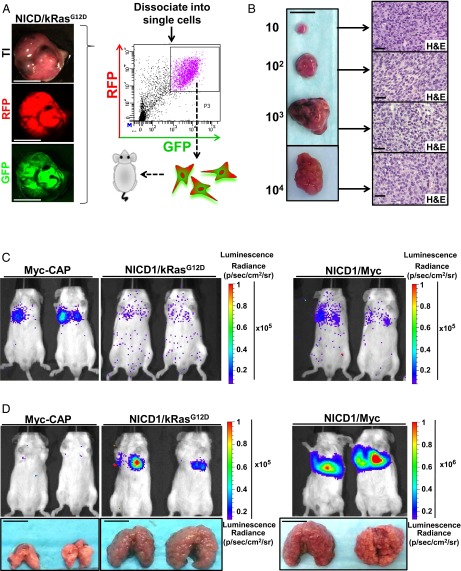
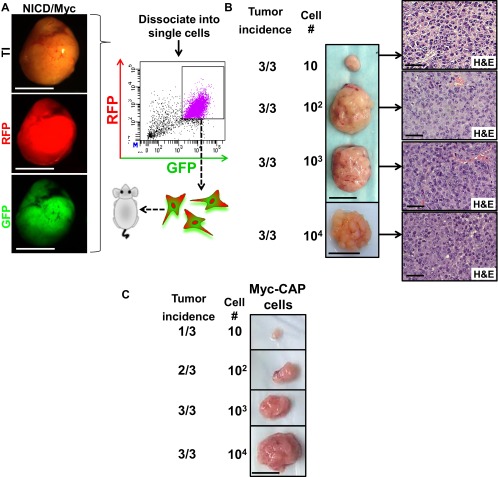
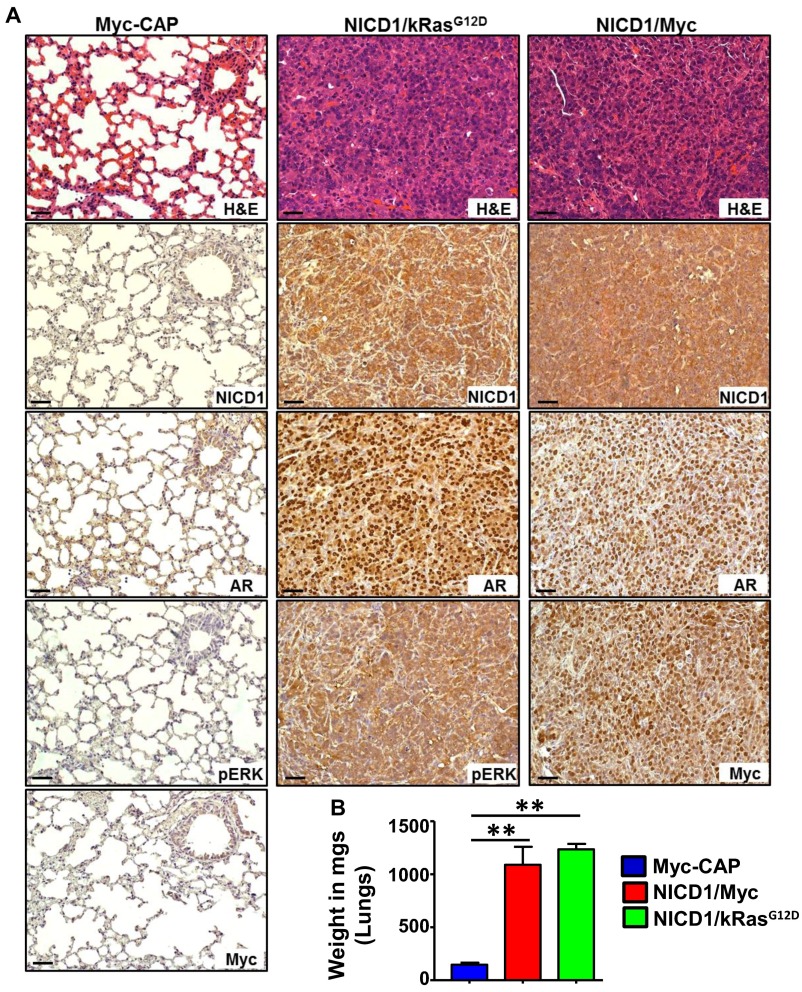
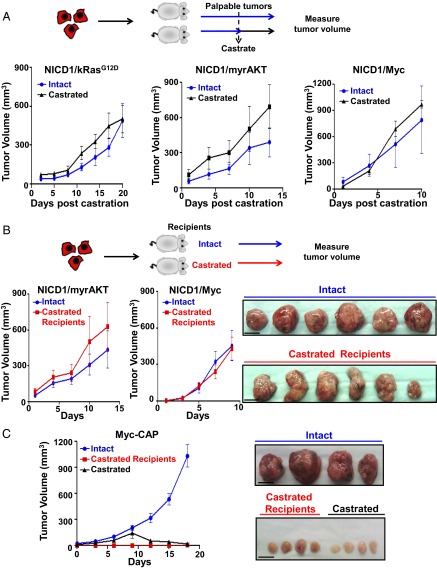
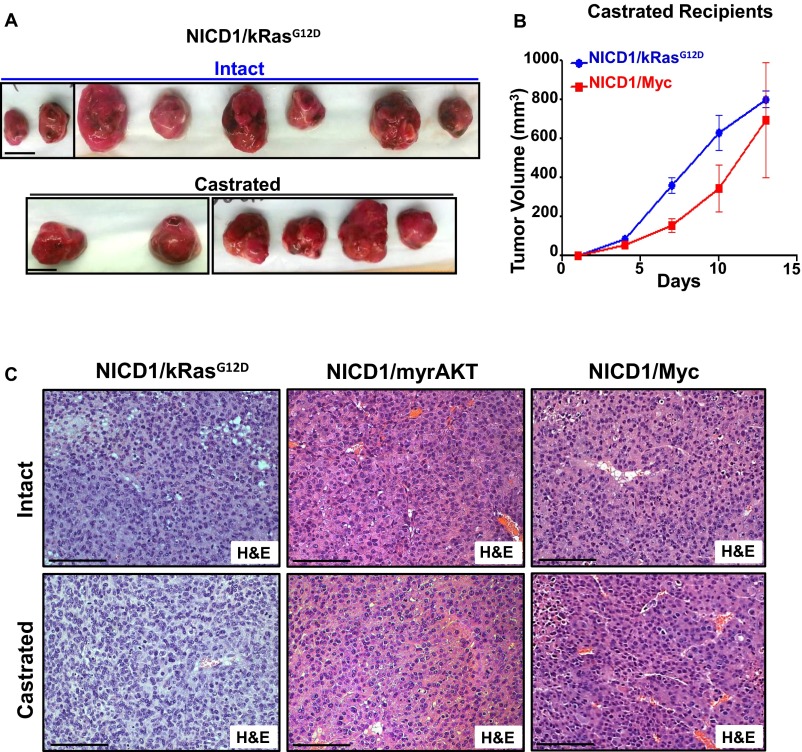
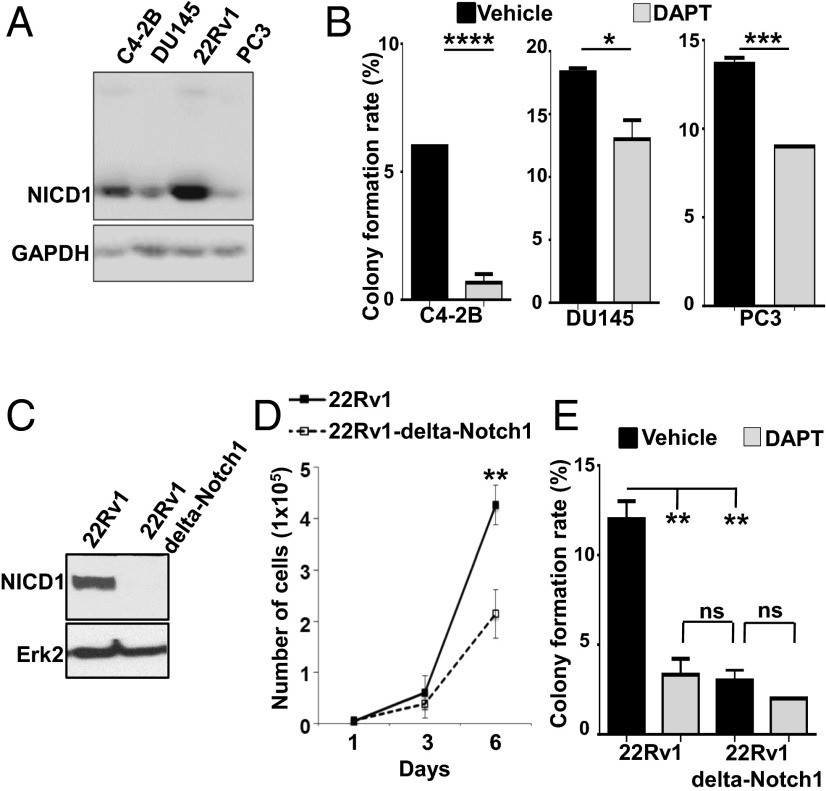
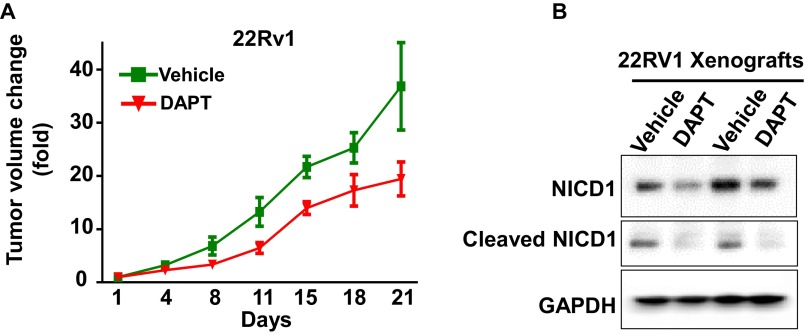
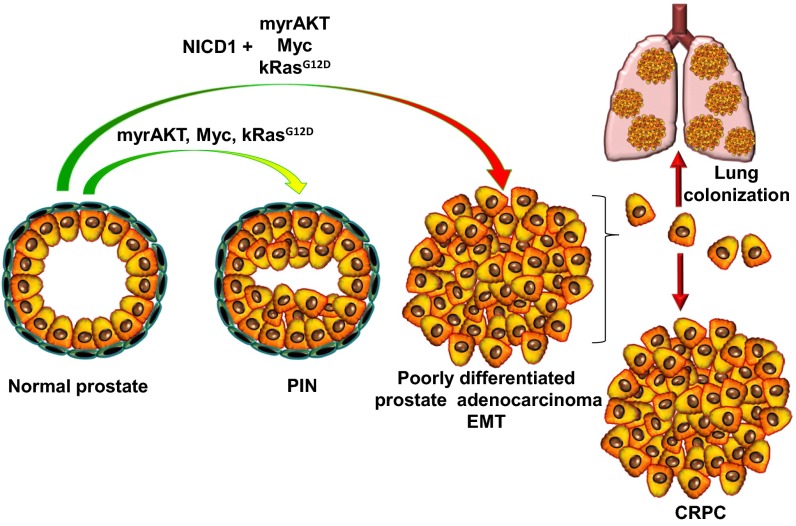
Metastatic castration-resistant prostate cancer (CRPC) is the primary cause of prostate cancer-specific mortality. Defining new mechanisms that can predict recurrence and drive lethal CRPC is critical. Here, we demonstrate that localized high-risk prostate cancer and metastatic CRPC, but not benign prostate tissues or low/intermediate-risk prostate cancer, express high levels of nuclear Notch homolog 1, translocation-associated (Notch1) receptor intracellular domain. Chronic activation of Notch1 synergizes with multiple oncogenic pathways altered in early disease to promote the development of prostate adenocarcinoma. These tumors display features of epithelial-to-mesenchymal transition, a cellular state associated with increased tumor aggressiveness. Consistent with its activation in clinical CRPC, tumors driven by Notch1 intracellular domain in combination with multiple pathways altered in prostate cancer are metastatic and resistant to androgen deprivation. Our study provides functional evidence that the Notch1 signaling axis synergizes with alternative pathways in promoting metastatic CRPC and may represent a new therapeutic target for advanced prostate cancer.

Keywords: Notch1; cancer; prostate.


Conflict of interest statement

The authors declare no conflict of interest.

Figures

Fig. 1.
Fig. 1.
The Notch1 receptor intracellular domain is highly elevated in advanced human prostate cancer. (A) Human prostate TMAs were stained with an antibody against NICD1 (Novus Biologicals). Representative images are shown. (Scale bars: 100 microns in Upper Row and 50 microns in Lower Row.) (B) NICD1 expression was scored from 0–3 in benign tissue (n = 221), localized low- to intermediate-risk prostate cancer (Gleason score 6 or 7) (n = 207), localized high-risk prostate cancer (Gleason score 8–10) (n = 23), and CPRC (n = 19) specimens. (Left) The intensity of nuclear staining was plotted. ***P < 0.0001. **P < 0.005; *P < 0.05; ns, nonsignificant; one-way ANOVA. (Right) Percentage of patients exhibiting nuclear NICD1. (C) Western blot analyses were performed with anti-NICD1 antibody (Epitomics/Abcam) and anti-Erk2 used as loading control using the following specimens. (i) Human specimens were separated into regions of benign tissue and low- to intermediate-risk prostate cancer by a urologic pathologist. (ii) Metastatic CRPC tissues were obtained from the rapid autopsy program at the University of Michigan. (iii) The Myc/myrAKT CRPC model initiated in primary human cells. Metastatic CRPC tissues were obtained from total of eight different patients (including the samples presented in Fig. S1). Twenty-three distinct metastatic sites are shown. Each distinct patient is indicated by a different color.
Fig. S1.
Fig. S1.
Nuclear NICD1 is elevated in advanced human prostate cancer. The figure shows negative and positive controls for the human prostate TMA stained with an antibody against the intracellular domain of Notch1 presented in Fig. 1A. (Left) Benign human tissue; epithelial cells are negative for NICD1. (Center) Previously described mouse Myc-CAP xenografts (41). Myc-CAP xenografts are negative for nuclear NICD1. (Right) As a positive control we used tumors driven by the combination of NICD1 overexpression and active AKT overexpression (myrAKT). (Scale bars: 100 microns in the upper row; 50 microns in the lower row.)
Fig. S2.
Fig. S2.
NICD1 is highly expressed in metastatic prostate cancer but not in benign prostate tissues and low- or intermediate-risk prostate cancer. Western blot analyses were performed using anti-NICD1 antibody (Epitomics; currently Abcam), and anti-Erk2 was used as a loading control. For the Western blot analyses we used (i) human prostate tissues separated into benign (B) and low- to intermediate-risk prostate cancer (T) regions; (ii) metastatic CRPC tissues obtained from the rapid autopsy program at the University of Michigan; and (iii) the Myc/myrAKT CRPC model initiated in primary human cells that express high levels of full-length Notch1 (Notch1 FL, ∼300 kDa) and NICD1 (∼100 kDa). Distinct patients with metastatic disease are shown in different colors.
Fig. S3.
Fig. S3.
NICD1 is highly expressed in metastatic prostate cancer. Western blot analyses were performed on metastatic CRPC tissues obtained from the rapid autopsy program at the University of Michigan using anti-cleaved Notch1 V1744 antibody (Cell Signaling Technology). GAPDH was used as a loading control. Distinct patients with metastatic disease are shown in different colors. Different colors and metastatic sites match the patients’ samples analyzed in Fig. 1C and Fig. S2.
Fig. 2.
Fig. 2.
NICD1 synergizes with multiple oncogenic pathways to drive prostate cancer. (A, Left) Schematic representation of the in vivo mouse tissue regeneration assay. Lentiviral transduction was used to overexpress GFP alone (GFP), human NICD1 and GFP (NICD1), mutant kRasG12D and RFP (kRasG12D), myristoylated/activated AKT and RFP (myrAKT), or Myc and RFP (Myc), alone or in combination with NICD1 (NICD1/kRasG12D, NICD1/myrAKT, NICD1/Myc). (Right) Transduced epithelial cells were combined with UGSM and implanted under the kidney capsule of SCID mice. Twelve weeks later the grafts were evaluated histologically. (B) Representatives of the grafts recovered 12 wk after implantation are shown for each condition. (Scale bar: 5 mm.) One of the five experiments performed is shown. (C) The recovered grafts from each condition were stained with H&E and were evaluated histologically. Representatives of the recovered grafts are shown. (Scale bars: 500 microns in upper panels; 100 microns in lower panels.)
Fig. 3.
Fig. 3.
Characterization of NICD1/myrAKT, NICD1/Myc, and NICD1/kRasG12D tumors. Immunohistochemical analysis was performed on 4-μm sections of paraffin-embedded NICD1/myrAKT, NICD1/Myc, and NICD1/kRasG12D tumors stained with H&E or with antibodies against NICD1, pErk, pAKT, Myc, p63, or AR. (Scale bars: 100 microns.)
Fig. S4.
Fig. S4.
Expression levels of NICD1 in tumors driven by NICD1 in combination with kRasG12D, myrAKT, or Myc resemble levels of nuclear NICD1 in human CRPC specimens. Levels of nuclear NICD1 overexpression mimic the levels of nuclear NICD1 in human CRPC. Immunohistochemical analyses of 4- μm sections of paraffin-embedded human low- to intermediate-risk prostate cancer (Gleason score 6 or 7), localized high-risk prostate cancer (Gleason score 8–10), CRPC specimens, and NICD1/myrAKT tumors with antibodies against NICD1 (Novus Biologicals) are shown. (Scale bars: 100 microns in left panels; 50 microns in right panels.)
Fig. S5.
Fig. S5.
NICD1/myrAKT, NICD1/Myc, and NICD1/kRasG12D tumors are highly proliferative. Immunohistochemical analysis of 4-μm sections of paraffin-embedded NICD1/myrAKT, NICD1/Myc, and NICD1/kRasG12D tumors stained with H&E or with antibodies against NICD1, pErk, pAKT, Myc, or PCNA. (Scale bars: 100 microns.)
Fig. 4.
Fig. 4.
Expression profiling of NICD1-driven tumors reveals the EMT signature. (A) Venn diagram of genes differentially expressed in NICD1/kRasG12D, NICD1/myrAKT, and NICD1/Myc versus normal mouse prostate. A total of 1,944 common differentially expressed genes were analyzed for molecular and cellular functions using Ingenuity engine software. The top statistically significant molecular and cellular functions are presented with the corresponding P values. (B) The plots show the GSEA of genes differentially expressed in NICD1/myrAKT, NICD1/Myc, or NICD1/kRasG12D versus normal mouse prostate. NES, normalized enrichment score.
Fig. S6.
Fig. S6.
Tumors driven by NICD1 in combination with pathways altered in prostate cancer express high levels of Notch1 target genes. (A) Heat map of common genes differentially expressed in NICD1/Myc, NICD1/myrAKT, and NICD1/kRasG12D tissue versus normal mouse prostate. Red represents genes overexpressed, and blue represents genes down-regulated across all NICD1/Myc, NICD1/myrAKT, and NICD1/kRasG12D tissues versus normal mouse prostate. (B) The fold change in reads per kilobase per million mapped reads (RPKM) of transcript of Notch1 target genes (Hey2, Hey1, Heyl, Notch3, and Nrarp) and GAPDH from our RNA-sequencing analysis is shown. The average of RPKM of each gene in the mouse prostate is considered as 1.
Fig. S7.
Fig. S7.
Tumors driven by NICD1 in combination with pathways altered in prostate cancer exhibit EMT characteristics. Plots representing GSEA of genes differentially expressed in NICD1/myrAKT, NICD1/Myc, and NICD1/kRasG12D versus normal mouse prostate are shown. NES, normalized enrichment score.
Fig. 5.
Fig. 5.
Tumors driven by NICD1 in combination with pathways altered in prostate cancer exhibit the acquisition of self-renewal activity and metastatic potential. (A) Primary NICD/kRasG12D tumor was dissociated into single cells and subjected to FACS. (Scale bars: 1 cm.) GFP/RFP double-positive cells were sorted, and 10, 100, 1,000, or 10,000 cells were implanted into SCID recipient mice. (B, Left) Representative recovered tumors initiated from 10, 100, 1,000, or 10,000 cells. (Scale bar: 1 cm.) (Right) Histology of each tumor is shown. (Scale bar: 50 microns.) One of the three independent experiments is presented. (C) Tumors driven by NICD1 in combination with pathways altered in prostate cancer exhibit metastatic potential. Primary tumors driven by NICD1/kRasG12D and NICD1/Myc were dissociated into single cells, infected with lentivirus expressing luciferase and YFP, and cultured. One week after infection cells were sorted by FACS for YFP. As a negative control, we used Myc-CAP cells expressing luciferase with YFP. Cells (8 × 10⁵) were introduced to immunocompromised mice via tail veil injection. Bioluminescent images taken on the day of injection are shown. One of the three independent experiments is shown. (D, Upper) Bioluminescent images taken day 28 after injection are shown. (Lower) Recovered lungs are presented. (Scale bars: 1 cm.) The size of the recovered lungs, histology of the lungs, and immunohistochemistry for NICD1, pErk, myc, and AR are presented in Fig. S9.
Fig. S8.
Fig. S8.
NICD1 in combination with alternative pathways exhibits high self-renewal activity and metastatic potential in vivo. (A) Dissociated single cells from a primary NICD1/Myc tumor were subjected to FACS. GFP/RFP double-positive cells were sorted. GFP/RFP cells were implanted into SCID recipient mice at limiting dilutions of 10, 100, 1,000, or 10,000. (Scale bars: 0.5 cm.) (B, Left) Representative tumors initiated from 10, 100, or 1,000 cells recovered 4 wk after implantation or from 10,000 cells recovered 3 wk after implantation. (Scale bars: 1 cm.) (Right) H&E staining of each tumor is shown. (Scale bars: 50 microns.) One of the two independent experiments is shown. (C) The Myc-CAP cell line (44) has lower self-renewal activity and was used as a control. Representative tumors initiated from 10, 100, or 1,000 Myc-CAP cells recovered 8 wk after implantation. (Scale bar: 1 cm.)
Fig. S9.
Fig. S9.
Tumors driven by NICD1 in combination with other pathways altered in prostate cancer exhibit metastatic potential. (A) Immunohistochemistry analysis of paraffin-embedded lungs from the mice injected with NICD1/kRasG12D and NICD1/Myc cells shown in Fig. 5A stained with H&E or antibodies against NICD1, pErk, Myc, and AR. (Scale bars: 100 microns in left panels; 50 microns in center and right panels.) (B) Weight of the lungs recovered at day 28 after injection from the animals shown in Fig. 5C injected with Myc-CAP-Luciferase, NICD1/kRasG12D-Luciferase, or NICD1/Myc-Luciferase was measured in milligrams and plotted. **P < 0.005, one-way ANOVA.
Fig. 6.
Fig. 6.
NICD1 in combination with the Ras/Raf/MAPK, myrAKT, or Myc pathways drives CRPC. (A, Upper) Schematic representation of the experimental design. Primary tumors driven by NICD1/kRasG12D, NICD1/myrAKT, or NICD1/Myc were dissociated into single cells. NICD1/kRasG12D, NICD1/myrAKT, or NICD1/Myc tumor cells (6 × 10⁵) were mixed with Matrigel and transplanted s.c. into six to eight mice per condition. Upon detection of palpable tumors (50 mm3), six to eight mice carrying a total of six to eight tumors were castrated (marked as day 1). Tumor length, width, and height were measured every 3 d for a total of 10–20 d. (Lower) Tumor volumes were calculated by multiplying length × width × height/2 and were plotted. One of the two independent experiments for each tumor type (NICD1/kRasG12D, NICD1/myrAKT, or NICD1/Myc) is shown. (B, Upper) The experimental design. NICD1/myrAKT or NICD1/Myc tumor cells (6 × 10⁵) were mixed with Matrigel and transplanted s.c. into six castrated or six intact recipient mice. (Lower Left) Upon detection of palpable tumors (50 mm3), marked as day 1, tumor volumes were measured every 3 d. (Lower Right) Recovered NICD1/Myc secondary tumors from intact or castrated recipients are shown. (Scale bars: 1 cm.) One of the two independent experiments for each tumor type (NICD1/myrAKT or NICD1/Myc) is presented. (C, Left) Myc-CAP cells (6 × 10⁵) were mixed with Matrigel and implanted s.c. into eight intact or four castrated immunodeficient recipient mice. Upon detection of palpable tumors, one group of intact mice (n = 4) was subjected to surgical castration. (Right) Images of the recovered tumors. (Scale bars: 1 cm.)
Fig. S10.
Fig. S10.
Tumors driven by NICD1 in combination with other pathways altered in prostate cancer are castration resistant. (A) Images of the transplanted tumors driven by NICD1/kRasG12D plotted in Fig. 6A. (Scale bars: 1 cm.) (B) NICD1/kRasG12D or NICD1/Myc tumor cells (6 × 10⁵) were mixed with Matrigel and were transplanted s.c. into six castrated or six intact recipient mice. Upon detection of palpable tumors (50 mm3), tumors volumes were measured and plotted. (C) Histology of NICD1/kRasG12D, NICD/myrAKT, and NICD1/Myc tumors recovered from intact or castrated recipients. (Scale bars: 100 microns.)
Fig. 7.
Fig. 7.
Notch1 down-regulation and γ-secretase inhibition delay prostate cancer cell growth. (A) C4-2B, DU145, 22Rv1, and PC3 cells were lysed and subjected to Western blot analysis with antibodies against NICD1 and GAPDH. (B) C4-2B, DU145, and PC3 cells were subjected to a colony-formation assay. Plated cells were treated with DMSO (vehicle) or 25 μM GSI-IX (DAPT) every 48 h for 9 d. The mean colony-formation rate is plotted. Statistical analysis was performed by Student t test. ****P < 0.0001; *** P < 0.005; *P < 0.05; ns, nonsignificant. One of the two independent experiments is shown. (C) 22Rv1 and 22Rv1 ΔNotch1 cells were lysed and subjected to Western blot analysis with antibodies against NICD1 and Erk-2. (D) 22Rv1 or 22Rv1Δ Notch1 cells (1 × 10⁴) were plated. Cell number was counted 1, 3, and 6 d after plating. Student t test was used for statistical analysis. **P < 0.01. (E) 22Rv1 and 22Rv1 ΔNotch1 cells were subjected a colony-formation assay. Cells were treated with DMSO (vehicle) or 25 μM GSI-IX (DAPT) every 48 h for 9 d. The mean colony-formation rate is shown. Student t test was used for statistical analysis. **P < 0.01; ns, nonsignificant.
Fig. S11.
Fig. S11.
γ-Secretase inhibition delays prostate cancer tumor growth. (A) 22Rv1 cells (1 × 10⁶) were injected s.c. in NSG mice. Upon detection of palpable tumors, animals were treated with either vehicle (n = 4) or DAPT (GSI-IX) (n = 4) administered for 20 d according to the following schedule: 50 mg/kg DAPT for 3 d followed by 1 d off DAPT, then 50 mg/kg DAPT for 6 d and 1 d off DAPT. Day 1 is the day of treatment initiation. (B) Inhibition of Notch1 by DAPT in vivo was confirmed by Western blot for NICD1 and the cleaved Notch1 expression level.
Fig. 8.
Fig. 8.
NICD1 in combination with the myrAKT, Myc, or Ras/Raf/MAPK pathways promotes metastatic CRPC. The schematic representation summarizes our results.

Comment in

Similar articles

Cited by

References

    1. Feldman BJ, Feldman D. The development of androgen-independent prostate cancer. Nat Rev Cancer. 2001;1(1):34–45. - PubMed
    1. Kantoff PW, et al. IMPACT Study Investigators Sipuleucel-T immunotherapy for castration-resistant prostate cancer. N Engl J Med. 2010;363(5):411–422. - PubMed
    1. Tannock IF, et al. TAX 327 Investigators Docetaxel plus prednisone or mitoxantrone plus prednisone for advanced prostate cancer. N Engl J Med. 2004;351(15):1502–1512. - PubMed
    1. Wang XD, et al. Notch signaling is required for normal prostatic epithelial cell proliferation and differentiation. Dev Biol. 2006;290(1):66–80. - PubMed
    1. Kwon OJ, et al. Increased Notch signalling inhibits anoikis and stimulates proliferation of prostate luminal epithelial cells. Nat Commun. 2014;5:4416. - PMC - PubMed

Publication types

MeSH terms