. 2016 Oct 3:7:12896.
doi: 10.1038/ncomms12896.

A plasma membrane microdomain compartmentalizes ephrin-generated cAMP signals to prune developing retinal axon arbors

Affiliations

A plasma membrane microdomain compartmentalizes ephrin-generated cAMP signals to prune developing retinal axon arbors

Stefania Averaimo et al. Nat Commun. .

Abstract

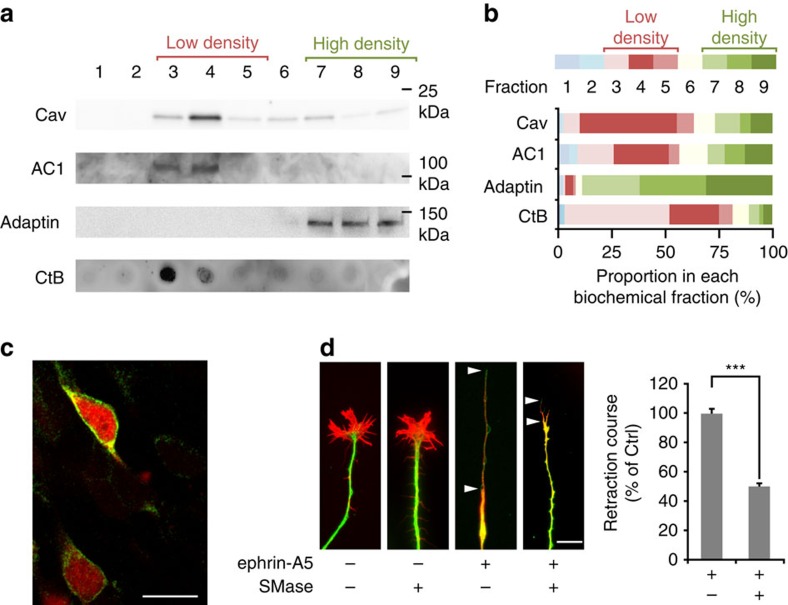
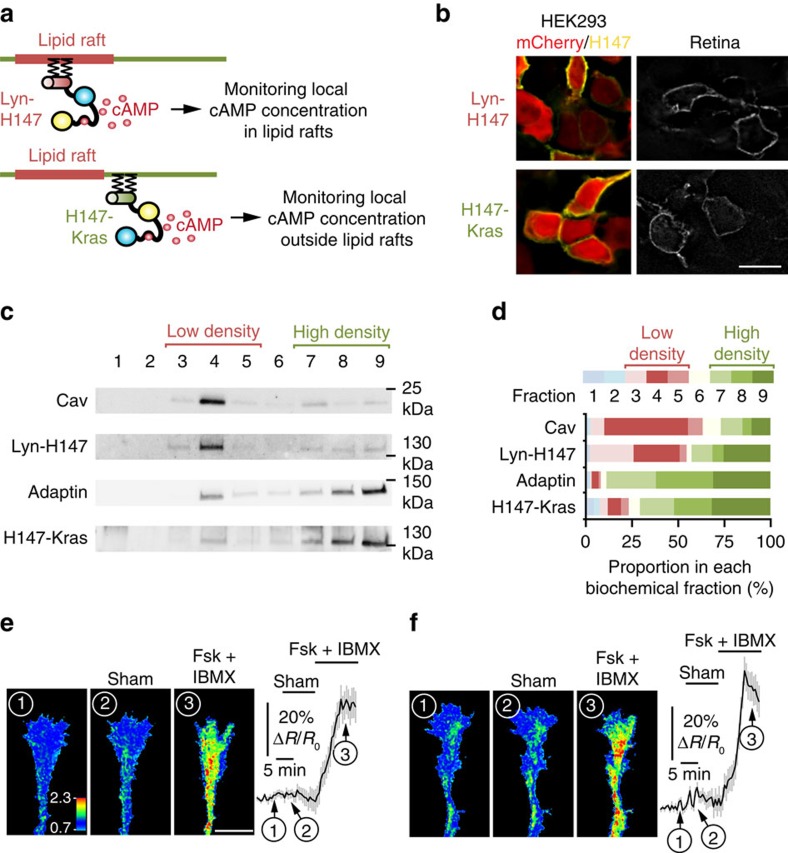
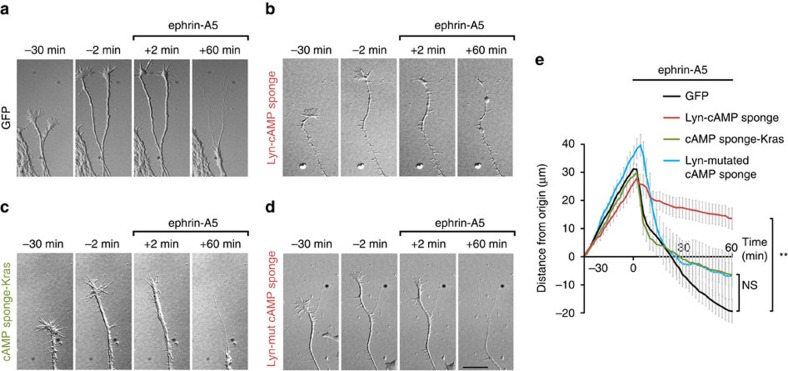
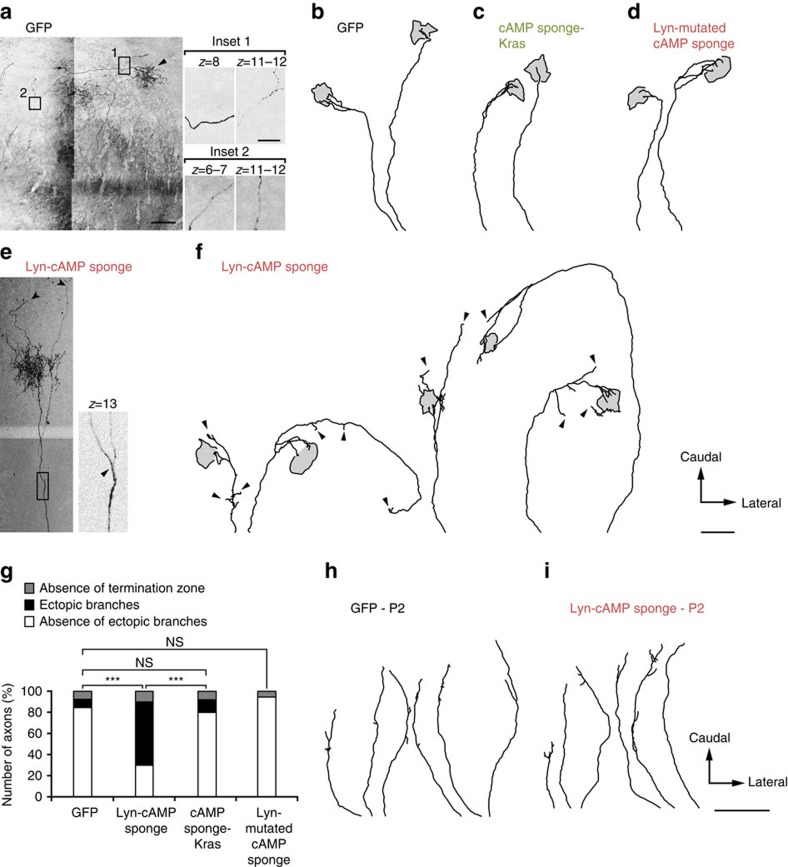
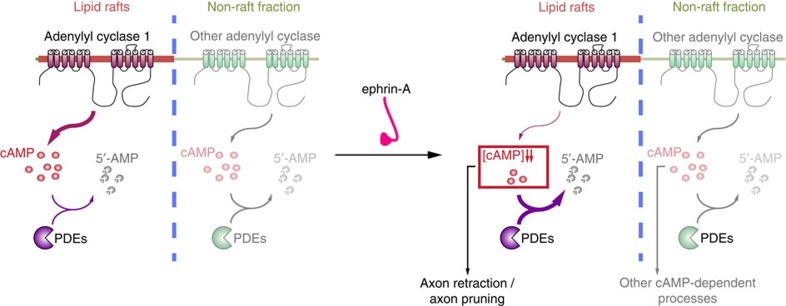
The development of neuronal circuits is controlled by guidance molecules that are hypothesized to interact with the cholesterol-enriched domains of the plasma membrane termed lipid rafts. Whether such domains enable local intracellular signalling at the submicrometre scale in developing neurons and are required for shaping the nervous system connectivity in vivo remains controversial. Here, we report a role for lipid rafts in generating domains of local cAMP signalling in axonal growth cones downstream of ephrin-A repulsive guidance cues. Ephrin-A-dependent retraction of retinal ganglion cell axons involves cAMP signalling restricted to the vicinity of lipid rafts and is independent of cAMP modulation outside of this microdomain. cAMP modulation near lipid rafts controls the pruning of ectopic axonal branches of retinal ganglion cells in vivo, a process requiring intact ephrin-A signalling. Together, our findings indicate that lipid rafts structure the subcellular organization of intracellular cAMP signalling shaping axonal arbors during the nervous system development.


Figures

Figure 1
Figure 1. Lipid rafts contain AC1 and are required for ephrin-A-induced axonal retraction.
(a) AC1 fused to GFP and overexpressed in the developing retina is detected in fractions 3 and 4 after sucrose-density gradient fractionation of the plasma membrane. This coincides with the location of the lipid raft markers Caveolin-1 (Cav, enriched in fractions 3 and 4) and cholera toxin (CtB), a lipid raft marker that binds ganglioside M1, other gangliosides, and raft-targeted glycoproteins (enriched in fractions 3 and 4). AC1 is excluded from the fractions enriched in β-Adaptin (7–9), a marker of the non-raft fraction of the membrane. (b) Proportion of Caveolin, AC1, β-Adaptin and CtB expression found in each biochemical fraction. For each marker detected, the optical density (OD) of the bands in each fraction is quantified and normalized to the sum of the OD in all fractions. The proportion of the signal found in each fraction is shown. Each biochemical fraction is colour-coded. Red tones code for the low-density Caveolin- and CtB-enriched fractions (3–5), whereas green tones denote the high-density β-Adaptin-enriched fractions (7–9). Cav, Adaptin, AC1, CtB n=3 independent experiments. (c) Overexpressing AC1 fused to GFP (green) in retinal neurons co-electroporated with mCherry (cytoplasmic localization, red) does not affect AC1 plasma membrane targeting. Scale bar, 10 μm. n=3 experiments from independent cultures. (d) Altering lipid rafts integrity with SMase does not affect the morphology of growing RGC axons. Ephrin-A5 induces a collapse of RGC growth cones in vitro and a subsequent axonal retraction leaving a long trailing process (encompassed by the two arrowheads). SMase does not affect the collapse of the growth cone but reduces axon retraction measured as the length of the trailing process (between the two arrowheads). Scale bar, 10 μm. n≥360 axons per condition (ctrl n=600, SMase n=360) from three independent cultures. Data are mean±s.e.m. ***P≤0.001, Mann–Whitney test. Uncropped gels are provided in Supplementary Fig. 8.
Figure 2
Figure 2. Monitoring local cAMP inside or outside the submembrane domain adjacent to lipid rafts.
The strategy used to monitor cAMP signals in the vicinity of the raft or non-raft domains of the plasma membrane is schematized in a. The cAMP-sensitive FRET sensor H147 is fused to either a tandem of two Lyn sequences in 5′ or to a Kras sequence in 3′ to confine the probe inside or outside lipid rafts, respectively and monitor local cAMP signals. (b) Electroporation of Lyn-H147 or H147-Kras in retinal explants (right panels) or co-transfection of each FRET probe (yellow) with mCherry (red) in HEK293 cells (left panels) leads to a plasma membrane-restricted expression of both sensors. Scale bar, 10 μm. n=3 independent cultures (HEK293) or three retinas. (c) Lyn-H147 is enriched in the biochemically-isolated fractions enriched in the lipid raft marker Caveolin-1 (fractions 3 and 4), whereas H147-Kras is mostly found in the fractions enriched in the lipid raft-excluded marker β-Adaptin (fractions 7–9). (d) Proportion of Caveolin, Lyn-H147, β-Adaptin and H147-Kras expression found in each biochemical fraction. Each biochemical fraction is colour-coded. Red tones code for the low-density fractions (3–5), whereas green tones denote the high-density fractions (7–9). Cav, Adaptin, Lyn-H147, H147-Kras n=3 independent experiments. (e) Pharmacological increase of cAMP after Fsk and IBMX exposure leads to an increase of the CFP/FRET ratio detected by the Lyn-H147 sensor (lipid raft-targeted) in RGC growth cones. The CFP/FRET ratio is not affected by sham stimulation (n=14 growth cones from four independent cultures). The CFP/FRET ratio is colour-coded from blue (low ratio, low cAMP concentration) to red (high ratio, high cAMP concentration). (f) Fsk and IBMX induce an increase of the CFP/FRET ratio of the lipid raft-excluded cAMP sensor H147-Kras, whereas sham stimulation does not (n=9 growth cones from three independent cultures). CFP/FRET ratio is coded as in e. Data are mean±s.e.m. (e,f) Scale bar, 10 μm. Uncropped gels are provided in Supplementary Fig. 8.
Figure 3
Figure 3. Ephrin-A5 induces a reduction in cAMP concentration restricted to the vicinity of lipid rafts.
The computed CFP/FRET ratio is shown in RGC axons expressing either the lipid raft-targeted cAMP sensor Lyn-H147 or the raft-excluded probe H147-Kras, revealing the local variation in cAMP concentration. The ratio is colour-coded from blue (low ratio, low cAMP concentration) to red (high ratio, high cAMP concentration). Axon viability is controlled at the end of the experiment, verifying that the cAMP level increases on stimulation of the transmembrane ACs with Forskolin (Fsk), together with the phosphodiesterases inhibitor IBMX. (a) Ephrin-A5 induces a reduction in cAMP concentration in the vicinity of lipid rafts (colour of the growth cone changing from green/red into blue/green), whereas (b) the CFP/FRET ratio of the biosensor excluded from lipid rafts is unaffected by ephrin-A5. Scale bar, 10 μm. (a) n=25 axons from seven independent cultures. (b) n=19 axons from five independent cultures. Data are mean±s.e.m.
Figure 4
Figure 4. Lipid raft targeting or exclusion of a cAMP signalling blocker.
The strategy used to block raft and non-raft cAMP signals is schematized in a. The genetically-encoded cAMP blocker ‘cAMP sponge' is fused to either a tandem of two Lyn sequences in 5′ or a Kras sequence in 3′ to target the blocker to lipid rafts or exclude it from this plasma membrane compartment, respectively. (b) Lyn-cAMP sponge and cAMP sponge-Kras are both restricted to the plasma membrane in developing retinal neurons (right panels) or when cotransfected with GFP (green) in HEK293 cells (left panels). Scale bar, 10 μm. n=3 independent cultures (HEK293) or three retina. (c) Lyn-H147 is enriched in the biochemically-isolated fractions enriched in the lipid raft marker Caveolin (3 and 4), whereas H147-Kras is mostly found in the compartment enriched in the non-raft marker β-Adaptin (fractions 7–9). (d) The proportion of the signal found in each biochemical fraction is shown. The identity of each fraction is colour-coded. Red tones code for low-density fractions (3–5), whereas green tones denote high-density fractions (7–9). Cav, Adaptin, Lyn-cAMP sponge, cAMP sponge-Kras n=3 independent experiments. Uncropped gels are provided in Supplementary Fig. 8.
Figure 5
Figure 5. cAMP signalling is required within but not outside the submembrane domain of lipid rafts for ephrin-A5-induced retraction of RGC axons.
(a) GFP-expressing axons growing before ephrin-A5 addition to the culture medium (−30 min to −2 min), collapse shortly after ephrin-A5 application (+2 min) and retract during 60 min after ephrin-A5 exposure. (b) In contrast, axons expressing Lyn-cAMP sponge, in which cAMP signalling is blocked specifically in the vicinity of lipid rafts, the retraction is drastically reduced following the initial collapse. Axons expressing Lyn-cAMP sponge are identified by co-electroporated GFP (Supplementary Fig. 5). Lyn-cAMP sponge does not perturb axon outgrowth before ephrin-A5 application. (c) The blockade of cAMP near the plasma membrane but away from lipid rafts or (d) the expression of a variant of Lyn-cAMP sponge unable to bind cAMP does not affect ephrin-A5-induced axon retraction. (e) The distance of the growth cone from its initial position (t=−30 min) is plotted. Axons are exposed to ephrin-A5 at t=0 min. GFP-, cAMP sponge-Kras- and Lyn-cAMP mutated sponge-expressing axons grow and retract similarly, whereas the ephrin-A5-induced retraction of Lyn-cAMP sponge-expressing axons is reduced. Scale bar, 15 μm. (a) n=76 axons from 13 cultures. (b) n=19 axons from 7 cultures. (c) n=22 axons from 5 cultures. (d) n=15 axons from 4 cultures. Data are mean±s.e.m. **P≤0.01, Kruskal–Wallis test.
Figure 6
Figure 6. A cAMP decrease in the vicinity of lipid rafts is sufficient to induce retraction of RGC axons.
The strategy used to manipulate cAMP signals with subcellular resolution is schematized in a. The light-sensitive AC bPAC is fused to either a tandem of two Lyn sequences in 5′ or a Kras sequence in 3′ to target the blocker to lipid rafts or exclude it from this plasma membrane compartment, respectively. Blue light induces a local increase of cAMP followed by a reduction of its concentration after the release of light stimulation (Supplementary Fig. 6). (b) Lyn-bPAC is highly enriched in fractions 3–5 together with the lipid raft marker Caveolin. The proportions of Lyn-bPAC and Caveolin-1 in each biochemical fraction are shown. Each biochemical fraction is colour-coded. Red tones code for the low-density fractions (3–5), whereas green tones denote the high-density β-Adaptin-enriched fractions (7–9). Cav n=6 independent experiments; Adaptin, Lyn-bPAC, bPAC-Kras n=3 independent experiments. Blue light does not affect outgrowth of (c) wild-type or (e) bPAC-Kras-expressing axons. (d) Light exposure (starting at t=0 min) induces retraction of Lyn-bPAC-expressing axons after light stimulation was turned off. (f) Outgrowth of Lyn-bPAC-expressing axons is not affected without blue light illumination. (g) The distance of the growth cone from its initial position (t=−34 min) is plotted. Light activation of bPAC is interrupted at t=0 min. Control, Lyn-bPAC- and bPAC-Kras-expressing axons grow similarly and are not affected by the onset of light exposure. Interrupting light exposure induces stalling or retraction in Lyn-bPAC-expressing axons but not in control or bPAC-Kras-expressing axons. No bPAC/Light+ n=15 from four independent cultures; Lyn-bPAC/Light+ n=14 from five independent cultures; bPAC-Kras/Light+ n=8 from three independent cultures; Lyn-bPAC/Light+ n=14 from four independent cultures. (h) Lyn-bPAC-expressing axons retract after but not during light exposure. The variability of the retraction onset reflects the variability of the timing of cAMP decrease (Supplementary Fig. 6e). Scale bar, 15 μm. Data are mean±s.e.m. **P≤0.01, Kruskal–Wallis test.
Figure 7
Figure 7. cAMP signalling inside but not outside the submembrane domain of lipid rafts is required for RGC axon arbor refinement in the SC.
In utero retinal electroporation of (a,b) GFP, (c) cAMP sponge-Kras, (d) the mutated version of Lyn-cAMP unable to bind cAMP or (e,f) Lyn-cAMP sponge. Examples of reconstruction of electroporated RGC arbors at P10 in the SC are shown for each condition. The extent of the terminal arborization (arrowhead in a) is identified as a grey area delineated with a black contour. The rostral limit of the SC corresponds to the bottom of each trace. GFP-electroporated axons exhibit a dense terminal zone and an absence of branch tip outside the termination zone. In contrast, exuberant branches are detected in Lyn-cAMP sponge-expressing axons (arrowheads in e,f). These branches do not terminate in the dense termination zone. cAMP sponge-Kras and Lyn-mutated cAMP sponge-expressing axons were not distinguishable from GFP-expressing arbors, with an absence of branch tips outside of the dense termination zone. The insets in a,e highlight distinct confocal sections of the image and enable the distinction between axon crossing (a) and branching (e). (g) Number of axons without a termination zone and with or without ectopic branches. GFP, n=26 from nine animals; Lyn-cAMP sponge, n=30 from eight animals; cAMP sponge-Kras, n=25 from three animals; Lyn-mutated cAMP sponge, n=22 from three animals. ***P≤0.001, χ2 test. Reconstruction of (h) GFP or (i) Lyn-cAMP sponge-electroporated axons at P2. In both cases axons were poorly branched. Scale bar in a 100 μm, in inset 20 μm; applies for e. Scale bar in f 300 μm; applies for bd. Scale bar in i 300 μm; applies for h.
Figure 8
Figure 8. Model of local cAMP signalling for specific activation of downstream signalling.
cAMP signals can be generated both in the vicinity and further away from lipid rafts. Near lipid rafts, ephrin-A5 induces a decrease in the cAMP concentration, likely by modifying the balance between local AC and phosphodiesterase activity, without affecting cAMP signals in distal (non-raft) compartments. Lipid raft-proximal signals are required for axon retraction in vitro and retinal axon pruning in vivo, in contrast to cAMP signal excluded from this domain that might regulate other cellular processes modulated by this second messenger.

References

    1. Luo L. & O'Leary D. D. M. Axon retraction and degeneration in development and disease. Annu. Rev. Neurosci. 28, 127–156 (2005). - PubMed
    1. Guirland C., Suzuki S., Kojima M., Lu B. & Zheng J. Q. Lipid rafts mediate chemotropic guidance of nerve growth cones. Neuron 42, 51–62 (2004). - PubMed
    1. Hérincs Z. et al.. DCC association with lipid rafts is required for netrin-1-mediated axon guidance. J. Cell. Sci. 118, 1687–1692 (2005). - PubMed
    1. Lingwood D. & Simons K. Lipid rafts as a membrane-organizing principle. Science 327, 46–50 (2010). - PubMed
    1. Sonnino S. & Prinetti A. Membrane domains and the ‘lipid raft' concept. Curr. Med. Chem. 20, 4–21 (2013). - PubMed

Publication types