. 2016 Oct 3:6:34028.
doi: 10.1038/srep34028.

Differential photosynthetic and morphological adaptations to low light affect depth distribution of two submersed macrophytes in lakes

Affiliations

Differential photosynthetic and morphological adaptations to low light affect depth distribution of two submersed macrophytes in lakes

Jianfeng Chen et al. Sci Rep. .

Abstract

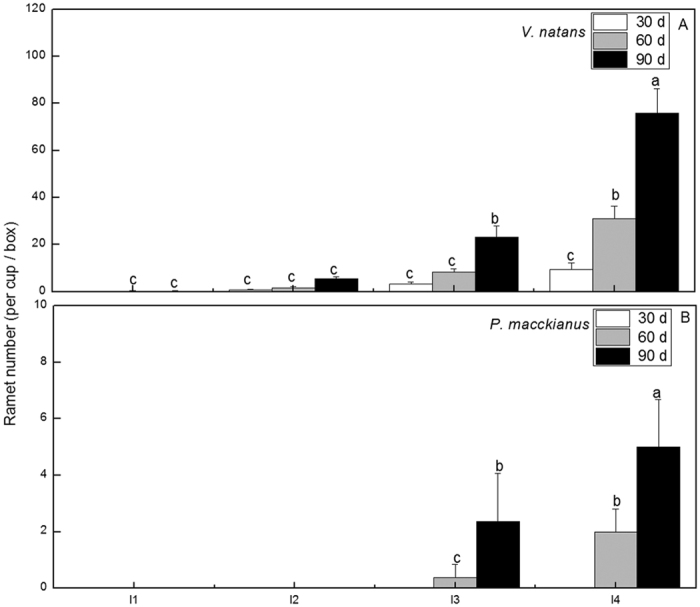
To evaluate the relative importance of photosynthetic versus morphological adaptations of submersed macrophytes to low light intensity in lakes, rapid light curves (RLCs), morphological parameters, relative growth rate (RGR), clonal reproduction and abundance of two submersed macrophytes (Potamogeton maackianus and Vallisneria natans) were examined under 2.8%, 7.1%, 17.1% and 39.5% ambient light in a field and outdoor experimental study. The plants increased their initial slope of RLCs (α) and decreased their minimum saturating irradiance (Ek) and maximum relative electron transport rate (ETRm) of RLCs under low light stress, but V. natans was more sensitive in RLCs than P. maackianus. Accordingly, the RGR, plant height and abundance of P. maackianus were higher in the high light regimes (shallow water) but lower in the low light regimes than those of V. natans. At the 2.8% ambient light, V. natans produced ramets and thus fulfilled its population expansion, in contrast to P. maackianus. The results revealed that P. maackianus as a canopy-former mainly elongated its shoot length towards the water surface to compensate for the low light conditions, however, it became limited in severe low light stress conditions. V. natans as a rosette adapted to low light stress mainly through photosynthetic adjustments and superior to severely low light than shoot elongation.


Figures

Figure 1
Figure 1. Experimental layout for the Vallisneria natans (Vn) and Potamogeton maackianus (Pm) cultivation experiment.
(a) Aquaria (50 × 50 × 80 cm) filled with 70 cm water for cultivation of macrophytes. (b) The P. maackianus tanks each contained 30 cups with one P. maackianus individual in each cup, the V. natans tanks contained two boxes with three V. natans individuals in each.
Figure 2
Figure 2. Effects of the treatments on rapid light curves (according to the formula rETR = Pm *(1 −EXP(−α* PAR/Pm)) *EXP(−β* PAR/Pm), where α, β, rETR, and Pm are the initial slope of the curve, photo-inhibition parameters, the relative electron transport rate, and the maximum potential relative electron transfer rate without photo-inhibition, respectively) of V. natans and P. maackianus on day 65 of the experiment.
The I1, I2, I3 and I4 stand for 2.8%, 7.1%, 17.1% and 39.5% ambient light, respectively.
Figure 3
Figure 3. Effects of the treatments on fluorescence parameters (Ek, α, and ETRm) of rapid light curves for V. natans and P. maackianus on day 65 of the experiment (mean ± SE, n = 4).
The I1, I2, I3 and I4 stand for 2.8%, 7.1%, 17.1% and 39.5% ambient light, respectively. The A, B and C indicate parameters Ek, ETRm and α respectively. Different letters indicate Duncan’s test at the 0.05 significance level.
Figure 4
Figure 4. Effects of the treatments on the relative growth rate (RGR, mean ± SE, n = 4) of V. natans and P. maackianus on day 90 of the experiment.
The I1, I2, I3 and I4 stand for 2.8%, 7.1%, 17.1% and 39.5% ambient light, respectively. Different letters indicate Duncan’s test at the 0.05 significance level.
Figure 5
Figure 5. Effects of the treatments on plant height (mean ± SE, n = 4) of V. natans and P. maackianus and branch number (mean ± SE, n = 4) of P. maackianus on day 60 of the experiment.
The I1, I2, I3 and I4 stand for 2.8%, 7.1%, 17.1% and 39.5% ambient light, respectively. Plant height means average maximum leaf length of each individual for V. natans and average perpendicular distance from each branch apex to stem bottom for P. maackianus in each aquarium. Branch number were the number of shoots except the highest main branch of plant in a cup. The A indicates plant height of two species and B indicates branch number of P. maackianus. Different letters indicate Duncan’s test at the 0.05 significance level.
Figure 6
Figure 6. Effects of the treatments on the ramet number (mean ± SE, n = 4) of V. natans and P. maackianus on day 30, 60 and 90 of the experiment.
The I1, I2, I3 and I4 stand for 2.8%, 7.1%, 17.1% and 39.5% ambient light, respectively. The A and B indicate ramet number of V. natans and P. maackianus, respectively. Different letters indicate Duncan’s test at the 0.05 significance level.
Figure 7
Figure 7. Field investigations on biomass of V. natans and P. maackianus in Xukou Bay of Lake Taihu in summer 2014 and Lake Erhai in summer 2015.
The RI1, RI2, RI3 and RI4 represent light availability reaching the sediment and were equivalent to the experimental I1, I2, I3 and I4 light intensities, respectively. Different letters indicate Duncan’s test at the 0.05 significance level.

References

    1. Barko J. W., Adams M. S. & Clesceri N. L. Environmental factors and their consideration in the management of submersed aquatic vegetation: a review. J. Aquat. Plant Manage. 24, 1–10 (1986).
    1. Van T. K., Haller W. T. & Bowes G. Comparison of photosynthetic characteristics of 3 submersed aquatic plants. Plant Physiol. 58, 761–768 (1976). - PMC - PubMed
    1. Philip G. L., Eminson D. & Moss B. A mechanism to account for macrophyte decline in progressively eutrophicated freshwaters. Aquat. Bot. 4, 103–126 (1978).
    1. Arts G. H. P. Deterioration of Atlantic soft water macrophyte communities by acidification, eutrophication and alkalinisation. Aquat. Bot. 73, 373–393 (2002).
    1. Hautier Y., Niklaus P. A. & Hector A. Competition for light causes plant biodiversity loss after eutrophication. Science 324, 636–638 (2009). - PubMed

Publication types