. 2016 Dec;22(12):1448-1455.
doi: 10.1038/nm.4206. Epub 2016 Oct 3.

Zika viral dynamics and shedding in rhesus and cynomolgus macaques

Affiliations

Zika viral dynamics and shedding in rhesus and cynomolgus macaques

Christa E Osuna et al. Nat Med. 2016 Dec.

Erratum in

  • Corrigendum: Zika viral dynamics and shedding in rhesus and cynomolgus macaques.
    Osuna CE, Lim SY, Deleage C, Griffin BD, Stein D, Schroeder LT, Omage R, Best K, Luo M, Hraber PT, Andersen-Elyard H, Ojeda EF, Huang S, Vanlandingham DL, Higgs S, Perelson AS, Estes JD, Safronetz D, Lewis MG, Whitney JB. Osuna CE, et al. Nat Med. 2017 Feb 7;23(2):264. doi: 10.1038/nm0217-264b. Nat Med. 2017. PMID: 28170376 No abstract available.

Abstract

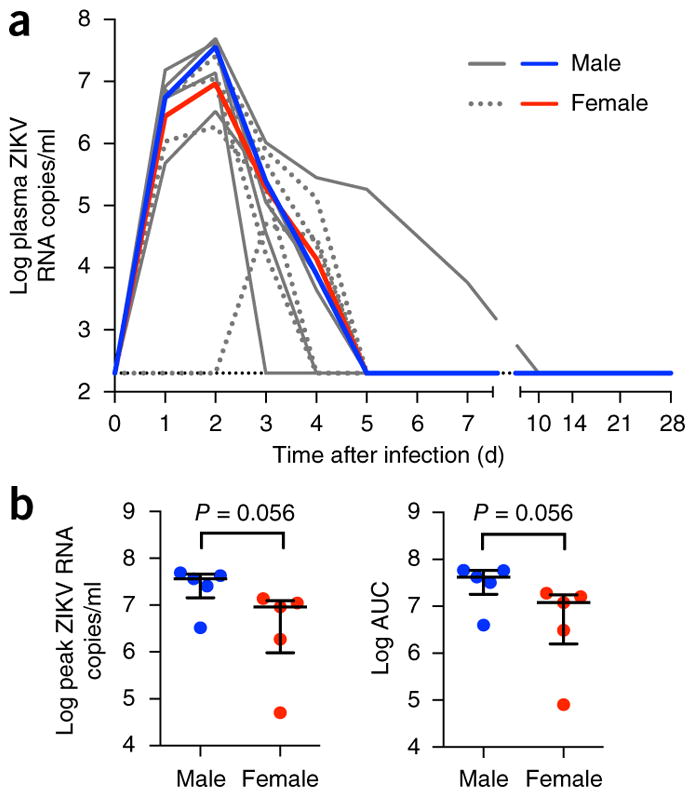
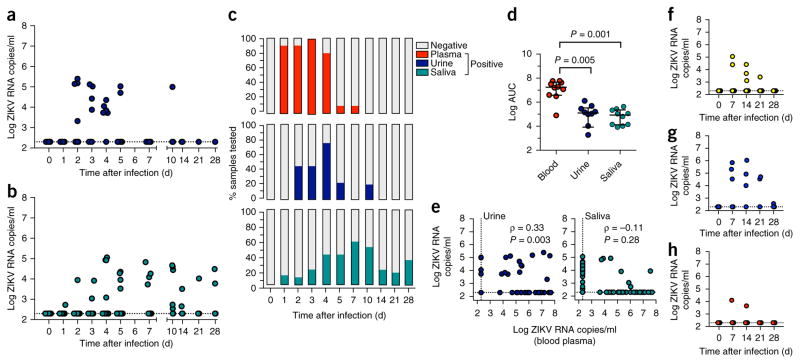
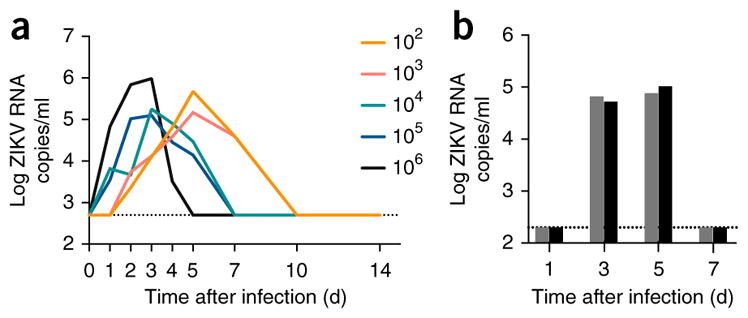
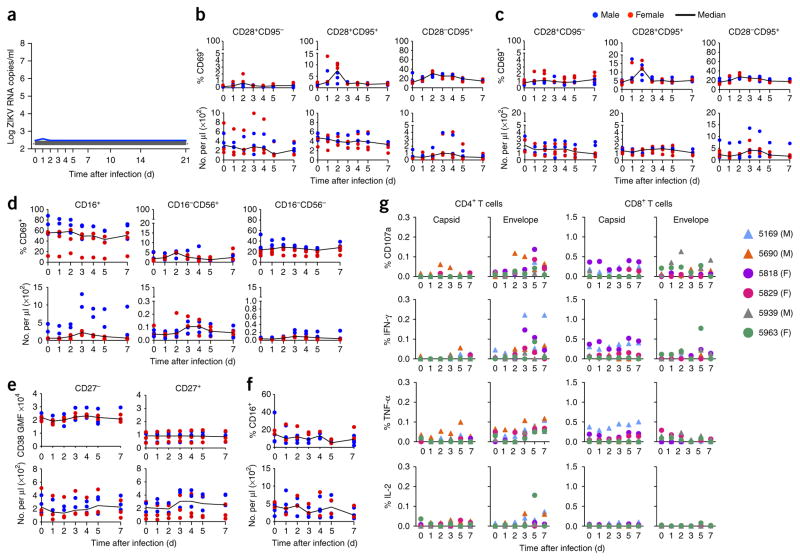
Infection with Zika virus has been associated with serious neurological complications and fetal abnormalities. However, the dynamics of viral infection, replication and shedding are poorly understood. Here we show that both rhesus and cynomolgus macaques are highly susceptible to infection by lineages of Zika virus that are closely related to, or are currently circulating in, the Americas. After subcutaneous viral inoculation, viral RNA was detected in blood plasma as early as 1 d after infection. Viral RNA was also detected in saliva, urine, cerebrospinal fluid (CSF) and semen, but transiently in vaginal secretions. Although viral RNA during primary infection was cleared from blood plasma and urine within 10 d, viral RNA was detectable in saliva and seminal fluids until the end of the study, 3 weeks after the resolution of viremia in the blood. The control of primary Zika virus infection in the blood was correlated with rapid innate and adaptive immune responses. We also identified Zika RNA in tissues, including the brain and male and female reproductive tissues, during early and late stages of infection. Re-infection of six animals 45 d after primary infection with a heterologous strain resulted in complete protection, which suggests that primary Zika virus infection elicits protective immunity. Early invasion of Zika virus into the nervous system of healthy animals and the extent and duration of shedding in saliva and semen underscore possible concern for additional neurologic complications and nonarthropod-mediated transmission in humans.


Conflict of interest statement

The authors declare no competing financial interests.

Figures

Figure 1
Figure 1
Blood plasma ZIKV RNA kinetics during primary infection. (a) Viral replication kinetics after subcutaneous infection of ten Indian-origin rhesus macaques with 1 × 10⁶ PFU of a Thai isolate. ZIKV replication was monitored between days 1 and 28 after infection. Log10 virus RNA copies per ml in blood plasma samples from individual animals are shown in gray. Median log10 ZIKV RNA copies for male (n = 5) and female (n = 5) are shown in red and blue, respectively. The limit of detection (<200 RNA copies/ml) for blood plasma is indicated (black hatched line). (b) The blood plasma ZIKV RNA levels at peak viremia or combined burden as AUC were compared between male and female monkeys. The results are expressed as the median with interquartile range. Each dot represents one animal. Comparison between groups was determined using a Mann–Whitney test. Error bars indicate interquartile range with median.
Figure 2
Figure 2
Timing and magnitude of ZIKV shedding in CSF and mucosal fluids during primary infection. (a,b) ZIKV RNA was extracted from each specimen and quantitated by RT–qPCR in urine (a) or saliva (b). (c) The percentage of ZIKV RNA positive blood plasma, urine and saliva samples are shown over time after infection. (d) The total ZIKV RNA burden found in blood, urine and saliva, as expressed as AUC. (e) The association between ZIKV RNA levels in blood plasma and each of urine or saliva is shown. The strength and direction of any association was assessed. Spearman correlation coefficient (ρ) and P value are indicated. (fh) Longitudinal (weekly) ZIKV RNA measurements in CSF (f), semen (g) and vaginal fluids (h) are shown. Error bars indicate interquartile range with median. The comparison of the values from the groups of animals was determined using a nonparametric Kruskal–Wallis test with multiple-comparison test.
Figure 3
Figure 3
Infection of rhesus macaques with a Puerto Rican ZIKV isolate. (a) 13 Indian-origin rhesus monkeys were used to titrate a PR ZIKV isolate. Two animals per group were infected with 1 × 10² or 1 × 10⁶ TCID50 units, and three animals per group were infected with 1 × 10³, 1 × 10⁴ or 1 × 10⁵ TCID50 units, delivered subcutaneously. Viral load was monitored, and the median blood plasma ZIKV RNA levels are shown between days 1 and 14 after infection. Eight cynomolgus monkeys were then subcutaneously infected with 1 × 10⁵ TCID50 units of the same PR ZIKV isolate, and then two monkeys were euthanized on each of days 1, 3, 5 and 7 for the detection of ZIKV RNA in various tissues by RNAscope in situ hybridization. (b) The blood plasma ZIKV RNA levels at the time of euthanasia are shown. The limit of detection (<200 RNA copies/ml) for blood plasma is indicated (black hatched line).
Figure 4
Figure 4
Detection of ZIKV RNA in lymphoid, neurologic and reproductive tissues. (ac) Detection of ZIKV RNA by RNAscope in lymph nodes on days 3 (top), 5 (middle) and 7 (bottom) (a), lymphoid and reproductive tissues on day 7 (b) and cerebellum on days 5 (left) and 7 (right) (c). Red spots indicate ZIKV RNA. (d,e) Subsequent immunofluorescence staining was as follows: lymph nodes on day 7 were stained for CD163 and CD68 (myeloid cells, green), ZIKV RNA (red), myeloperoxidase (MPO, neutrophils, blue) and DAPI (DNA, gray) (d); cerebellum was stained on day 5 for NeuN (neurons, green), ZIKV RNA (red), Iba1 (microglia, blue) and DAPI (e). White arrows indicate ZIKV-infected cells. Images are representative of (n = 2) per time point. All images are shown at 60× magnification. All scale bars, 200 μm.
Figure 5
Figure 5
Protection against heterologous challenge with a Puerto Rican ZIKV isolate. (a) Six animals (three females and three males) were re-challenged subcutaneously with 1 × 10⁵ TCID50 of a PR ZIKV isolate 45 d after primary infection. Viral RNA levels in blood plasma were monitored between days 1 and 21 after the secondary challenge. ZIKV RNA copies in blood plasma are indicated. A single positive sample, detected in one male monkey 1 d after infection, is indicated (blue solid line). Lymphocyte activation and frequencies were measured during re-challenge. Activation and numbers of T cells, B cells, NK cells and monocytes were measured by flow cytometry on days 0, 1, 2, 3, 4, 5 and 7 after ZIKV infection of three male and three female monkeys. (b,c) Percentage of activated (CD69+) and total numbers of naive (CD28+CD95) (left), central memory (CD28+CD95+) (middle), and effector and effector memory (CD28CD95+) (right) CD4+ (b) and CD8+ (c) T cell subsets in whole blood. (d) Percentage of activated (CD69+) and total numbers of CD16+ (left), CD16CD56+ (middle) and CD16CD56 (right) NK cells in whole blood. (e) CD38 expression (geometric mean fluorescence of CD38) and total numbers of naive (CD27) (left) and memory (CD27+) (right) B cells in whole blood. (f) Percentage of activated and total numbers of monocytes in whole blood. Black line indicates median. Individual values are shown for males (blue) and females (red). (g) ZIKV-specific T cell responses were measured during ZIKV re-challenge. T cell degranulation and cytokine production (in PBMCs) was measured by flow cytometry after the stimulation of cells on days 0, 1, 2, 3, 5 and 7 after re-challenge with overlapping peptide pools spanning the entire ZIKV capsid and envelope proteins. Percentage of cells expressing CD107a, interferon (IFN)-γ, tumor necrosis factor (TNF)-α and IL-2 after a 6-h peptide stimulation are shown. The threshold for determining positive values, after background subtraction of unstimulated corresponding samples, was applied as previously described. Values below this threshold were set to a value of 0. Values greater than 1.5-fold above that of the day of re-challenge were considered to be anamnestic. Each monkey is indicated by a different color symbol. Triangles indicate males, and circles indicate females.

References

    1. Dick GW, Kitchen SF, Haddow AJ. Zika virus. I Isolations and serological specificity. Trans R Soc Trop Med Hyg. 1952;46:509–520. - PubMed
    1. Brasil P, et al. Zika virus outbreak in Rio de Janeiro, Brazil: clinical characterization, epidemiological and virological Aspects. PLoS Negl Trop Dis. 2016;10:e0004636. - PMC - PubMed
    1. Cerbino-Neto J, et al. Clinical manifestations of Zika virus infection, Rio de Janeiro, Brazil, 2015. Emerg Infect Dis. 2016;22:1318–1320. - PMC - PubMed
    1. Duffy MR, et al. Zika virus outbreak on Yap Island, Federated States of Micronesia. N Engl J Med. 2009;360:2536–2543. - PubMed
    1. Campos GS, Bandeira AC, Sardi SI. Zika virus outbreak, Bahia, Brazil. Emerg Infect Dis. 2015;21:1885–1886. - PMC - PubMed

Publication types

MeSH terms