. 2016 Oct 3:7:12914.
doi: 10.1038/ncomms12914.

Histone variant H3F3A promotes lung cancer cell migration through intronic regulation

Affiliations

Histone variant H3F3A promotes lung cancer cell migration through intronic regulation

Seong-Min Park et al. Nat Commun. .

Abstract

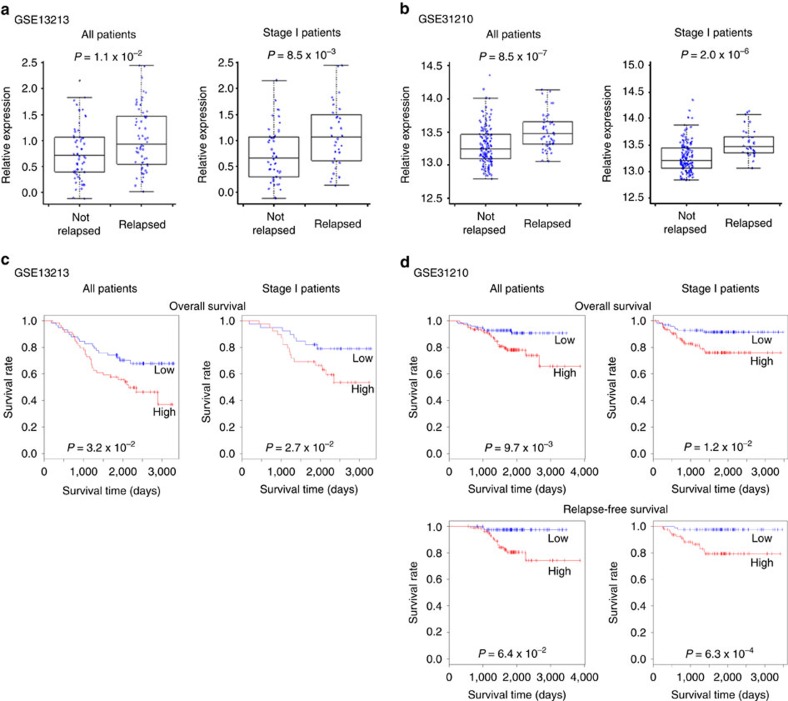
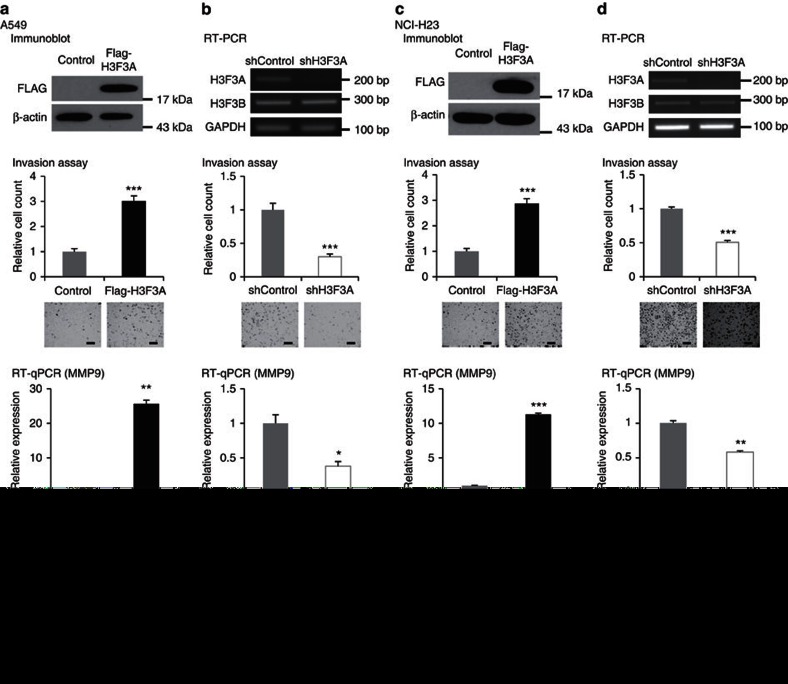
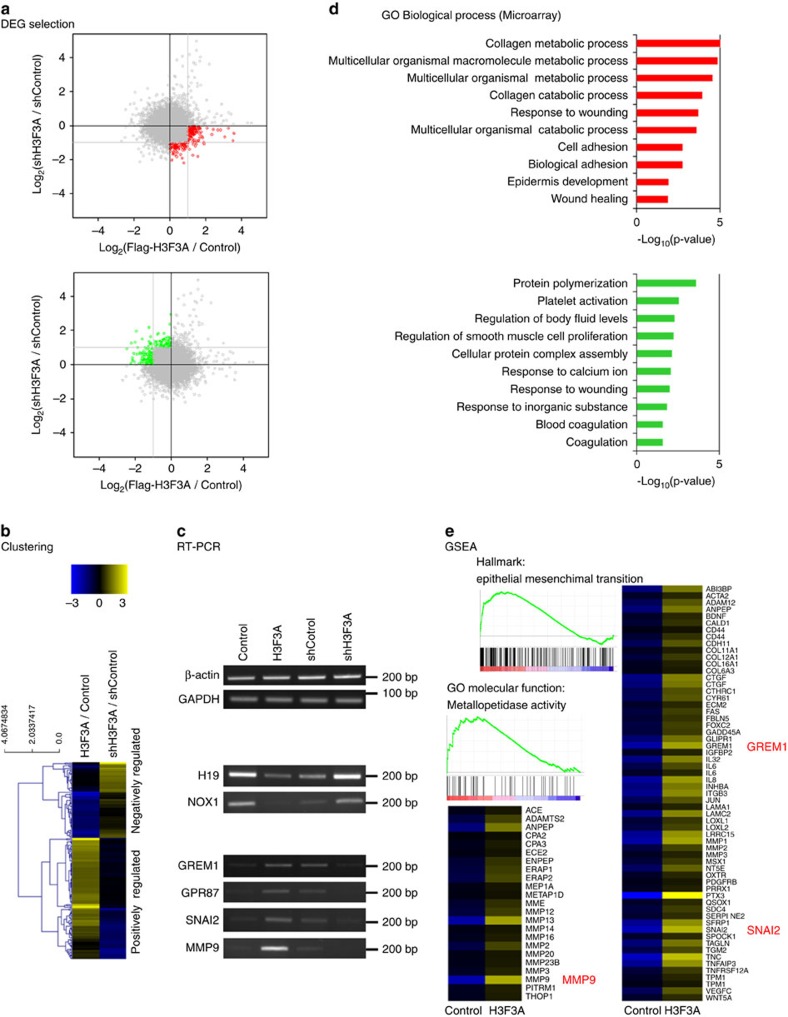
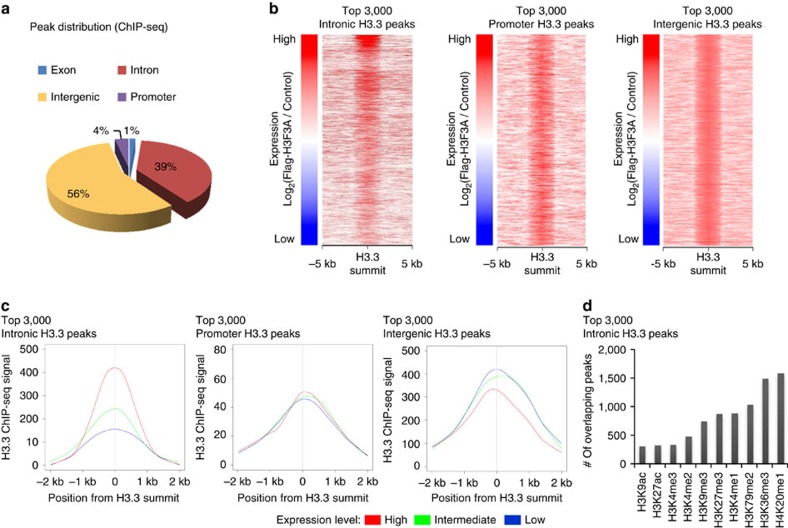
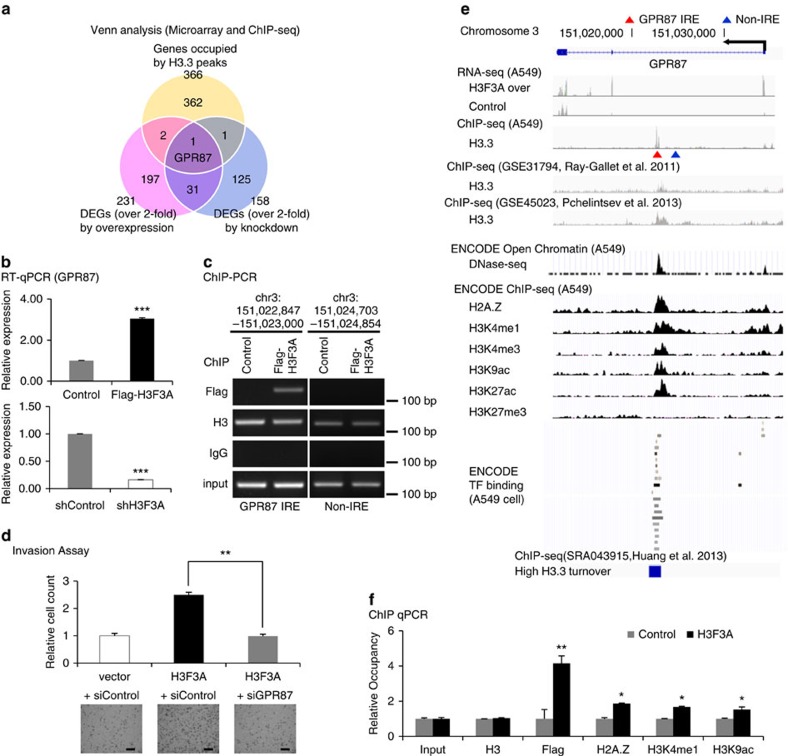
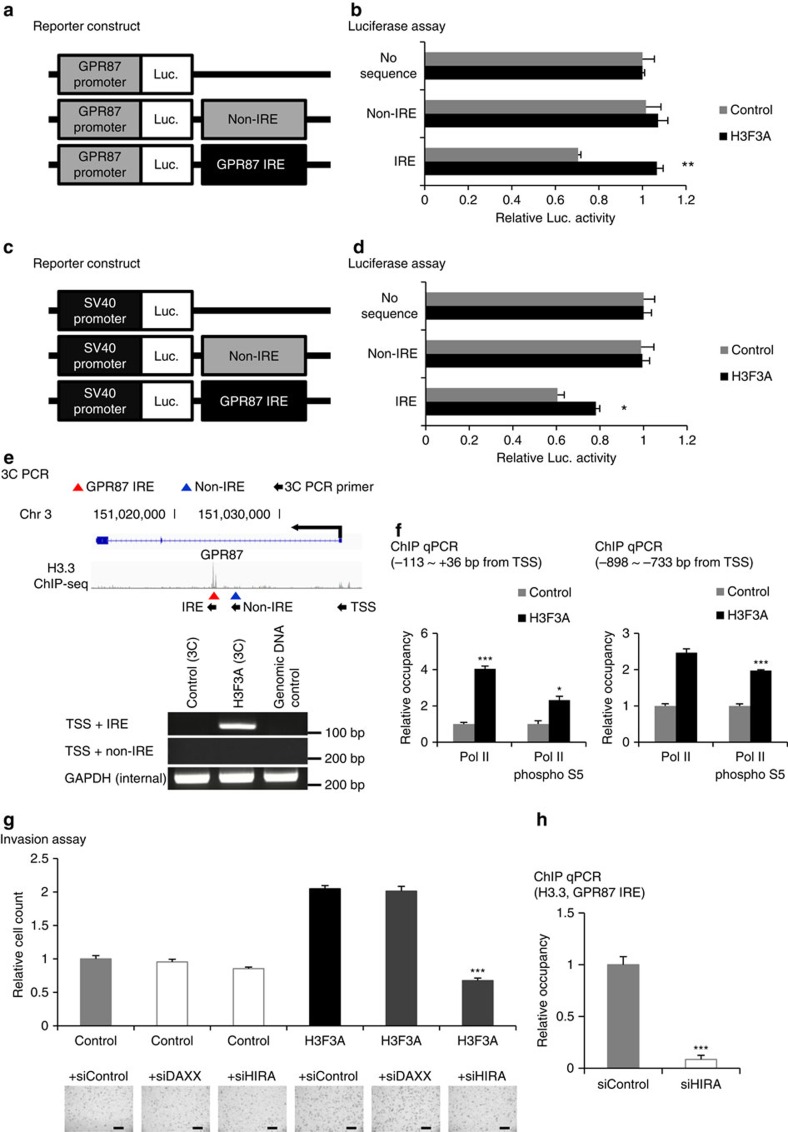
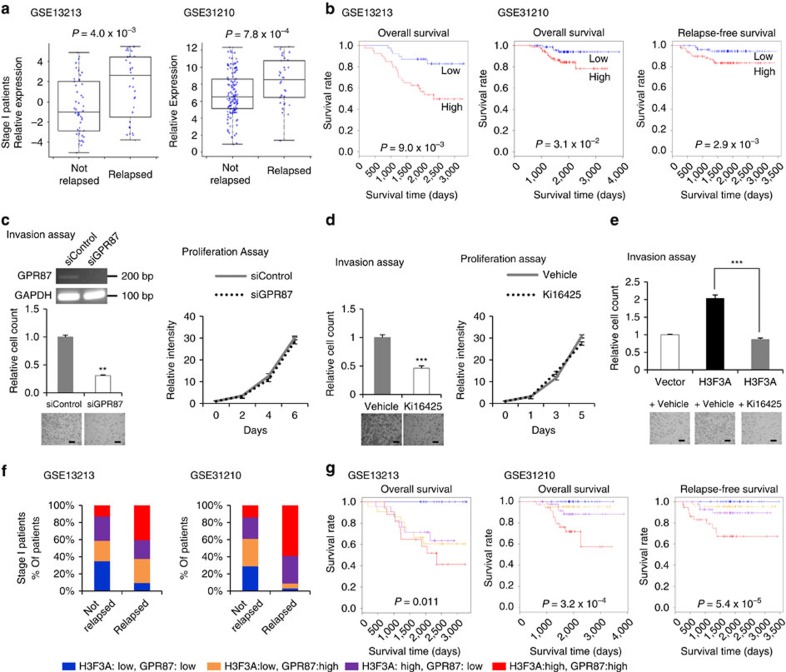
Although several somatic single nucleotide variations in histone H3.3 have been investigated as cancer drivers, other types of aberration have not been well studied. Here, we demonstrate that overexpression of H3F3A, encoding H3.3, is associated with lung cancer progression and promotes lung cancer cell migration by activating metastasis-related genes. H3.3 globally activates gene expression through the occupation of intronic regions in lung cancer cells. Moreover, H3.3 binding regions show characteristics of regulatory DNA elements. We show that H3.3 is deposited at a specific intronic region of GPR87, where it modifies the chromatin status and directly activates GPR87 transcription. The expression levels of H3F3A and GPR87, either alone or in combination, are robust prognostic markers for early-stage lung cancer, and may indicate potential for the development of treatments involving GPR87 antagonists. In summary, our results demonstrate that intronic regulation by H3F3A may be a target for the development of novel therapeutic strategies.


Conflict of interest statement

The authors declare no competing financial interests.

Figures

Figure 1
Figure 1. Promotion of lung cancer progression by H3F3A overexpression.
(a) Comparison of H3F3A expression in relapsed and non-relapsed lung cancer patients (GSE13213, Tomida et al.. All: n=117, P=1.1 × 10⁻², stage I: n=79, P=8.5 × 10⁻³, t-test). (b) (GSE31210, Okayama et al.. All: n=204, P=8.5 × 10⁻⁷, stage I: n=162, P=2.0 × 10⁻⁶, t-test). (c) Prognosis of two groups of lung cancer patients classified by H3F3A expression (GSE13213, Tomida et al.. All: n=117, P=3.2 × 10⁻², stage I: n=79, P=2.7 × 10⁻², log-rank test). (d) (GSE31210, Okayama et al.. All: n=204, P=9.7 × 10⁻³ for overall survival, P=6.4 × 10⁻² for relapse-free survival; stage I: n=162, P=1.2 × 10⁻² for overall survival, P=6.3 × 10⁻⁴ for relapse-free survival, log-rank test). Red: high expression group, blue: low expression group.
Figure 2
Figure 2. Promotion of lung cancer cell invasion by H3F3A overexpression.
(a) Results of invasion assay, MMP9 RT-qPCR and proliferation assay after ectopic H3F3A overexpression in A549 cells. (b) After H3F3A knockdown in A549 cells. (c) After ectopic H3F3A overexpression in NCI-H23 cells. (d) After H3F3A knockdown in NCI-H23 cells. Data are representative of three independent experiments. The error bars represent the s.e.m. *P<0.05, **P<0.01, ***P<0.001, t-test. Scale bar, 200 μm.
Figure 3
Figure 3. Microarray-based global analysis for transcriptional regulation via H3F3A.
(a) Selection of DEGs using the expression microarray analysis in H3F3A-altered A549 cells. (b) Expression pattern of the DEGs. (c) Validation of DEGs using RT-PCR. (d) GO analysis result of the DEGs (GO_BP). (e) Gene set enrichment analysis result of the positively correlated DEGs.
Figure 4
Figure 4. Chip-seq-based global analysis for transcriptional regulation via H3F3A.
(a) Genomic distribution of H3.3 ChIP-seq peaks in H3F3A-overexpressed A549 cells. (b) Correlation between H3.3 occupancy and target gene expression at intron, promoter and intergenic region. (c) H3.3 binding profile of intronic/promoter/intergenic peaks of three gene groups classified by the expression level (red: high expression group, yellow-green: intermediate expression group, blue: low expression group). (d) Association of H3.3 peaks with various histone marks.
Figure 5
Figure 5. Selection and validation of an H3.3 target gene.
(a) Selection of putative direct target genes of H3F3A with microarray and ChIP-seq data. (b) RT-qPCR validation of the changes in the expression of GPR87 induced by H3F3A overexpression and knockdown. (c) Validation of H3.3 binding to the IRE of GPR87 using a ChIP-PCR assay (GPR87 IRE: chr3:151,022,847-151,023,000; Non-IRE: chr3:151,024,703-151,024,854). (d) Results of invasion assays after ectopic H3F3A overexpression and GPR87 knockdown. (e) Integrated analysis near GPR87 gene. (f) Chromatin status modification at GPR87 IRE due to ectopic H3F3A overexpression. Data are representative of three independent experiments. The error bars represent the s.e.m. *P<0.05, **P<0.01, ***P<0.001, t-test. Scale bar, 200 μm.
Figure 6
Figure 6. Transcriptional regulation of GPR87 by H3F3A.
(a) The element-directed reporter construct (GPR87 promoter). (b) The results of luciferase assays using the reporter (GPR87 promoter). (c) The element-directed reporter construct (SV40 promoter). (d) The results of luciferase assays using the reporter (SV40 promoter). (e) Validation of chromatin interaction changes between the GPR87 IRE and TSS due to H3F3A overexpression. (f) Validation of transcriptional machinery activation at the TSS by H3F3A overexpression. (g) Invasion assay with H3F3A overexpression after DAXX or HIRA knockdown. (h) ChIP-qPCR assay with H3F3A overexpression after HIRA knockdown (Flag ChIP at GPR87 IRE). Data are representative of three independent experiments. The error bars represent the s.e.m. *P<0.05, **P<0.01, ***P<0.001, t-test. Scale bar, 200 μm.
Figure 7
Figure 7. Promotion of lung cancer by H3F3A and GPR87 combination.
(a) Comparison of GPR87 expression in relapsed and non-relapsed lung cancer patients. (P=4.0 × 10⁻³ for GSE13213 (n=79) and P=7.8 × 10⁻⁴ for GSE31210 (n=162), t-test). (b) Prognosis of two groups of lung cancer patients classified by GPR87 expression. (P=9.0 × 10⁻³ for GSE13213 (n=79), 3.1 × 10⁻² for overall survival of GSE31210 (n=162) and P=2.9 × 10⁻³ for relapse-free survival of GSE31210 (n=162), log-rank test; red: high expression group, blue: low expression group). (c) Results of invasion and proliferation assays after GPR87 knockdown. (d) Results of invasion and proliferation assays after LPA receptor antagonist (Ki16425) treatment. (e) Results of invasion assays after ectopic H3F3A overexpression and LPA receptor antagonist (Ki16425) treatment. (f) Comparison of the portion of stage I lung adenocarcinoma patient groups stratified by H3F3A and GPR87 expression between non-relapsed and relapsed patients. (g) Prognosis of stage I lung adenocarcinoma patient groups stratified by H3F3A and GPR87 expression. (Blue: low H3F3A, low GPR87; orange: low H3F3A, high GPR87; purple: high H3F3A, low GPR87; red: high H3F3A, high GPR87). Data are representative of three independent experiments. The error bars represent the s.e.m. *P<0.05, **P<0.01, ***P<0.001, t-test. Scale bar, 200 μm.

References

    1. Siegel R., Naishadham D. & Jemal A. Cancer statistics, 2013. CA Cancer J. Clin. 63, 11–30 (2013). - PubMed
    1. Hoffman P. C., Mauer A. M. & Vokes E. E. Lung cancer. Lancet 355, 479–485 (2000). - PubMed
    1. Nesbitt J. C., Putnam J. B. Jr., Walsh G. L., Roth J. A. & Mountain C. F. Survival in early-stage non-small cell lung cancer. Ann. Thorac. Surg. 60, 466–472 (1995). - PubMed
    1. Roselli M. et al.. Postsurgical chemotherapy in stage IB nonsmall cell lung cancer: long-term survival in a randomized study. Int. J. Cancer 119, 955–960 (2006). - PubMed
    1. Douillard J. Y. et al.. Adjuvant vinorelbine plus cisplatin versus observation in patients with completely resected stage IB-IIIA non-small-cell lung cancer (Adjuvant Navelbine International Trialist Association [ANITA]): a randomised controlled trial. Lancet Oncol. 7, 719–727 (2006). - PubMed

Publication types

MeSH terms