

Transport of cerium oxide nanoparticles in saturated silica media: influences of operational parameters and aqueous chemical conditions
- PMID: 27694968
- PMCID: PMC5046158
- DOI: 10.1038/srep34135
Transport of cerium oxide nanoparticles in saturated silica media: influences of operational parameters and aqueous chemical conditions
Abstract
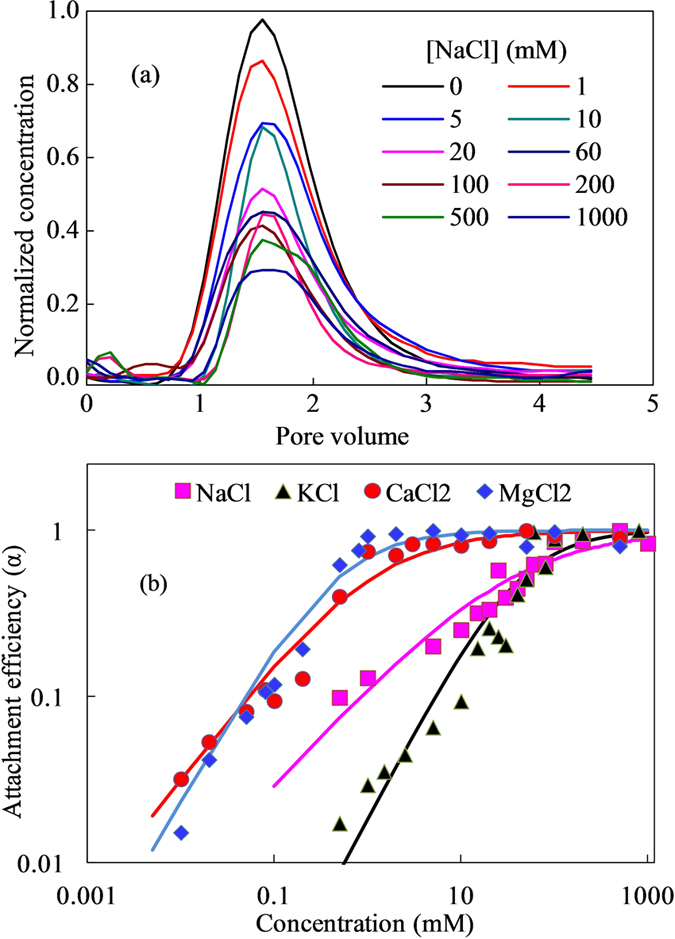
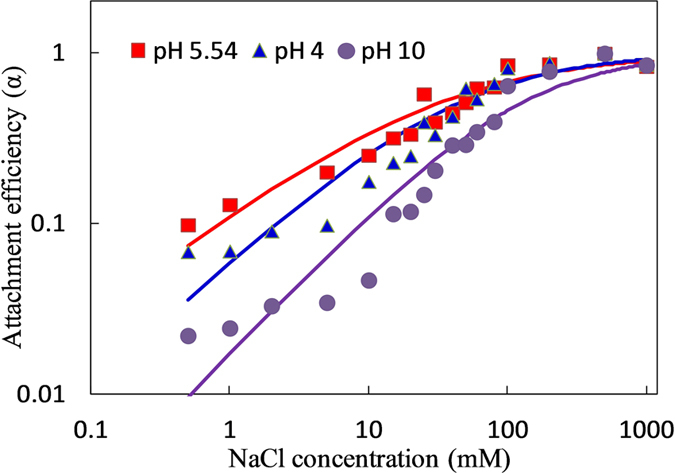
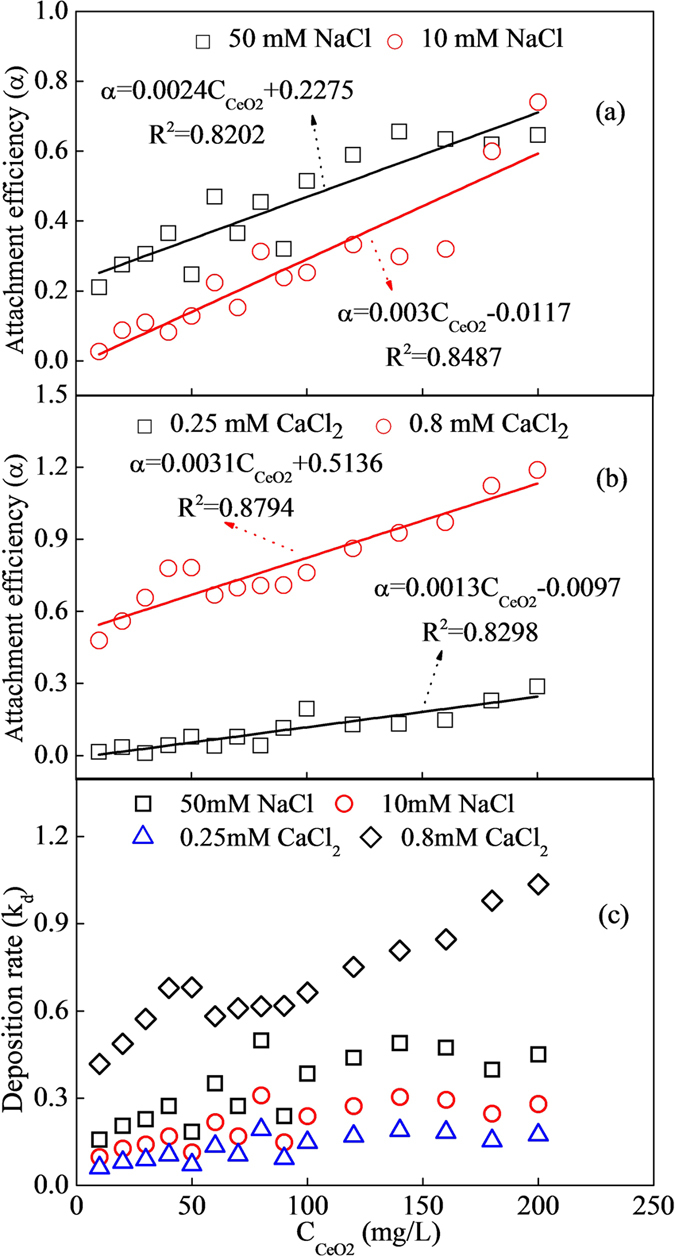
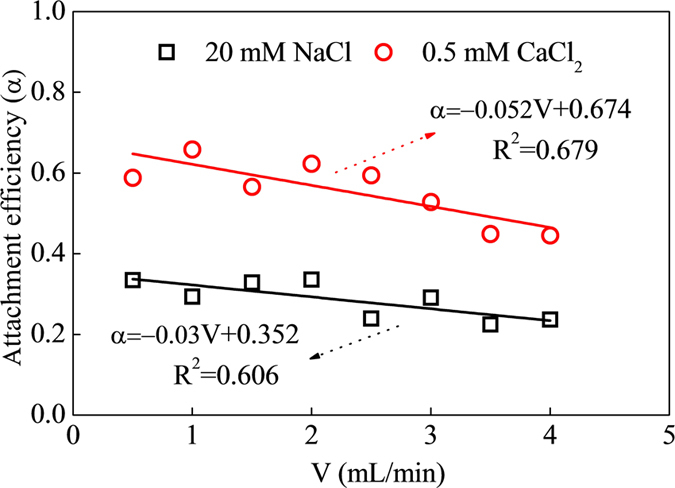
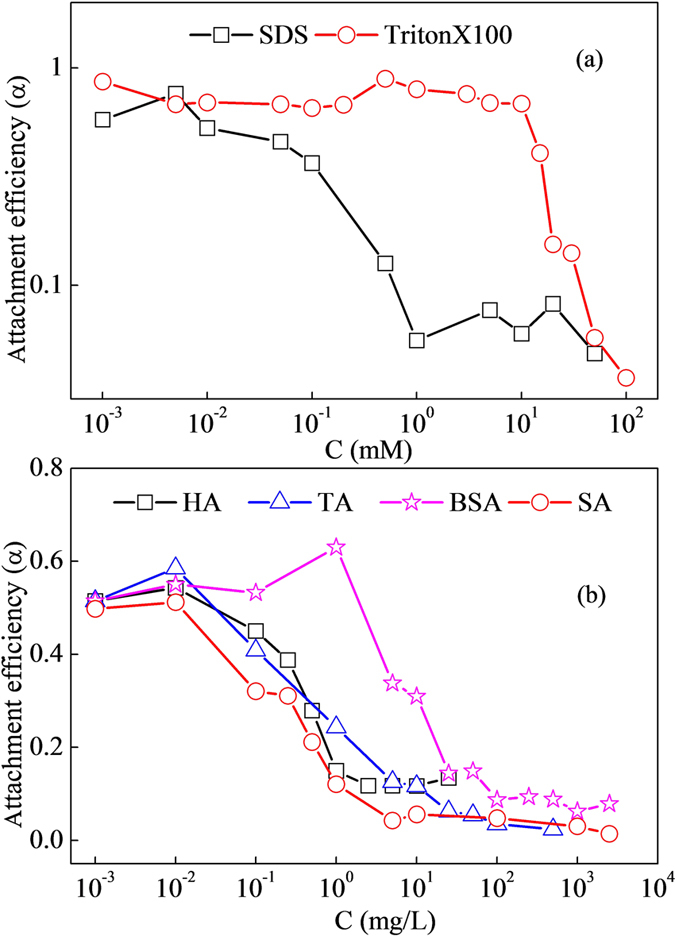
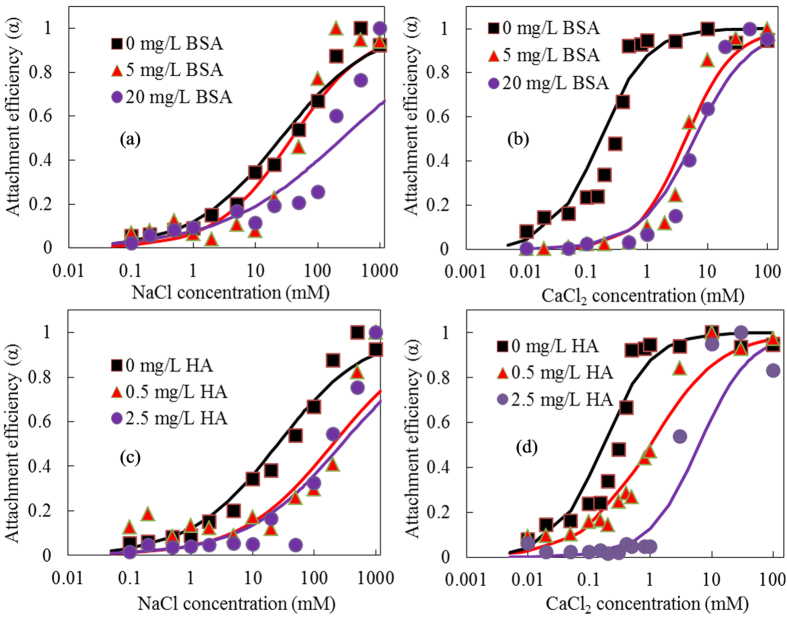
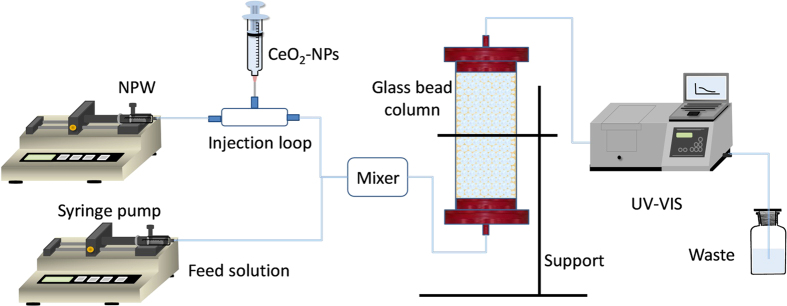
This paper aimed to investigate the influences of operational parameters and aqueous chemical conditions on transport behaviors of cerium oxides nanoparticles (CeO2-NPs) in saturated silica media. Results indicated that increasing rates of attachment efficiency (α) were related with cationic types, and critical deposition concentration (CDC) for divalent cation (Ca2+ and Mg2+) were more than 31-fold of that for monovalent cation (Na+ and K+). Increase or reduction of electrolyte pH could both promote the mobility of CeO2-NPs in glass beads, while influence was more evident at alkaline conditions. α increased linearly with NPs concentrations, while decreased linearly with flow velocity in the column, and effects were related with electrolyte contents. Presence of surfactants could sharply decreased α, and SDS was more effective to facilitate CeO2-NPs transport than Triton X-100. With DOMs concentrations increasing, α firstly kept constant, then sharply declined, and finally reduced very slowly. The influence of DOMs on NPs deposition was in order of SA > HA > TA > BSA. Overall, this study revealed that aqueous chemical conditions was crucial to NPs transport in porous media, and would provide significant information for our understanding on the fate and transport of nanoparticles in natural environment.
Figures
References
-
- Zhang F. et al.. Cerium oxide nanoparticles: size-selective formation and structure analysis. Appl. Phys. Lett. 80, 127–129 (2002).
-
- Murray E. P., Tsai T. & Barnett S. A. A direct methane fuel cell with a ceria based a node. Nature 400, 649–651 (1999).
-
- Collin B. et al.. Environmental release, fate and ecotoxicological effects of manufactured ceria nanomaterials. Environ. Sci. Nano 1, 533–548 (2014).
-
- Barton L. E., Auffan M., Olivi L., Bottero J. Y. & Wiesner M. R. Heteroaggregation, transformation and fate of CeO2 nanoparticles in wastewater treatment. Environ. Pollut. 203, 122–129 (2015). - PubMed
Publication types
LinkOut - more resources
Full Text Sources
Other Literature Sources
Miscellaneous
